We are familiar with “Sales Analysis” under the menu “Report” in the Sales module. This blog will discuss how to create an Analysis dashboard only using XML files for a custom module.
So let's start by creating a menu tab for the module.
<record id="record_action_views" model="ir.actions.act_window">
   <field name="name">Page Name</field>
   <field name="res_model">model.name</field>
   <field name="view_mode">graph,pivot,dashboard</field>
</record>
For the record, defined the model as ir.actions.act_window. Inside that record, we have provided the name for the record, which will show as the Page name for the report, specify the model for which the report has been created after the res_model ( eg: “project.task” ), and after that define the view modes need after view_mode, like graph pivot, dashboard, etc. the important part is to define the views as new records that we can define later.
Create a menu item inside that defines menu_id, parent menu id if there are any, menu name, and important thing action, which is the record id created above.
<menuitem id="menu_id"
         parent="parent_menu_id"
         name="menu_name"
         action="record_action_views"
         sequence="1"/>
Using the above two sets of codes, we can create a menu under a custom module and define the views needed for the model.
Similarly, we can add whatever views we want that exist in Odoo, like Tree, Form, Graph, Kanban, Calender, Pivot, etc.
Don’t forget to define the XML file in the manifest
'data': [
   'views/views.xml',
]
So that the XML file will be valid to use for views.
Next, we can move on to the views.
Here, we are going to define the views which we are going to use inside our dashboard.
For these views, we can set a separate view, or we can set it all within a dashboard view.
First, let's see how to create a Graph view for the custom model.
<!--    GRAPH-->
<record id="view_graph" model="ir.ui.view">
   <field name="name">view_graph</field>
   <field name="model">model.name</field>
   <field name="arch" type="xml">
       <graph string="Demo Model Analysis" type="line" sample="1">
           <field name="field_1" interval="day"/>
           <field name="field_2" type="row"/>
       </graph>
   </field>
</record>
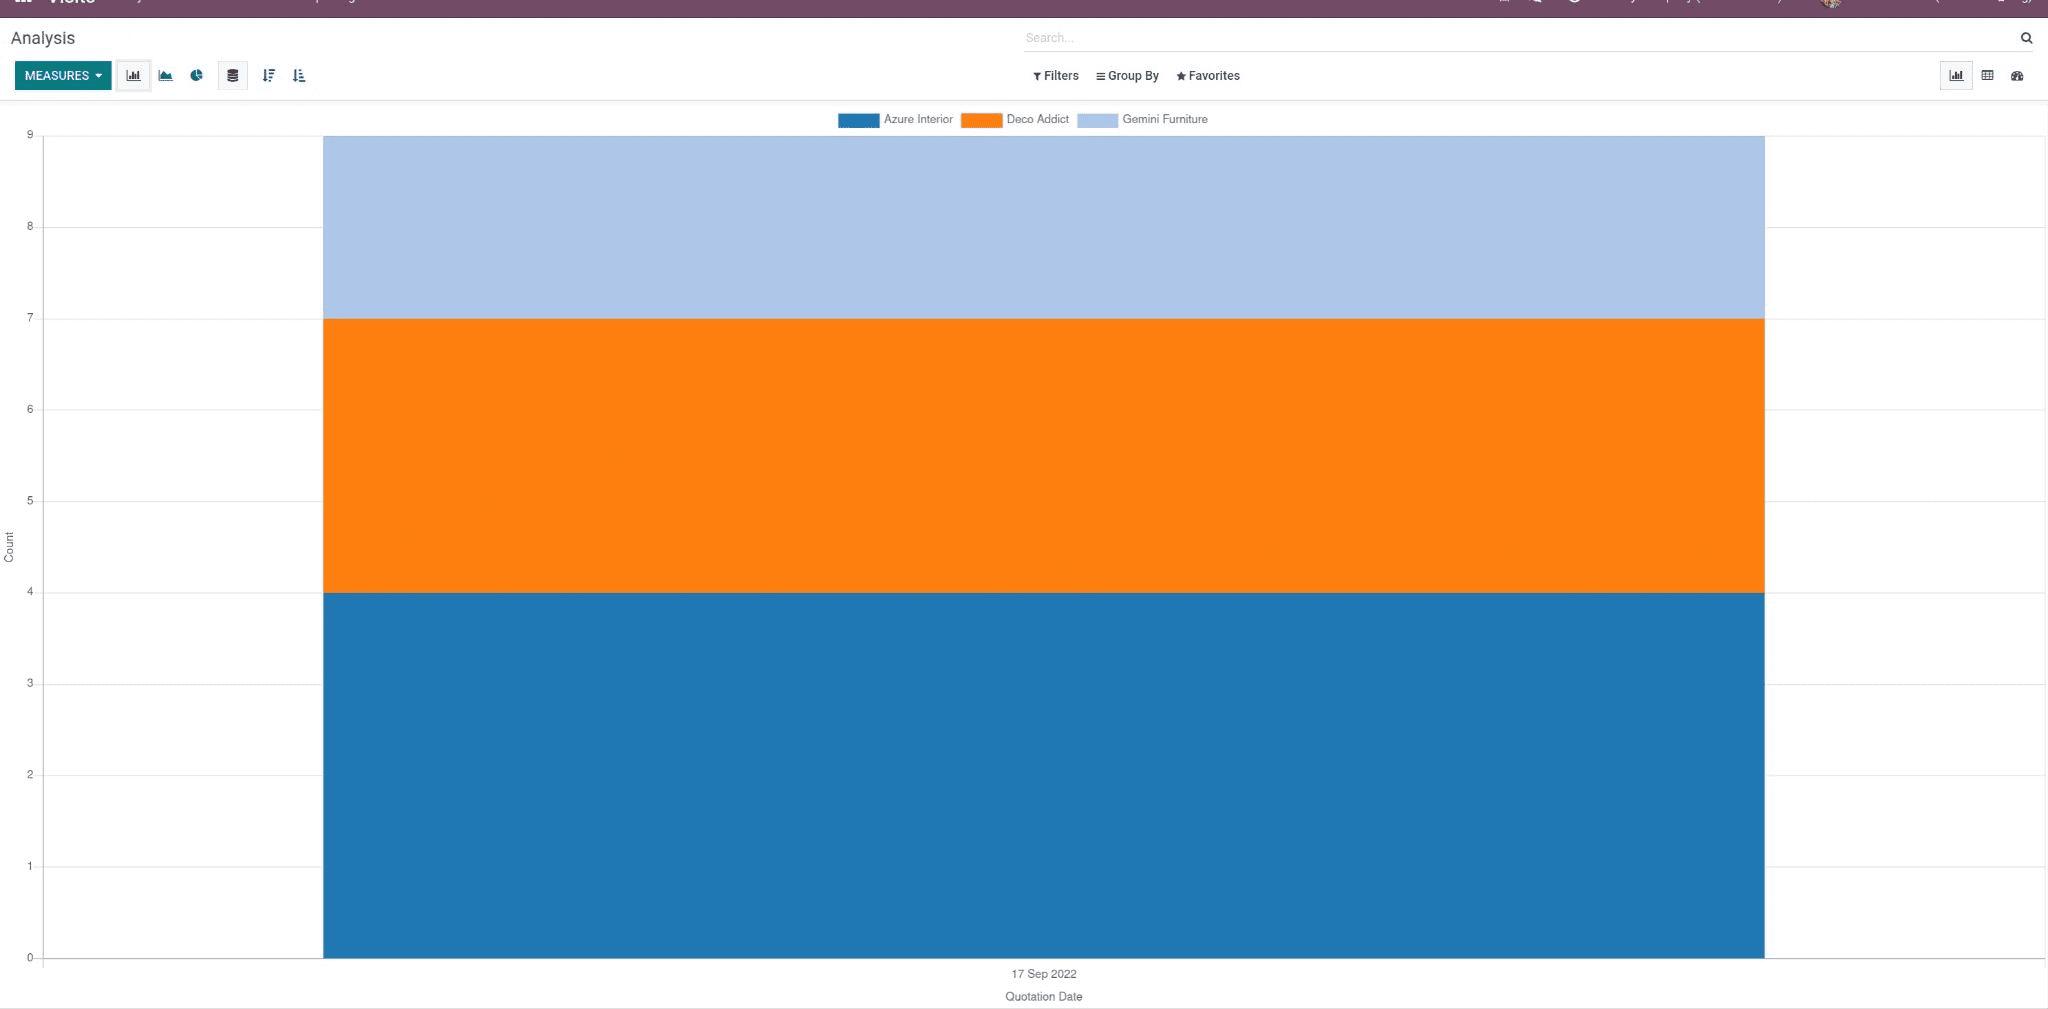
For the record defined the model as ir.ui.view and we have to provide the record id. Inside this record, we have provided the name for the record ( eg: view_graph ), provide the model for which the view is defined ( eg: model.name ), and the main part is to set the view tag. Here the view tag as graph ( eg: <graph></graph> ). Inside that tag we can provide the fields which show on the x-axis of graph and the y-axis of the graph. Here there are two fields given ( eg: field_1 and field_2 ). Also, inside the field, we can set whether it is the row ( eg: type=”row” ) or the column value ( eg: type=”col” ) by setting the type. Probably the interval of the graph is also we can set whether it is day or month or whatever (e.g., interval=”day”).
For the above graph view code, the view in the UI will be like this.
Next, we can see how to create a Pivot view for the custom model.
<!--    PIVOT-->
<record id="view_pivot" model="ir.ui.view">
   <field name="name">view_pivot</field>
   <field name="model">model.name</field>
   <field name="arch" type="xml">
       <pivot string="Demo Model Analysis" sample="1">
           <field name="field_1" interval="day" type="col"/>
           <field name="field_2" type="row"/>
       </pivot>
   </field>
</record>
In the above code we have defined a simple pivot view.
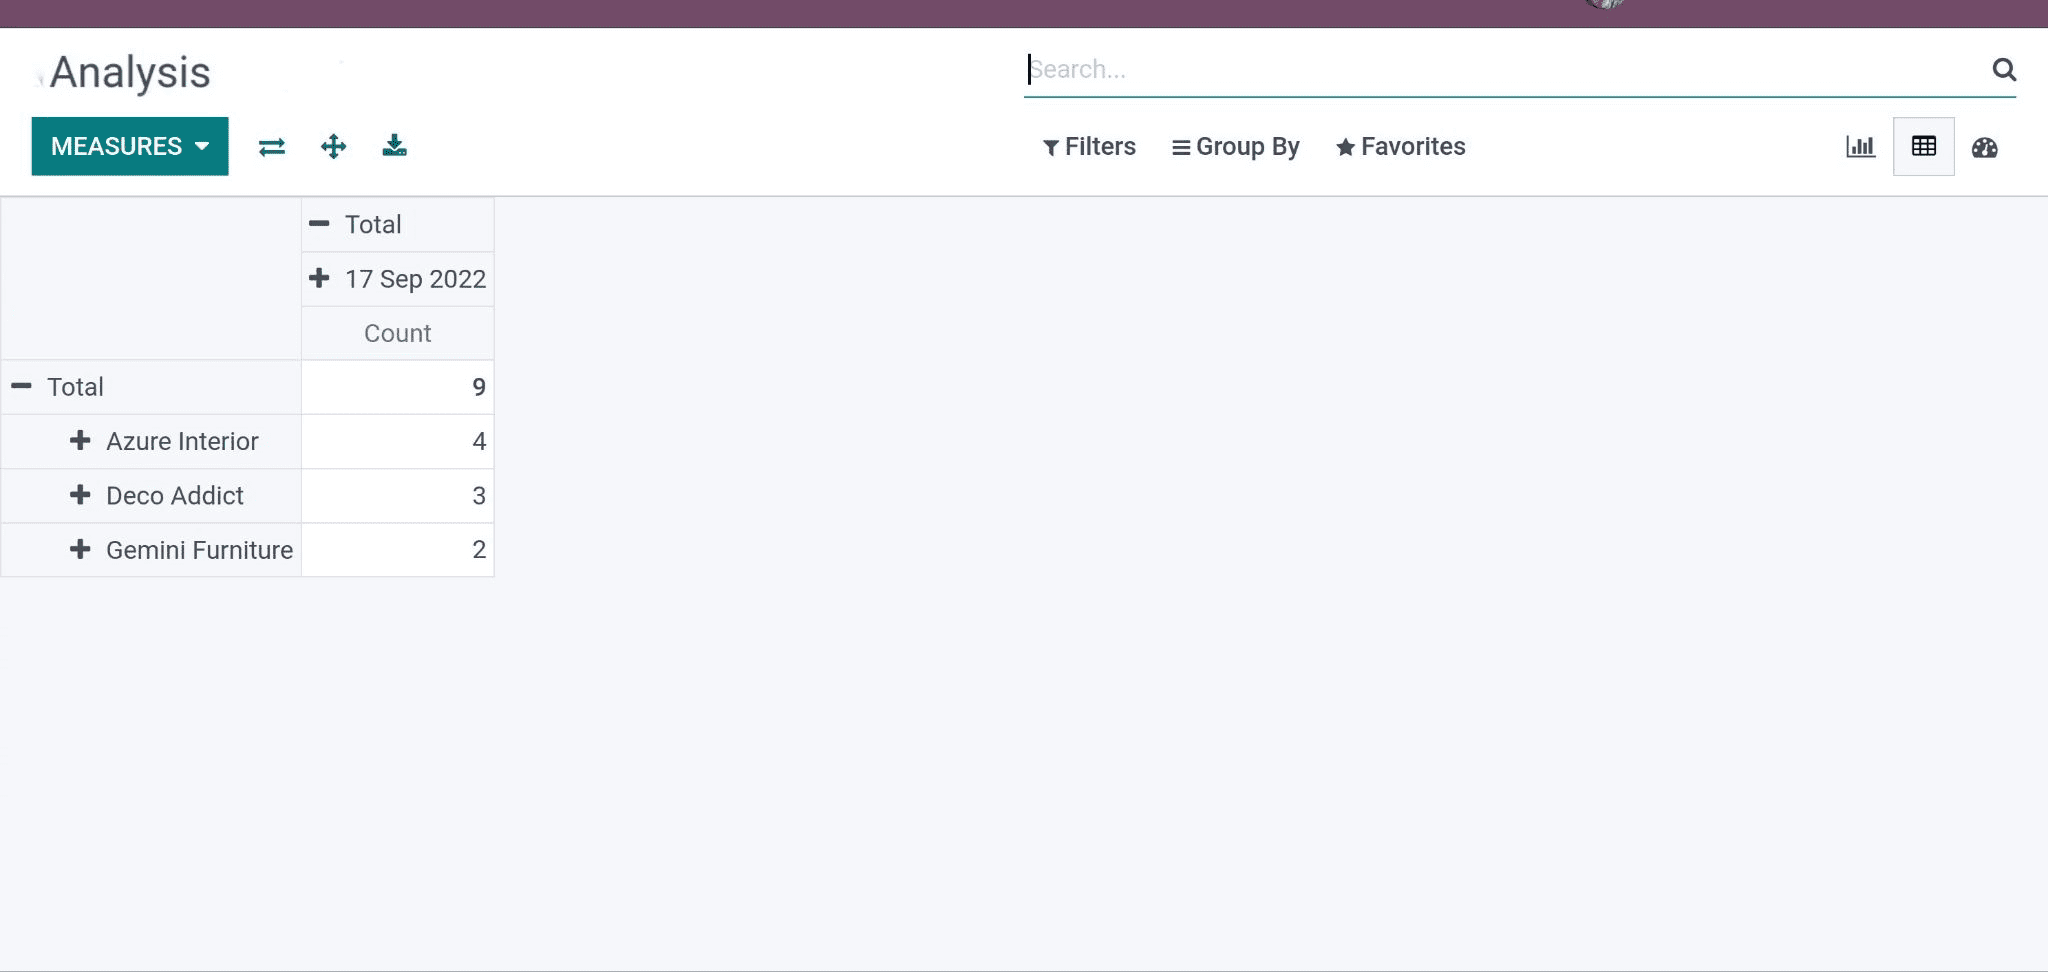
For the record, defined the model as ir.ui.view, and we have to provide the record id. Inside this record, we have provided the name for the record (e.g.: view_pivot ), provide the model for which the view is defined (e.g.: model.name ), and the main part is to set the view tag. Here the view tag is the pivot ( eg: <pivot></pivot> ). Inside that tag, we can provide the fields which show as the row and column for the table. Here there are two fields given ( eg: field_1 and field_2 ). also, inside the fields, we can set whether it is the row ( eg: type=”row” ) or the column value ( eg: type=”col” ) by setting the type.
For the above pivot view code, the view in the UI will be like this.
Next, we can move on to the main part of how to create a Dashboard view for the custom model which includes the reference for the other two views that we defined in the above records.
<record id="view_dashboard" model="ir.ui.view">
   <field name="name">view_dashboard</field>
   <field name="model">model.name</field>
   <field name="mode">primary</field>
   <field name="arch" type="xml">
       <dashboard sample="1">
           <view type="graph" ref="module_name.view_graph"/>
           <group>
               <group>
                   <aggregate name="field" string="#Field" field="field_1" clickable="False"/>
               </group>
               <group col="1">
                   <widget name="pie_chart" title="Status" attrs="{'groupby': 'example_field_state'}"/>
               </group>
               <group col="1">
                   <widget name="pie_chart" title="Date" attrs="{'groupby': 'example_field_date'}"/>
               </group>
           </group>
           <view type="pivot" ref="module_name.view_pivot"/>
       </dashboard>
   </field>
</record>
As mentioned in the above records, define the record id and model for the record. Then inside that, define the model for which the view is defined, name, etc.
Next coming to the Dashboard part is a view created using the dashboard tag
(eg: <dashboard></dashboard> ).
Inside that, we can set the reference to the views that we have already created.
Eg: <view type="graph" ref="module_name.view_graph"/>
By this, the view created separately for the model will come under the same dashboard view, and we can also expand them separately.
Then we can use the aggregate tag to count the field by giving the field name.
Eg: <aggregate name="field" string="#Field" field="field_1" clickable="False"/>
Also, we can set whether the view is clickable or not. The thing we pass on the string will be shown in the view. ( eg: string=”#Field” )
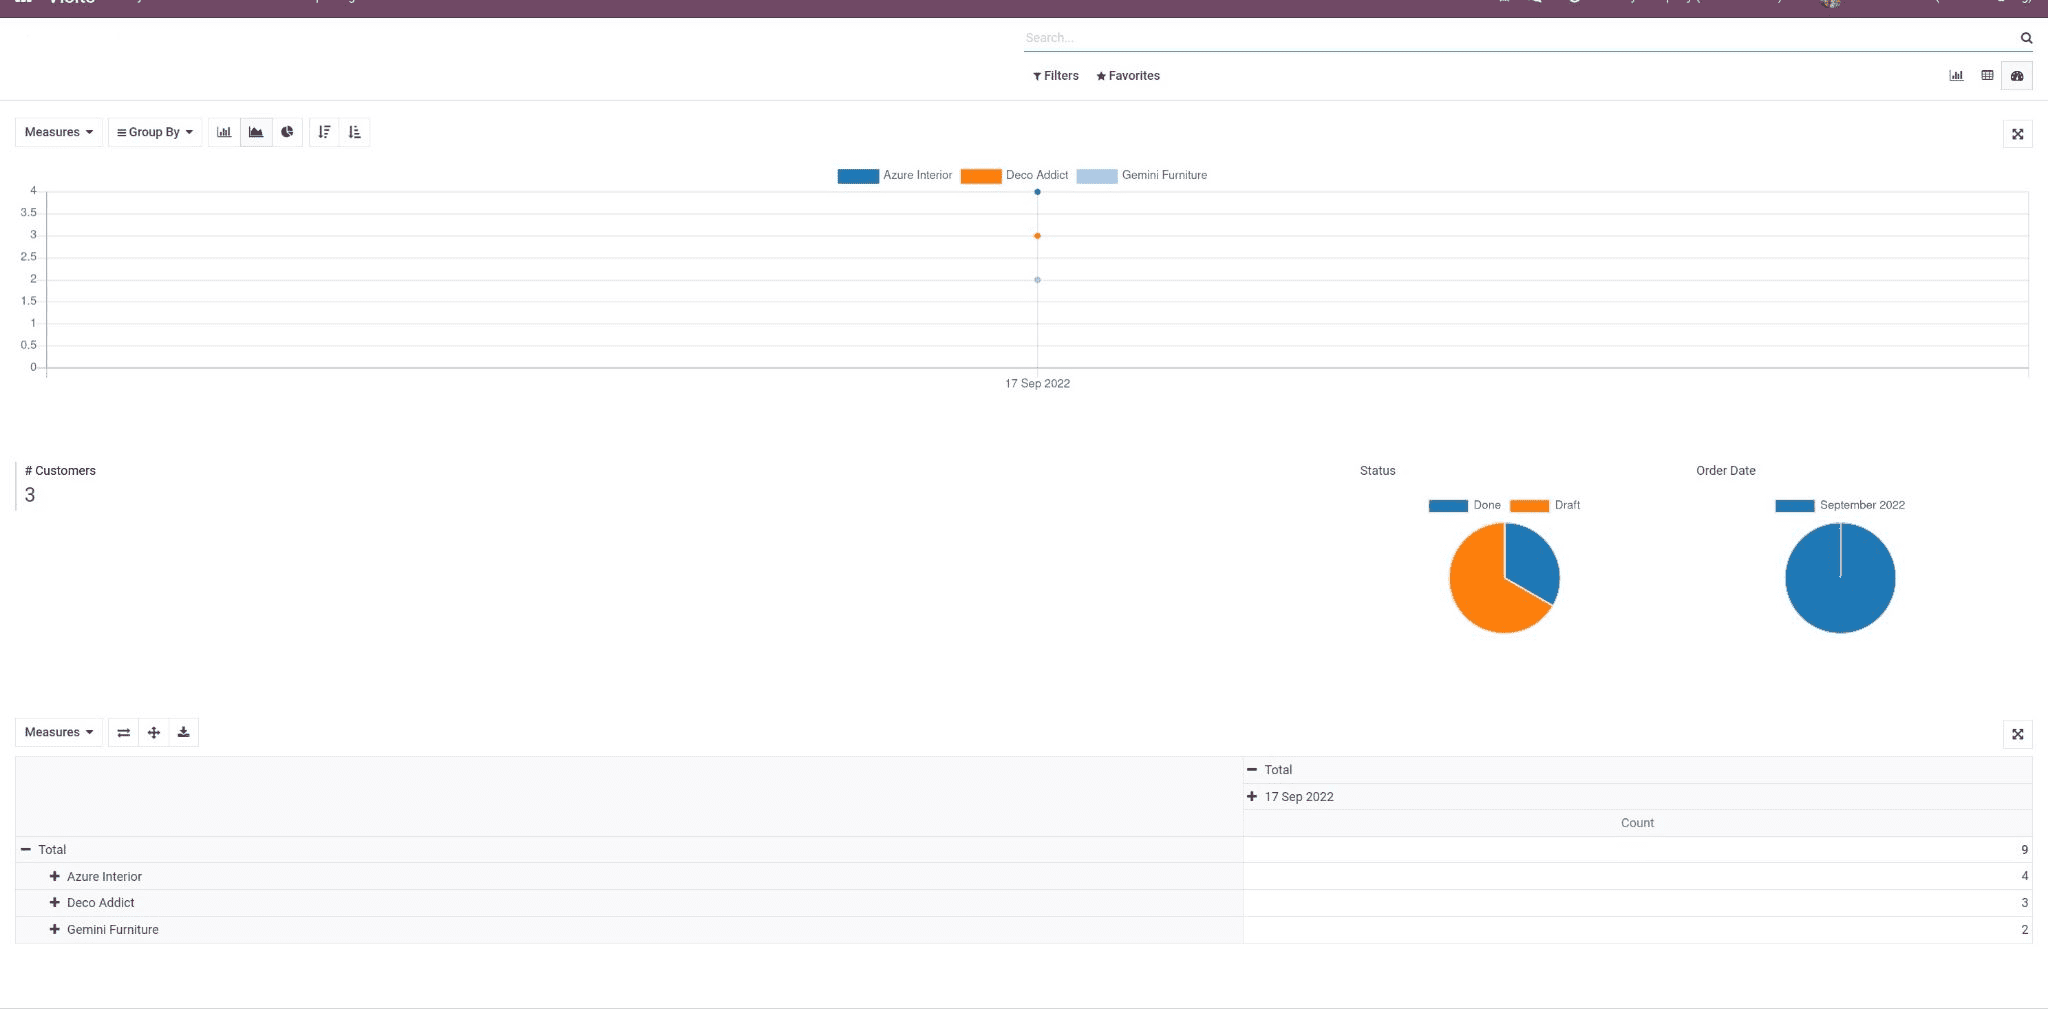
We can create a pie chart inside the dashboard by using the widget named pie chart, and we can define that by
Eg: <widget name="pie_chart" title="Date" attrs="{'groupby': 'example_field_date'}"/>The title will be shown at the top of the pie chart and the based field can be defined ‘groupby’: ‘field_name.’
For the above pivot view code, the view in the UI will be like this.
We have already defined the action window for these views at the beginning.
This is how the Dashboard view for a custom model is created.