In every business, a thorough work analysis is critical. Proper analysis is required for the proper operation of a business. As a result, the whole working information of a business may be easily evaluated from a single page. Reports are regarded as quite crucial in every business. It's possible that the reporting parameters differ depending on the company, and may need to perform various steps, such as filtering, in order to interact with those reports. With Odoo reports, all of these operations are simple and easy to implement. Let's take a closer look at how these work in Odoo 15 reports.
A wide range of views is accessible. The views in Odoo15 are List view, Kanban view, Calendar view, Pivot view, Graph view, and Activity view. Also, different Graphs like Bar charts, Line charts, Pie charts are available. In Odoo15, similar views are accessible in practically every module. Let's move on to the Sales App now.
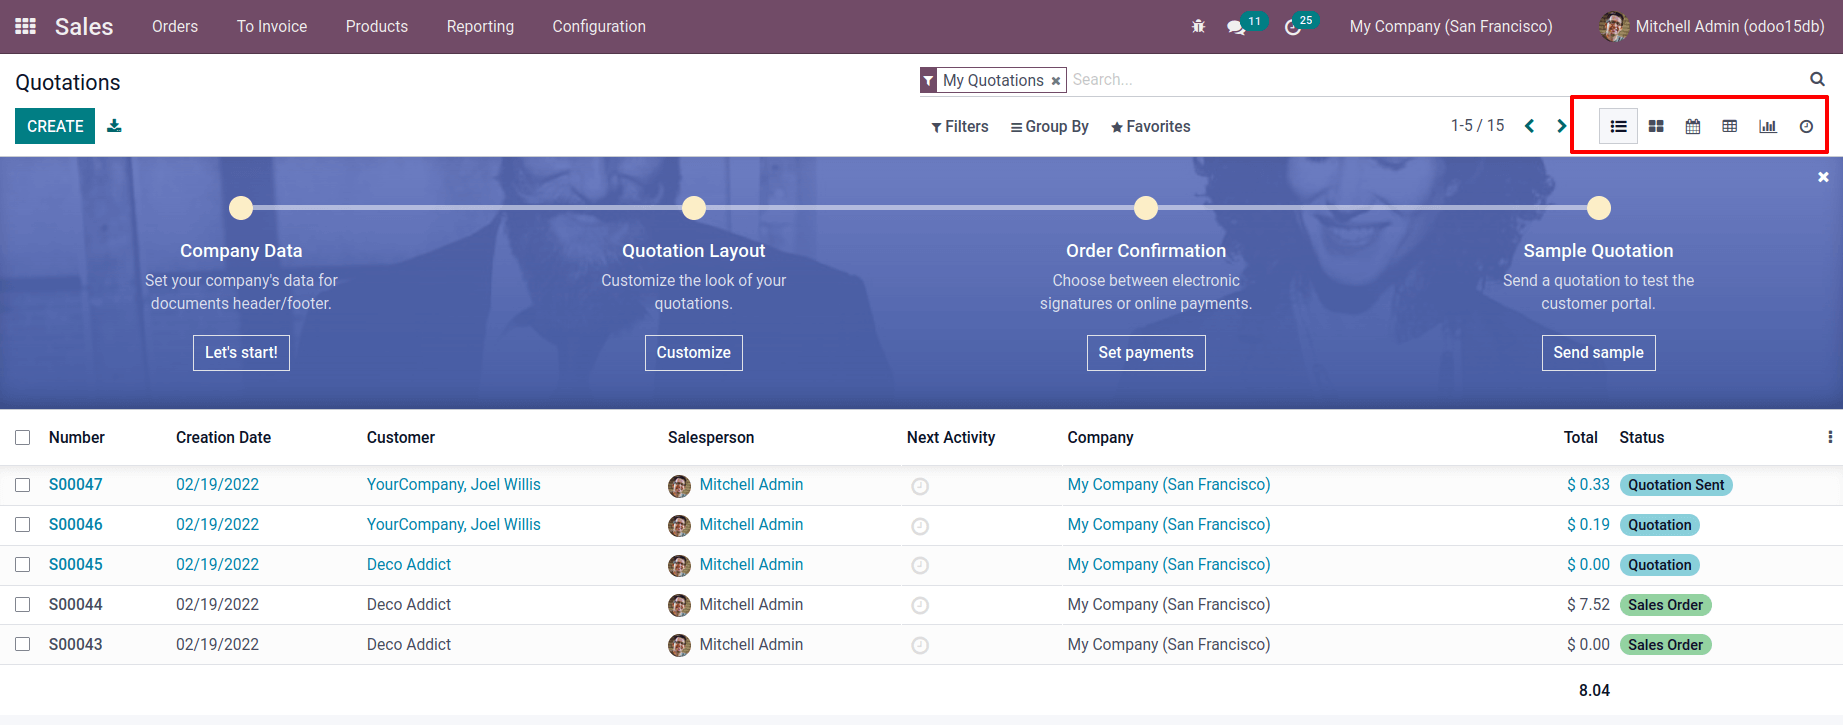
A Reporting tab is available. Open it and select the Sales Analysis report from the drop-down menu.
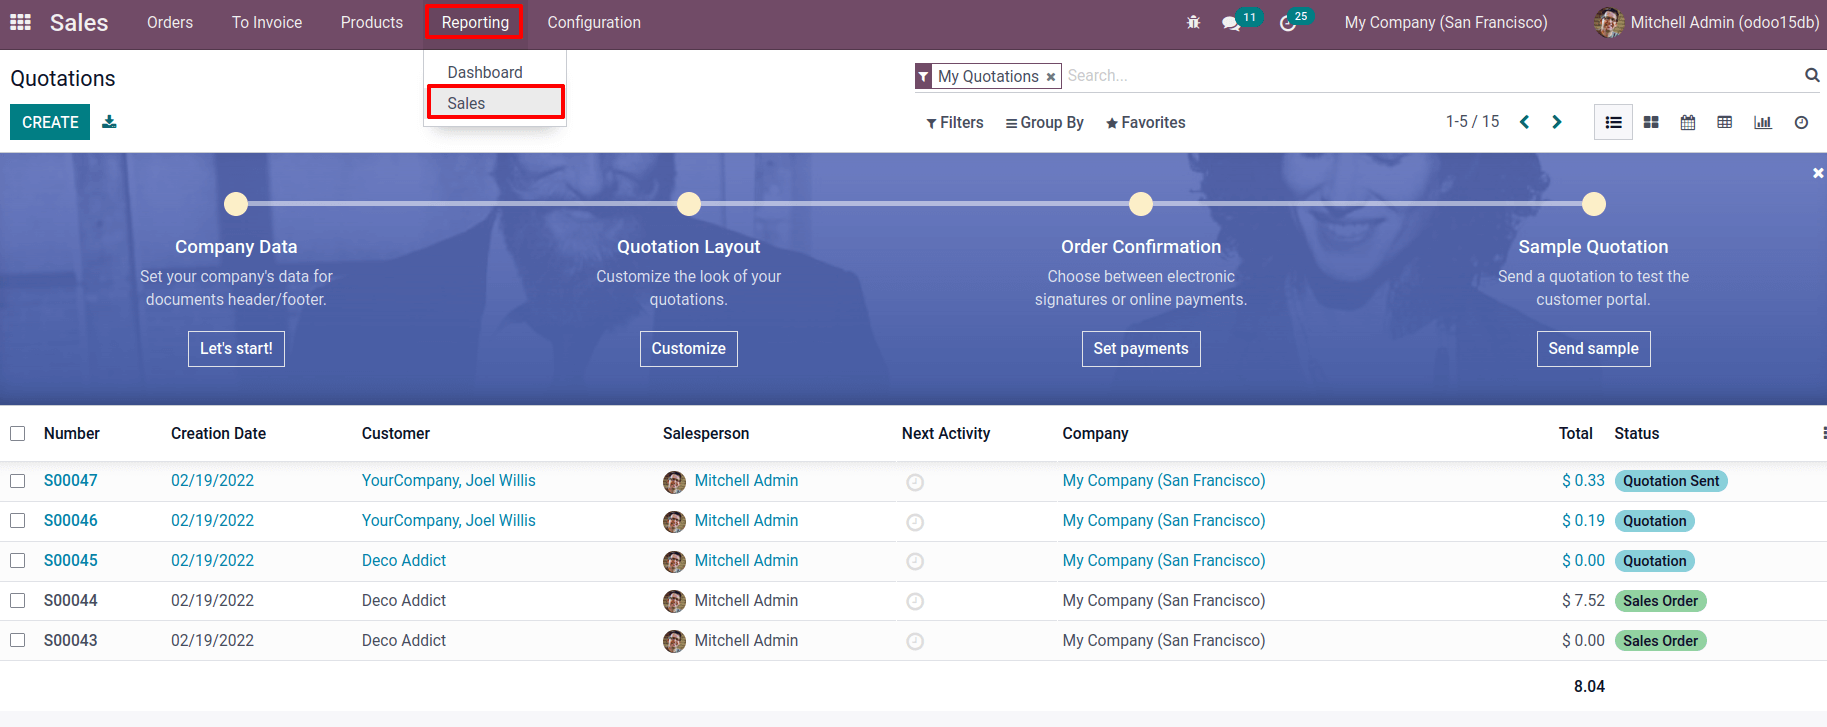
There are views for Graph View, Pivot Tables, and Dashboards.
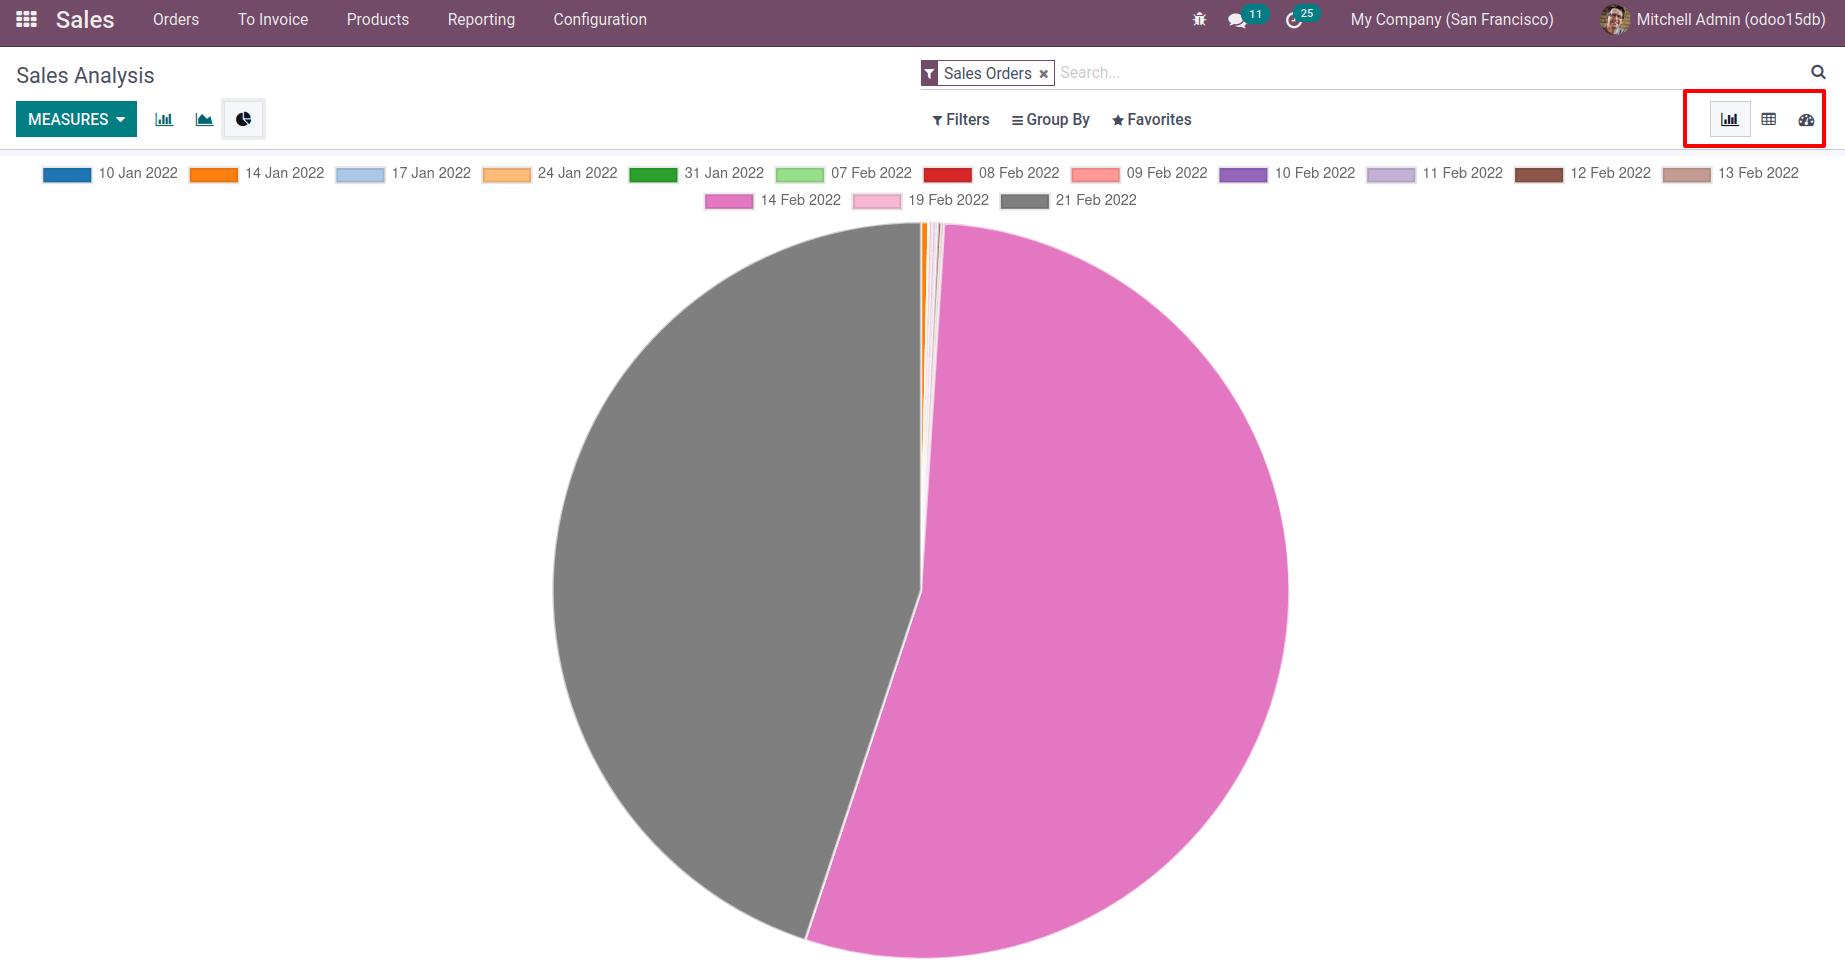
Let's choose the Pivot view. Each and every form of sales report can be obtained using the pivot table from the Sales module. The MEASURES button allows users to select the measures to display on the pivot table. Discount %, Discount on the amount, Margin, and more parameters are offered.
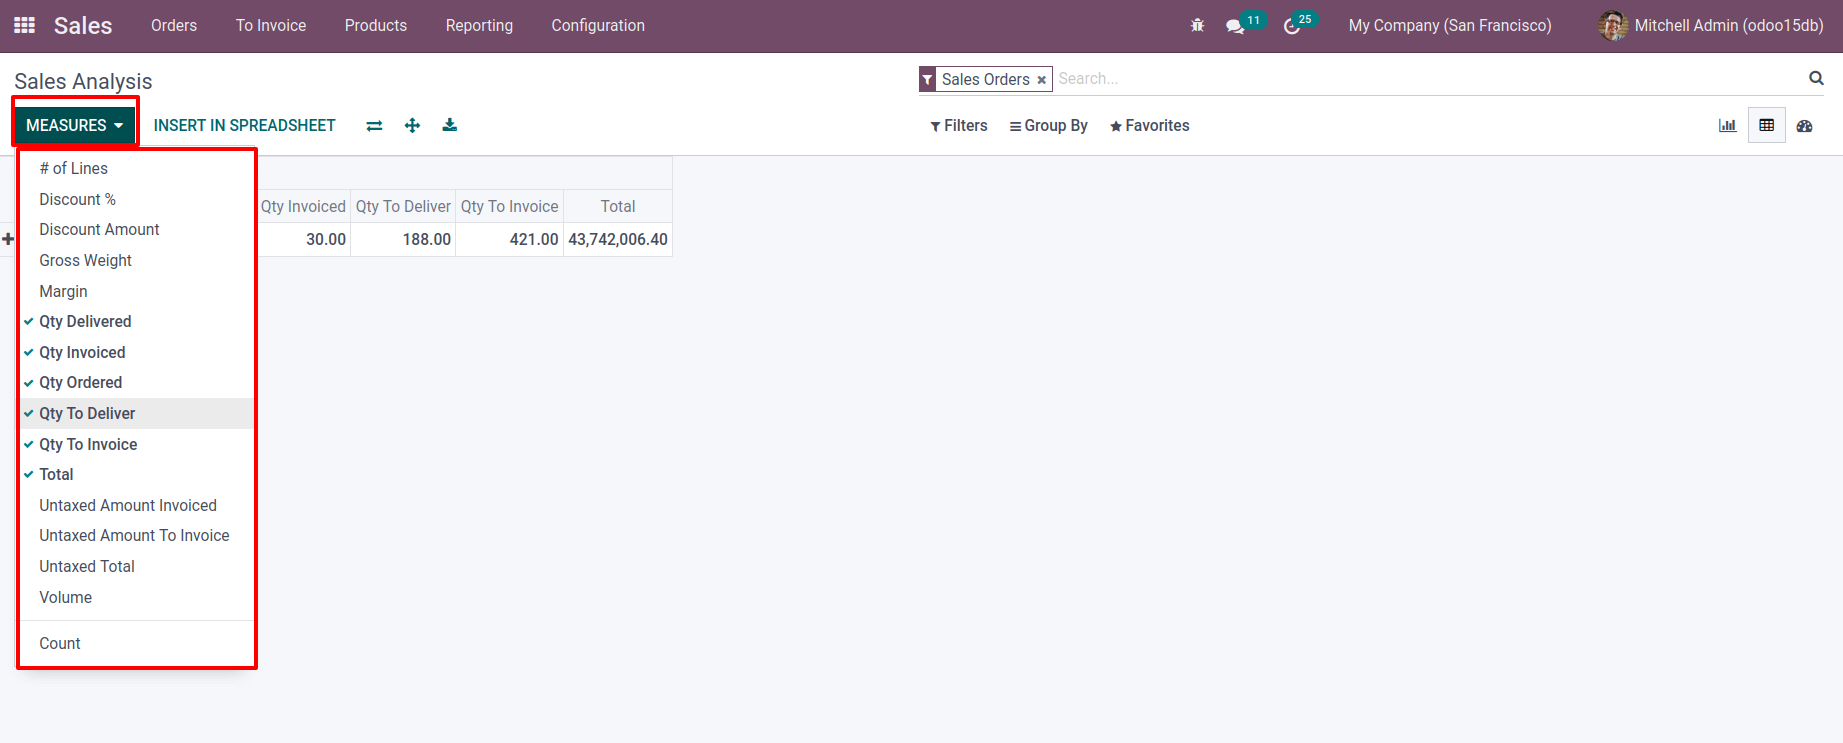
On the table, there is a + symbol. By clicking on the +sign, you can additionally select measures.
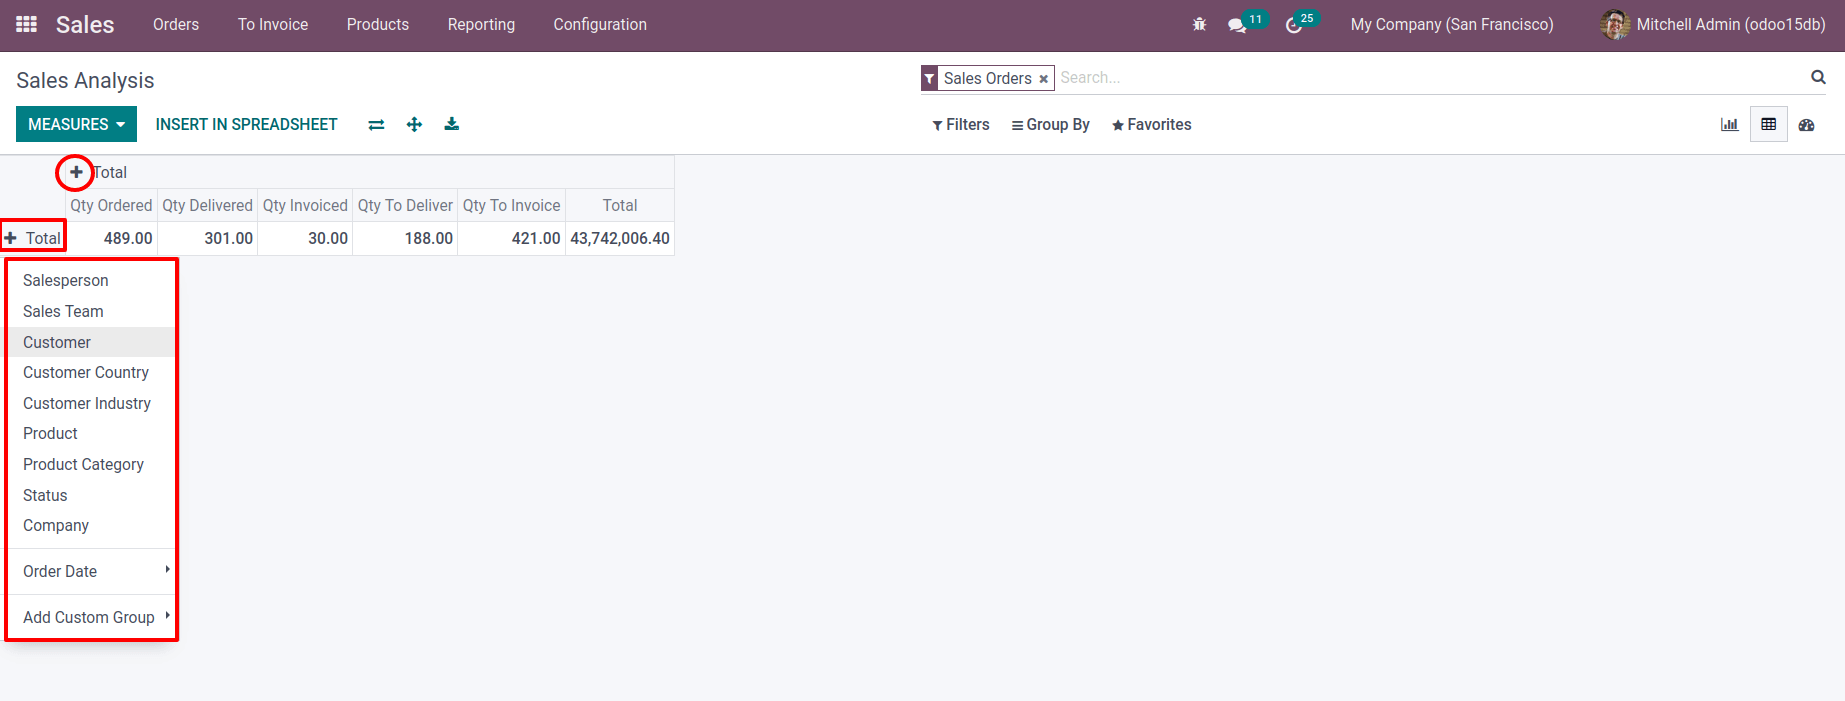
Taking a report with the sales team, salesperson on one axis and order details such as Quantity ordered, Quantity delivered, Quantity invoiced, and Total on the other. As previously stated, adding a parameter is as simple as clicking the + symbol. Then click the expand icon to expand the table. By clicking the Flip axis button, we can flip the axis. It's also possible to Download this page.

As a result, the prepared report can be inserted into an Excel sheet. Click the INSERT IN SPREADSHEET button to do so.
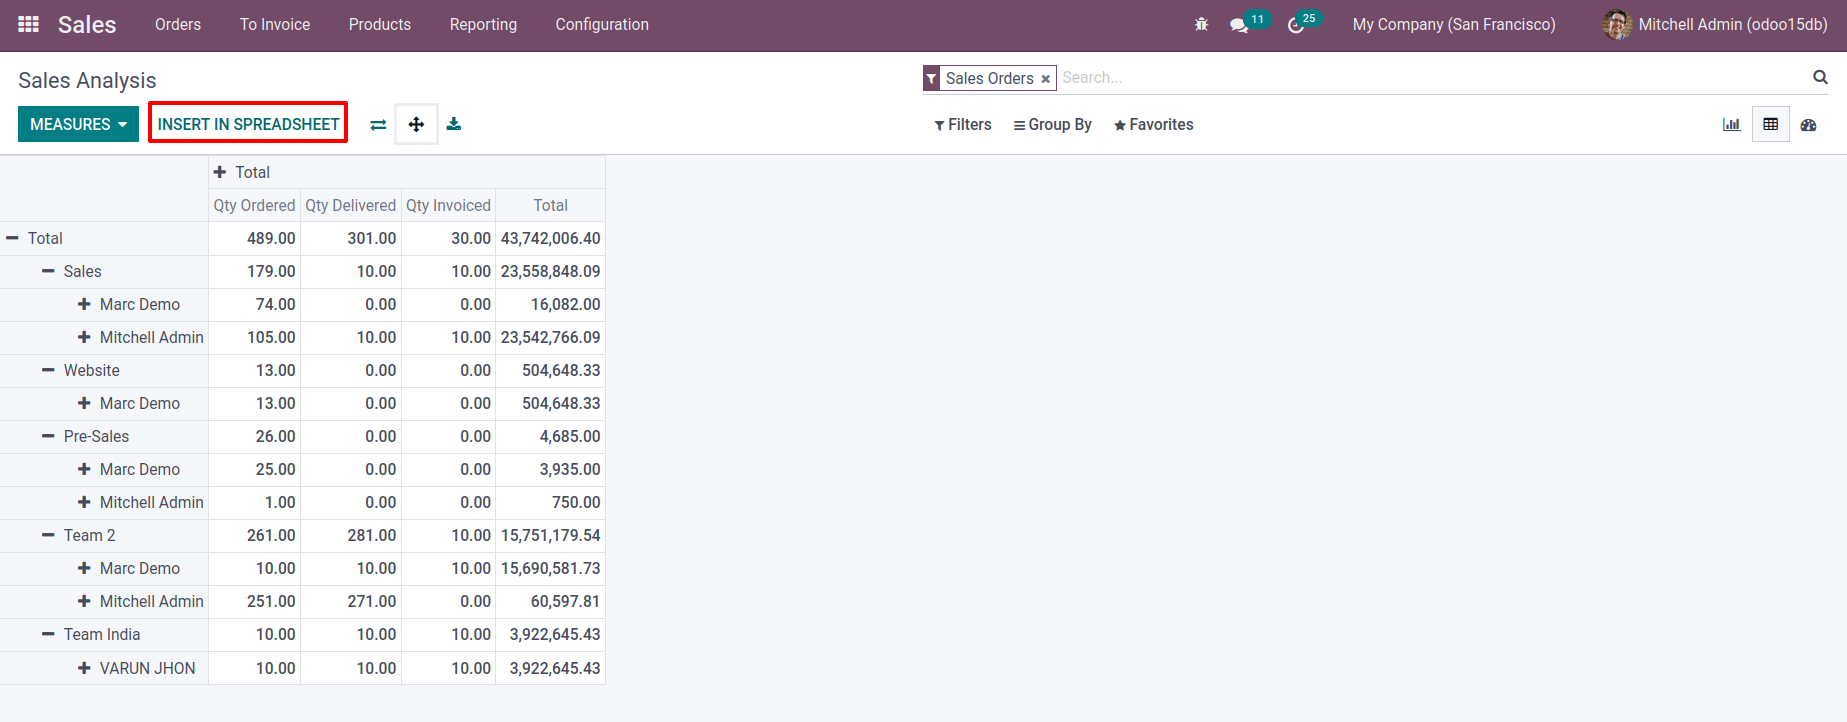
A confirmation popup displays and the pivot table is added to an excel sheet after you confirm it. It is possible to make all changes in it in a similar way to an excel sheet. There are also some other features available here. So let's talk about them separately.
Re-Insert Pivot
Re-insert pivot can be used to re-insert the same pivot table into the same spreadsheet. This option can be found under the Data button. Select the same cell from which we need to insert this again by clicking on it. Then go to Data, choose Re-insert pivot, and then select the sheet.
: Data < Re-insert pivot
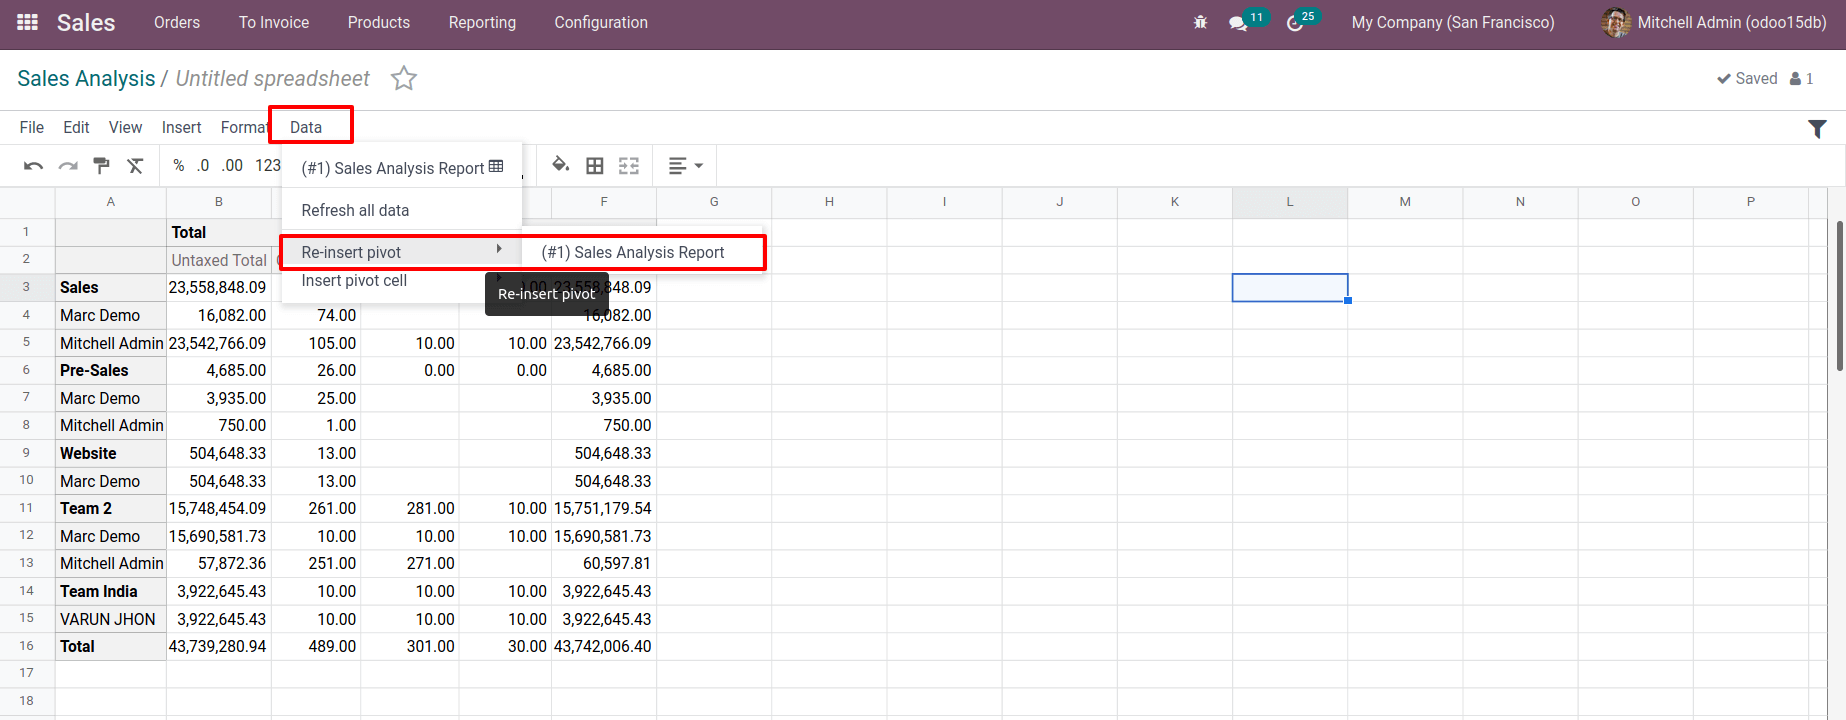
Then the identical information was inserted into the selected cell.
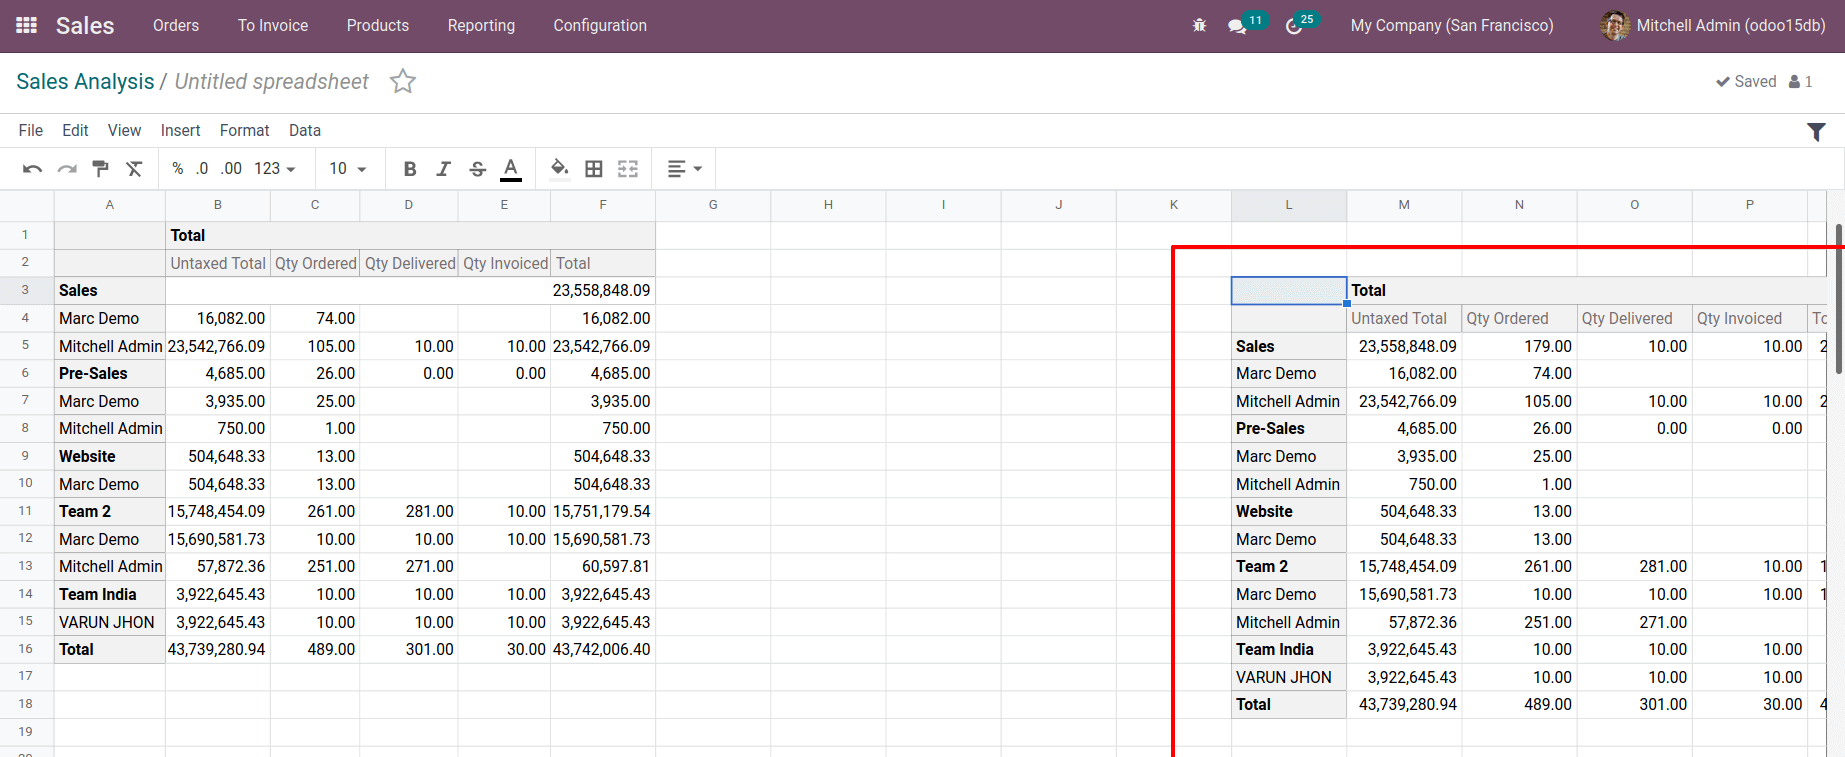
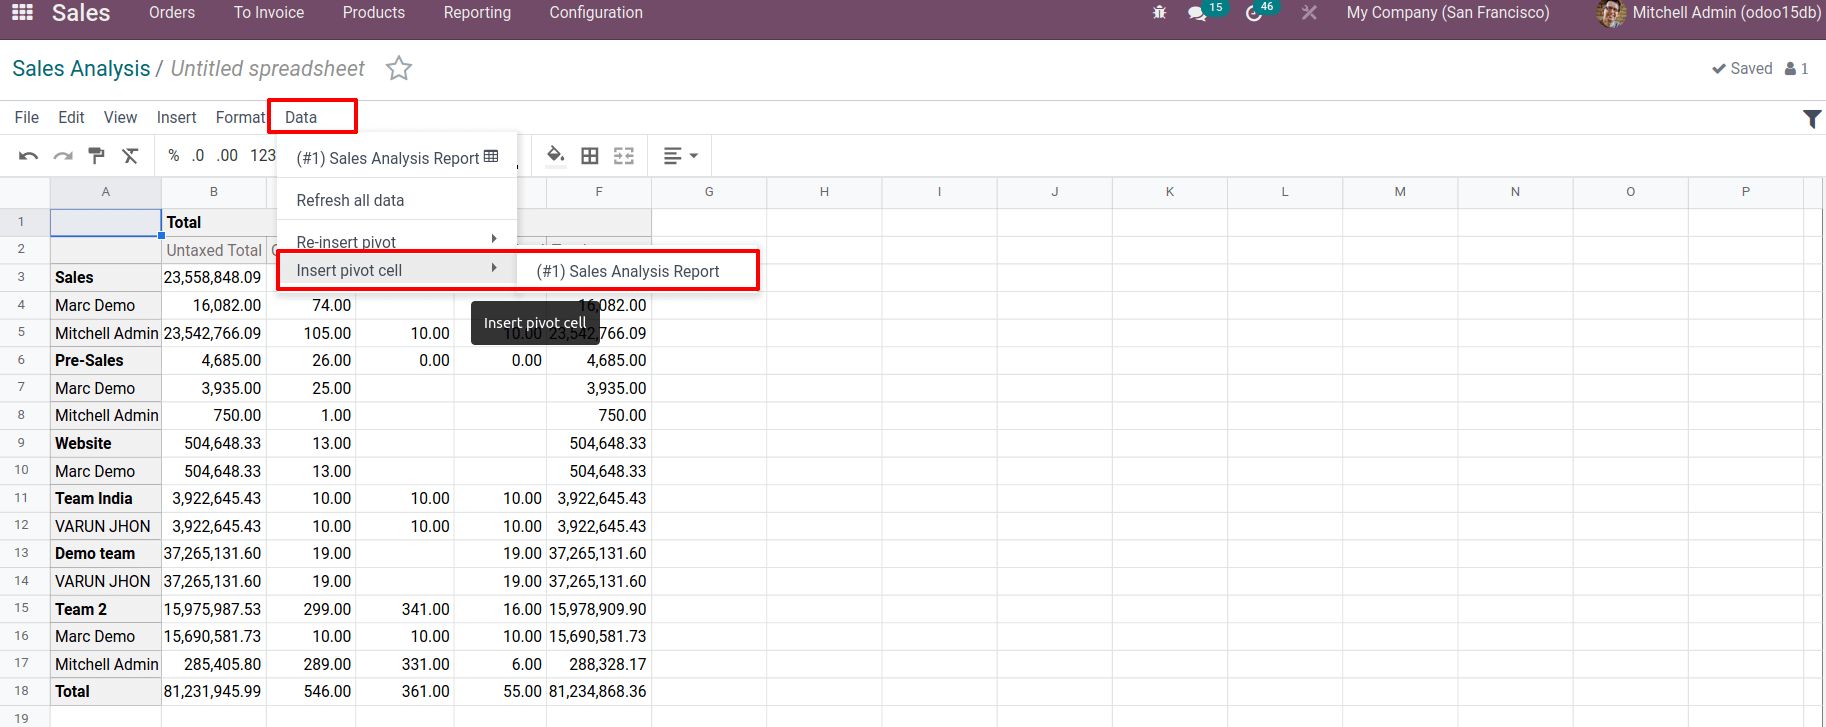
- Insert Pivot CellWhen some table details are lacking, the analytical process may be hampered.
As a result, some data may be missing from the sheet. In such instances, the Odoo 15 spreadsheet might assist us in recovering the lost data. The records for Quantity Delivered are missing here, therefore let's see how such information is retrieved. Select Data once more. Choose the third option, Insert pivot cell, and then, as previously said, pick the sheet.
: Data < Insert pivot cell
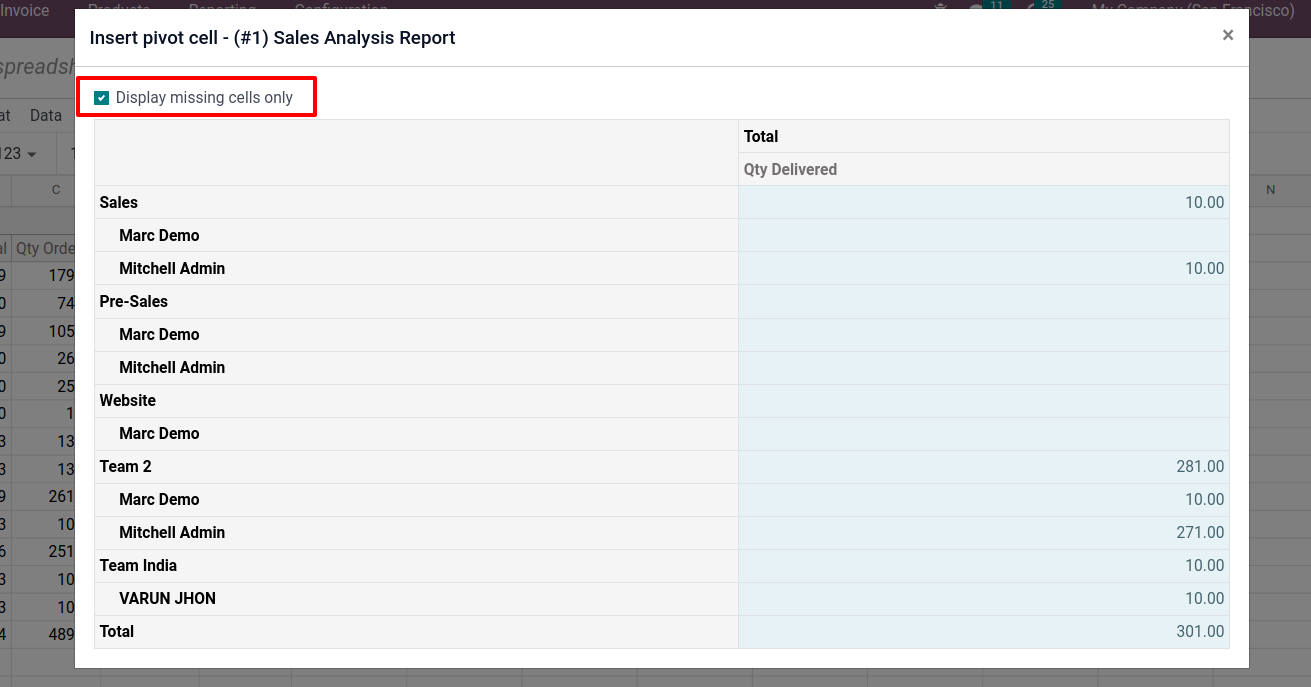
The table is then displayed on a new page. Then enable the checkbox, Display missing cells only, if we just require the missing cells. The missing cells were then displayed there.
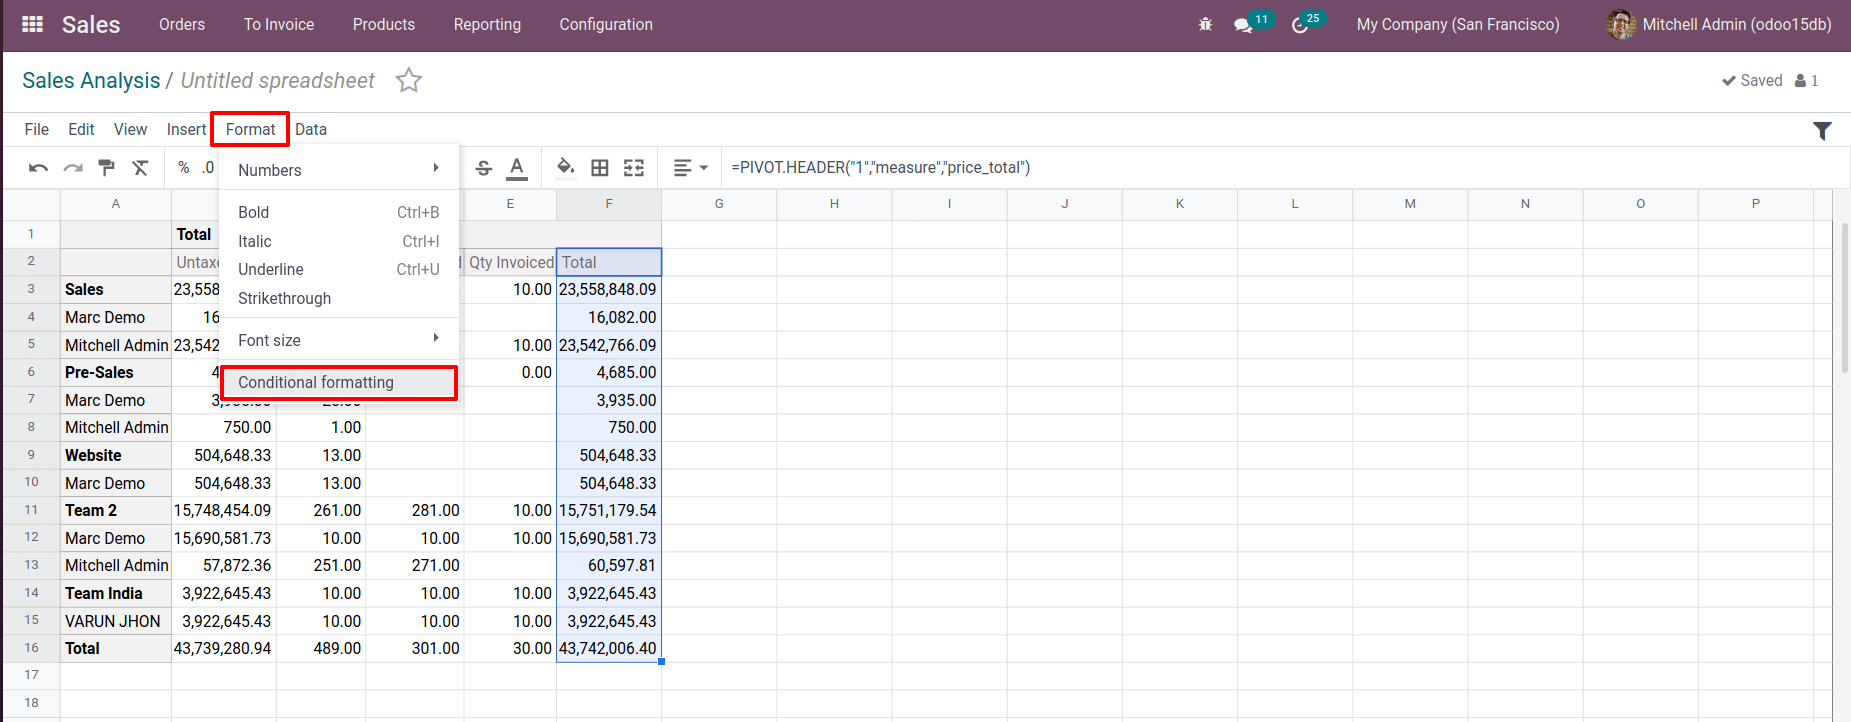
- Conditional Formatting
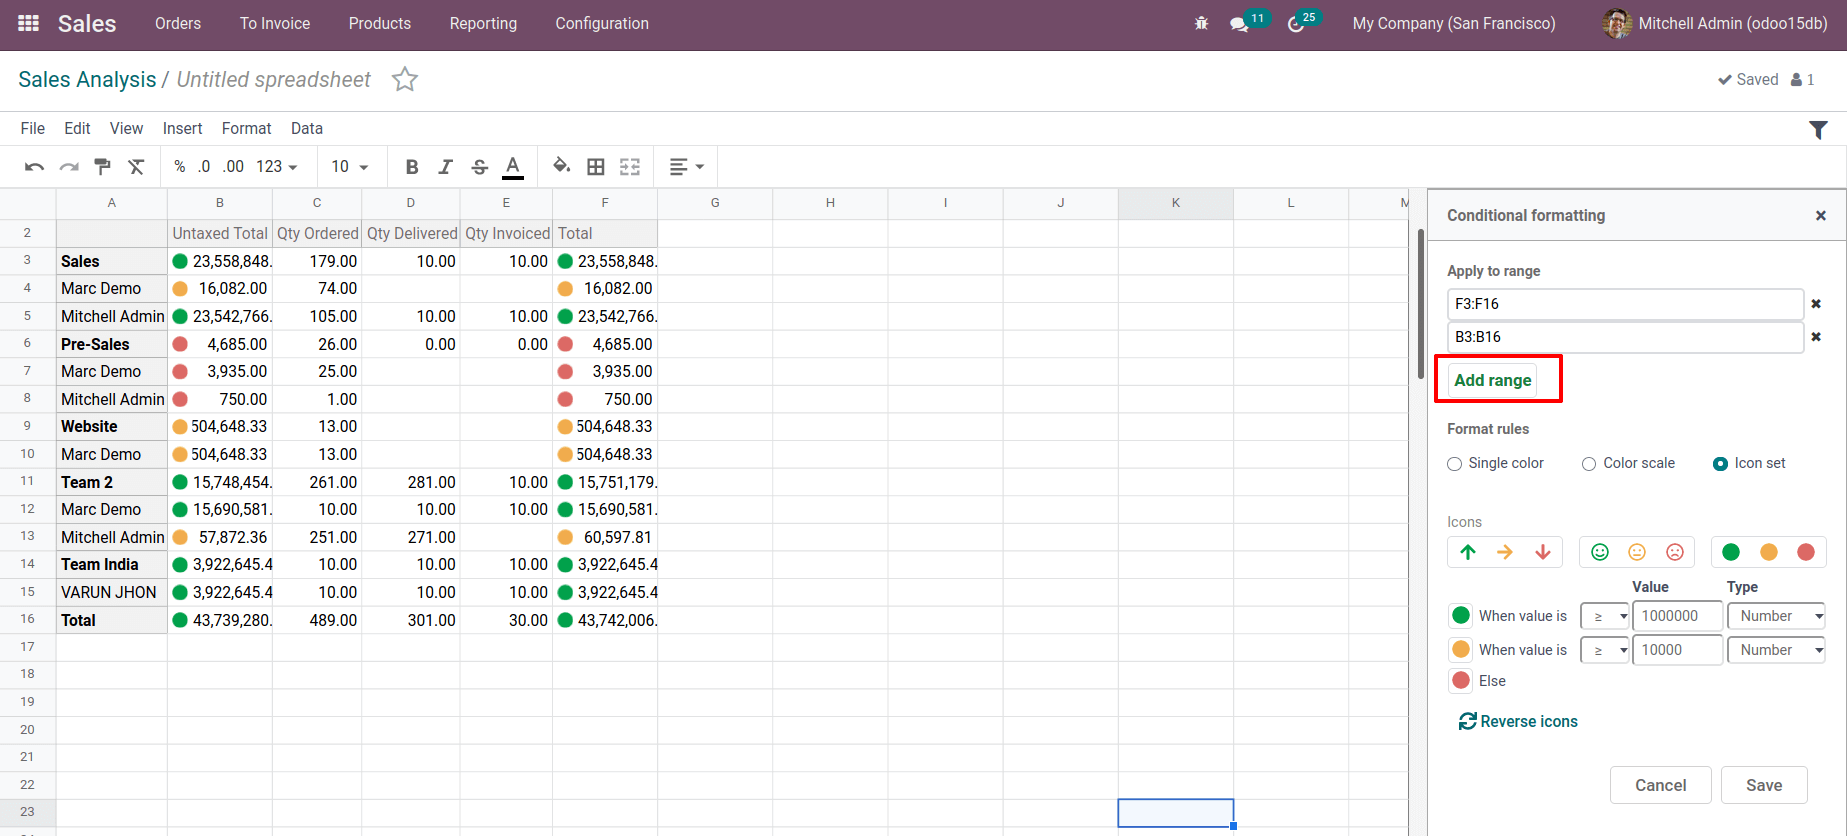
In some cases, data must be highlighted in reports. The user may occasionally highlight data based on its values. This type of conditional formatting can be used in an Odoo spreadsheet. Let's have a look at how it works. Choose Conditional Formatting from the Data menu to apply conditional formatting. After that, a new side window displays.
To apply the condition, first add the cell range.
It is possible to select the format rules. There are three ways to use such formatting. One method is to use a single color, while another is to use a color scale or an icon set. There are three different types of icon sets available this time. Select the most appropriate option. Then, in the fields provided, add the condition. Save it after that.
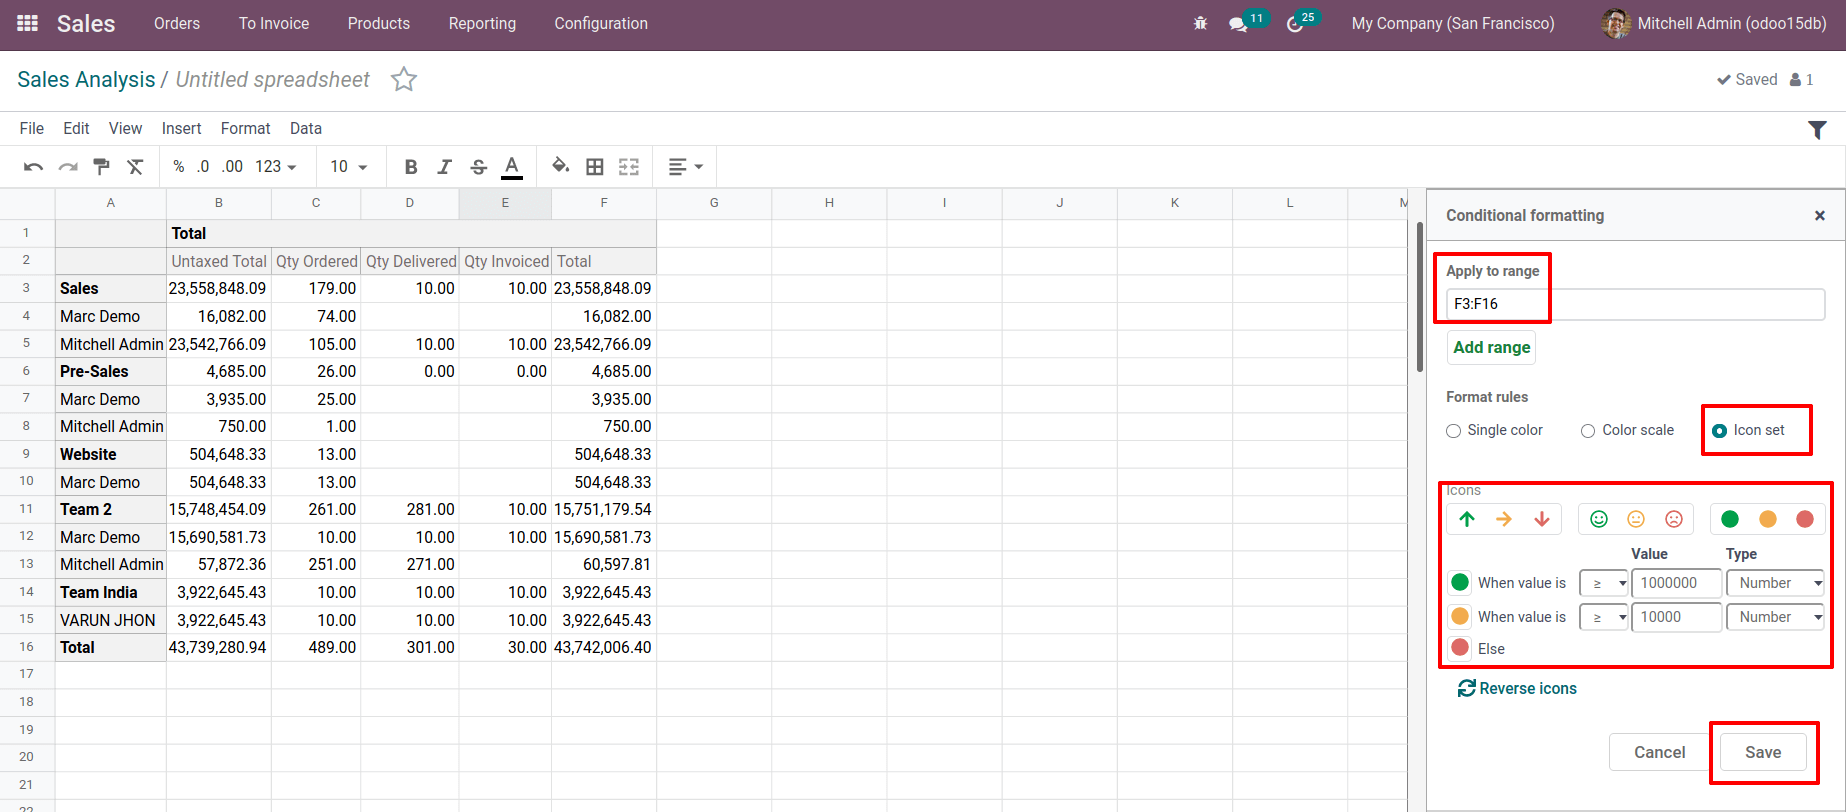
After saving, the formatting is performed based on the added condition. The same highlighting can be applied to any other field. While adding new ranges, conditional formatting is also performed.
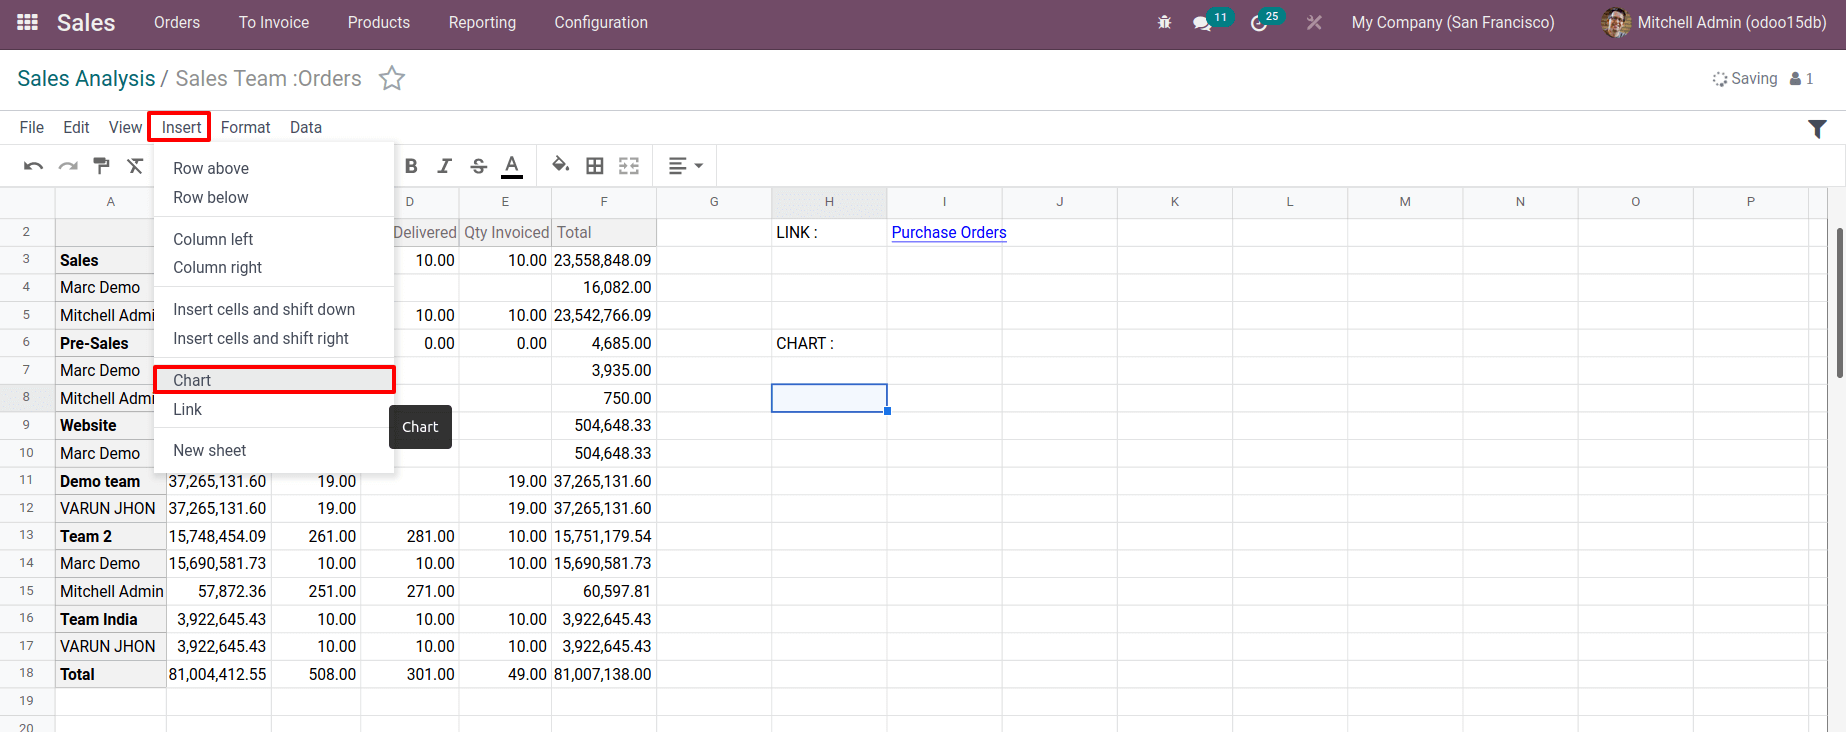
- Adding Chart
It is feasible to include a graph-based analysis in this section. On the basis of the specified parameters, charts can be added. Such graphs can sometimes be more understandable than a long list of numbers. To add charts, go to the Insert menu and select one from the list.
A page is open on the right side of the window. There are various graph types and parameters to pick from. There are sections for Configuration and Design. From there, one may select a chart type. There are three different sorts of charts: bar chart, pie chart, and line chart. Then mention the range of data series. When the Data series contains titles checkbox is selected, the selected information's title will be appended.
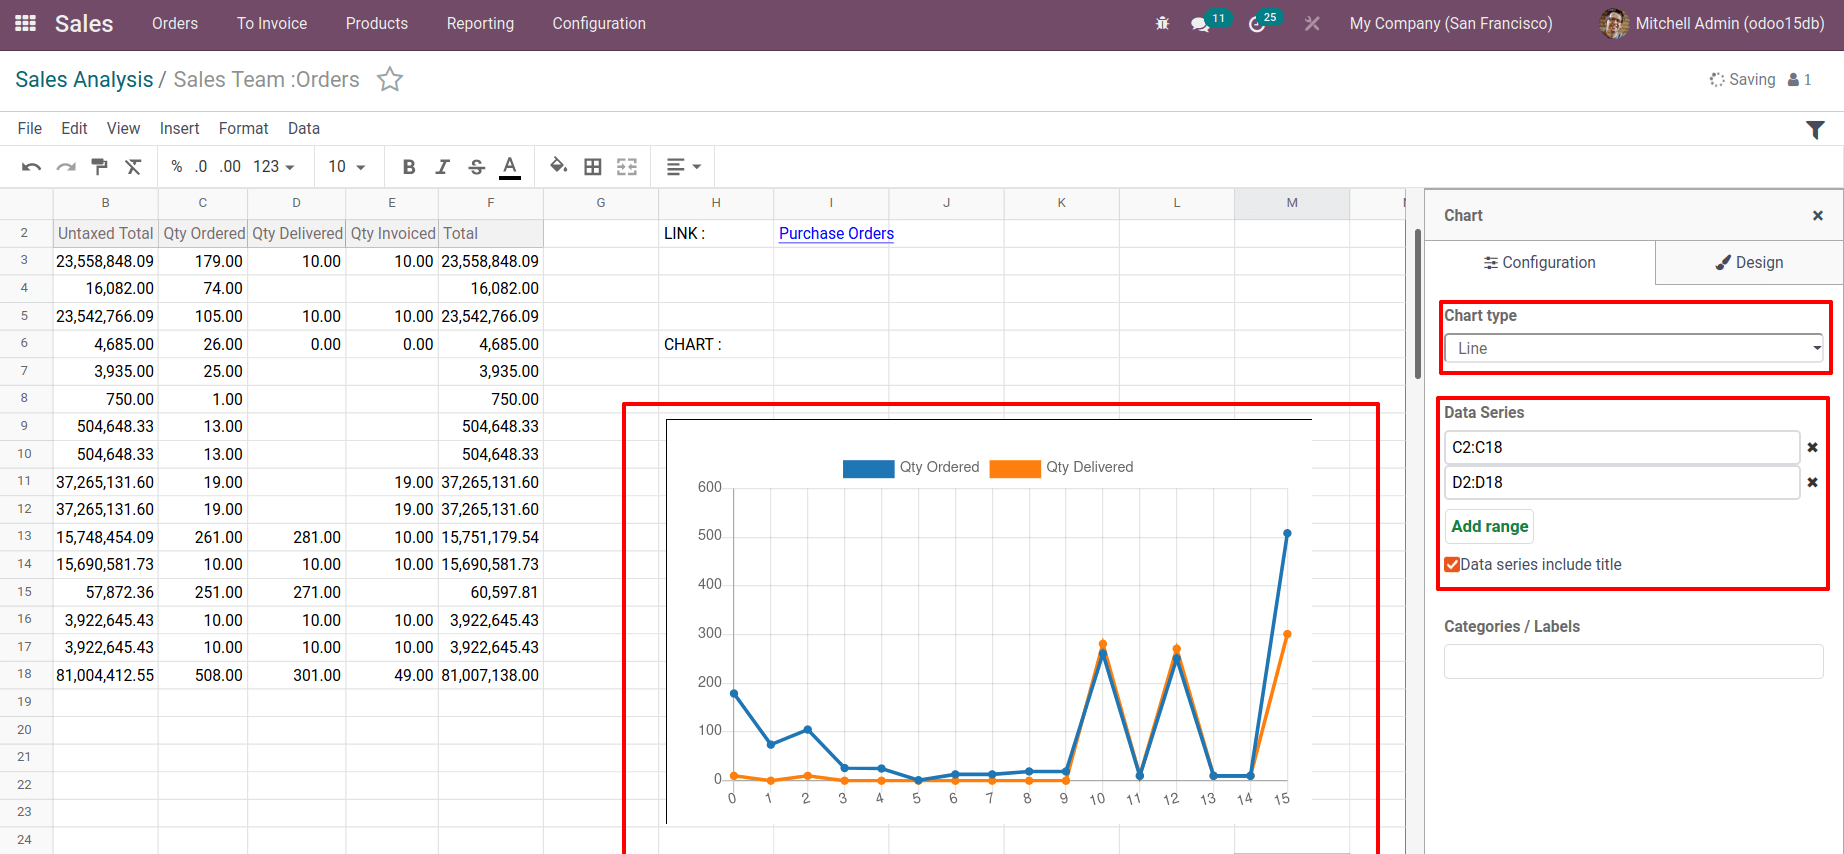
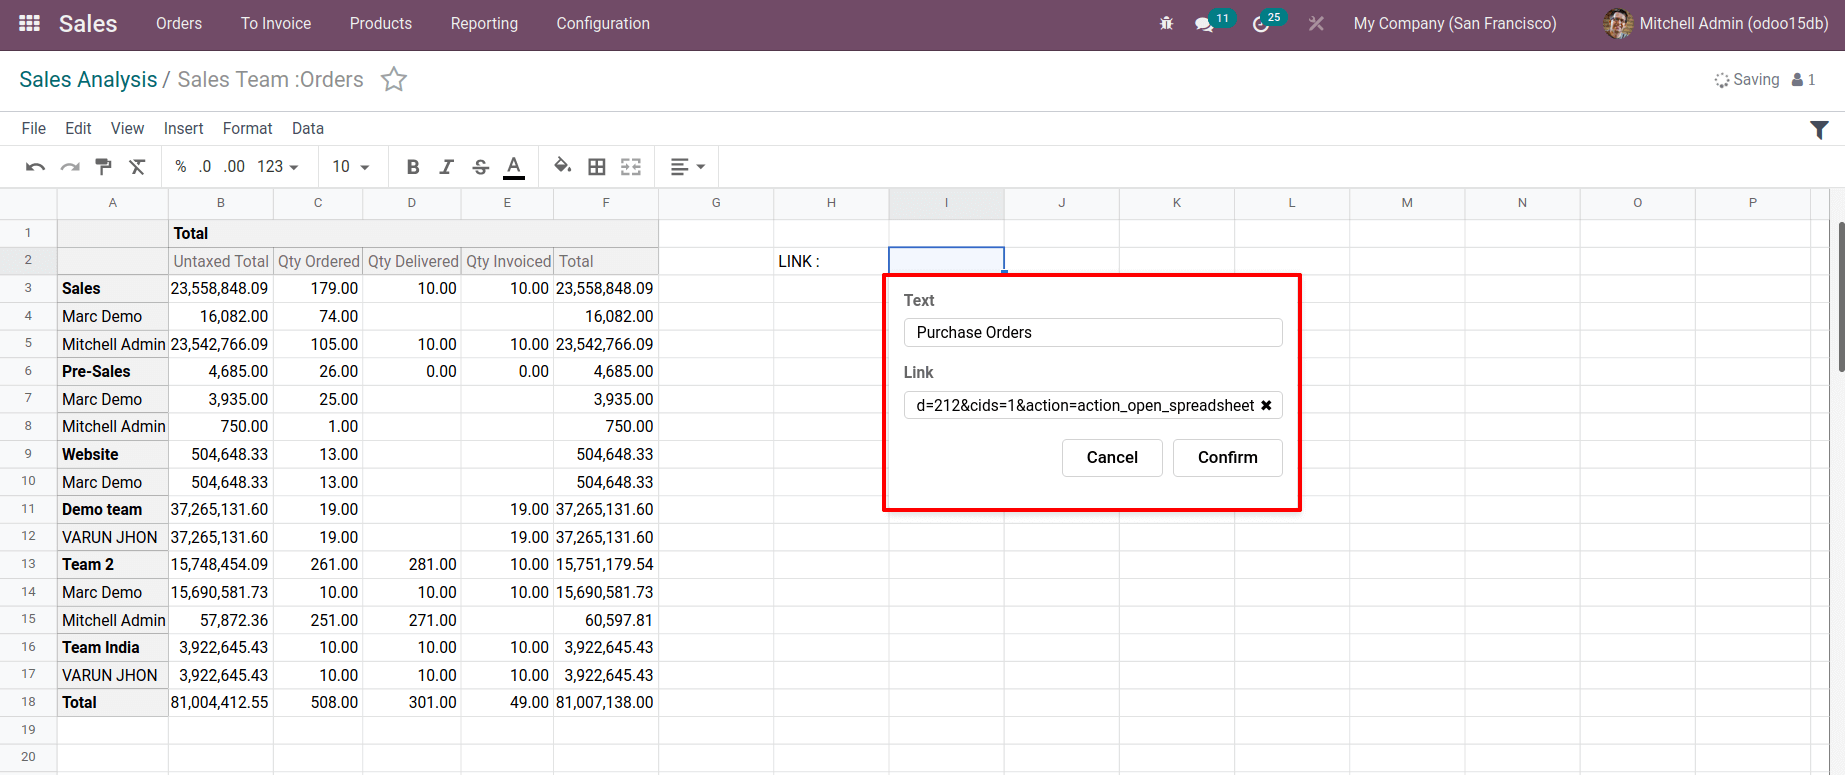
The quantity ordered and the quantity delivered are selected here. As a result, the values are displayed in the Line chart. So a relevant graph has been added to the spreadsheet.- Adding LinkIt may be necessary to check another document or video in conjunction with this report on occasion. In an Odoo spreadsheet, you can provide a link to another page in the current report. To do so, go to the Insert menu and select the Link option.
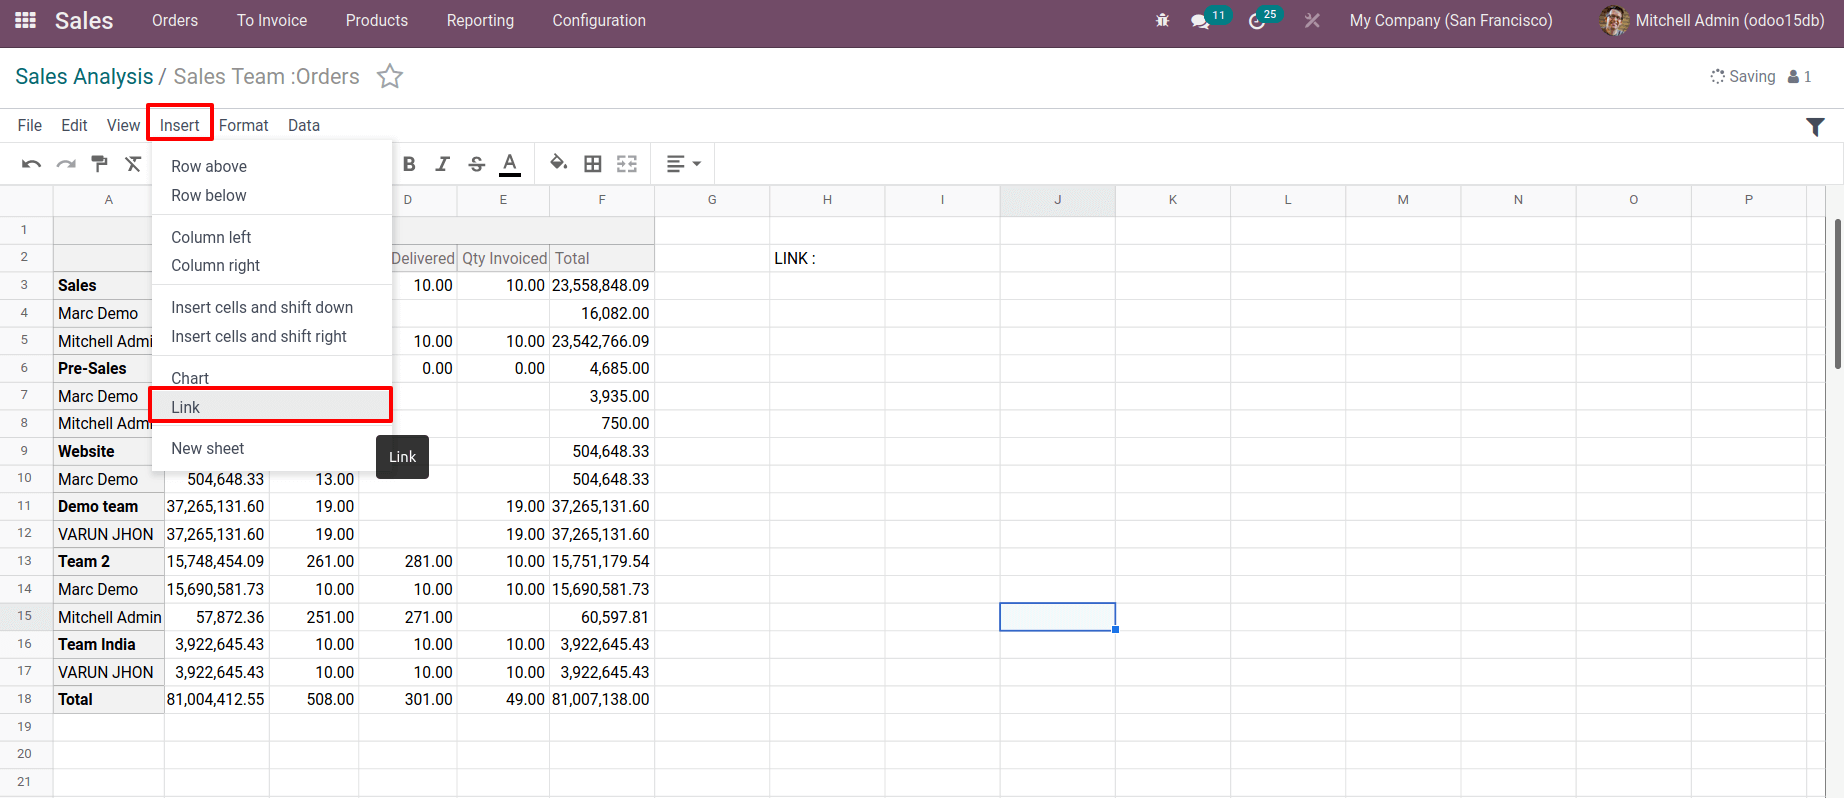
Then a new wizard appears, where you may add a Label and a Link, and then approve it.
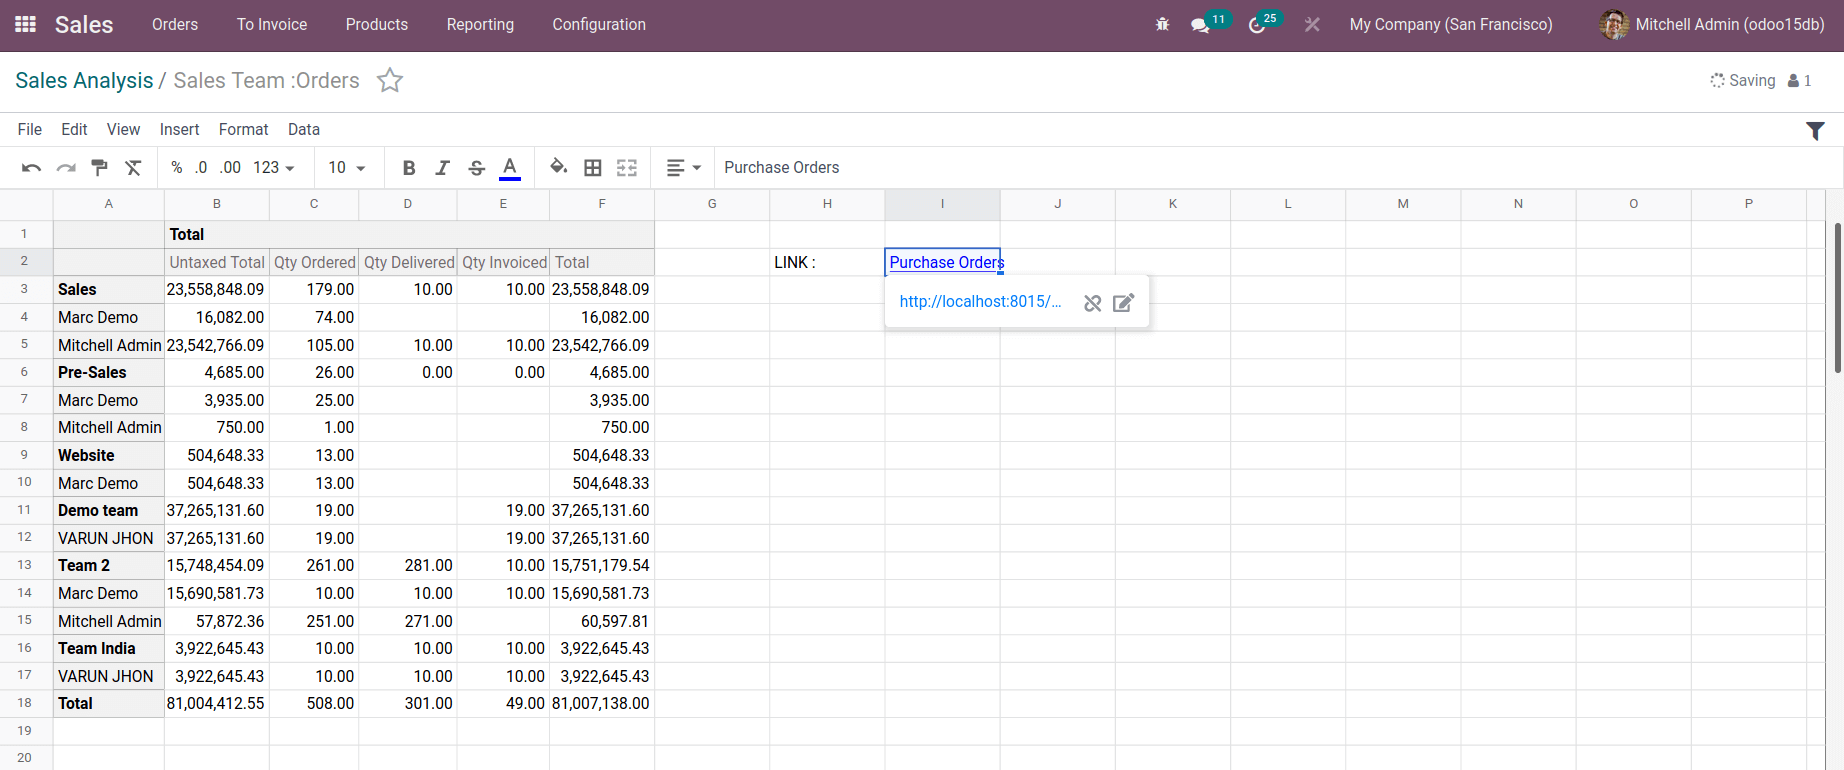
The URL was then added to the spreadsheet.
- Filter Option
Perhaps the majority of the reports are excessively long. If someone needs to see a certain piece of data from the report, looking for it is too tough. In such circumstances, a filter option is required, and Odoo15 includes a filter option for data in spreadsheets. So, let's take a look at what happened.
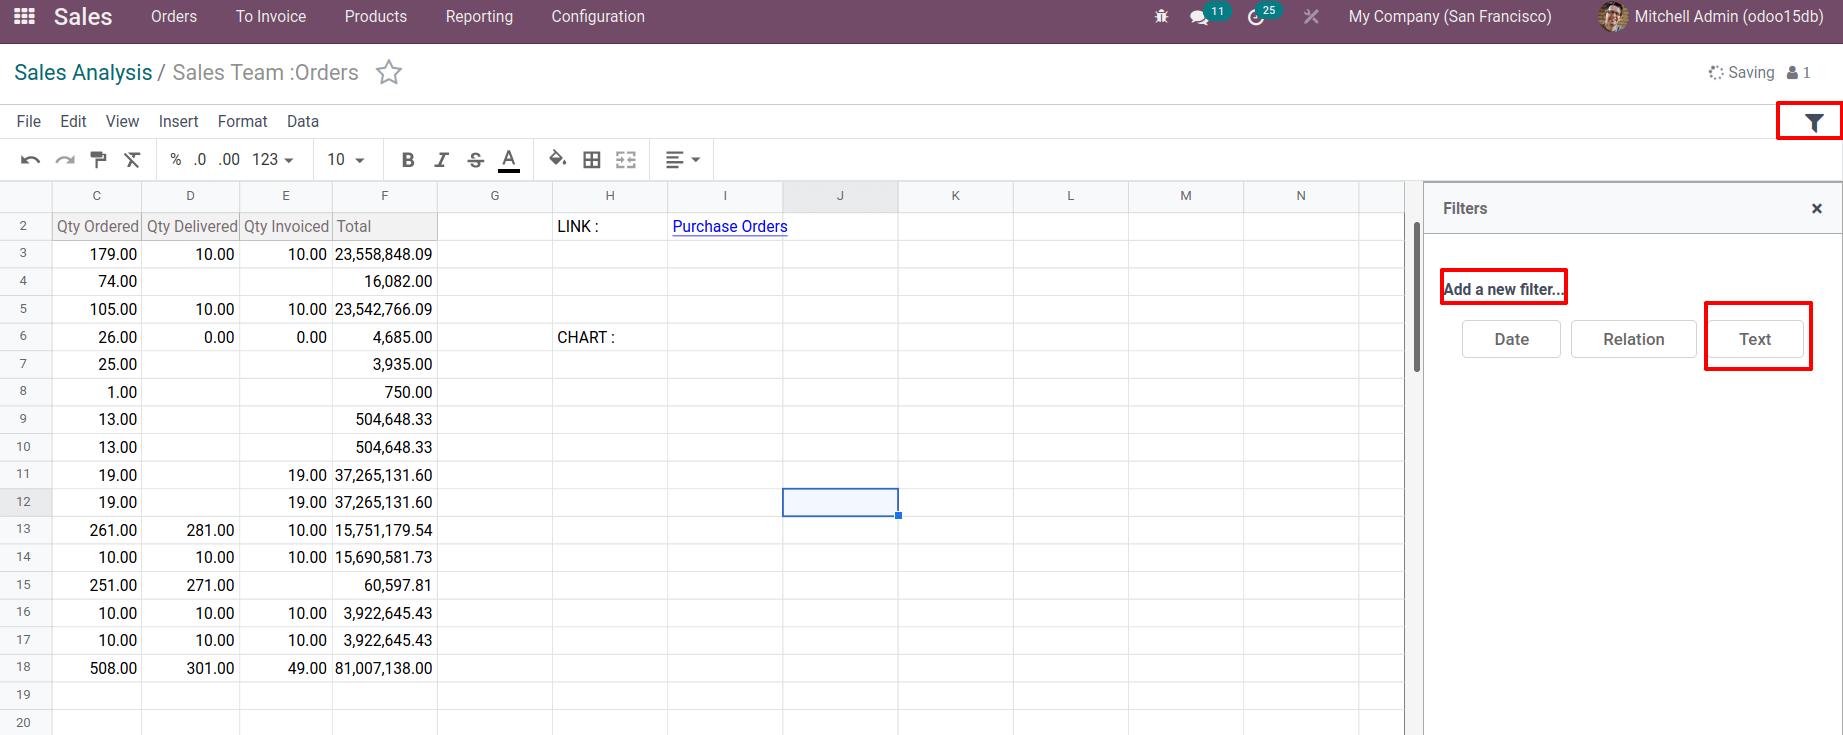
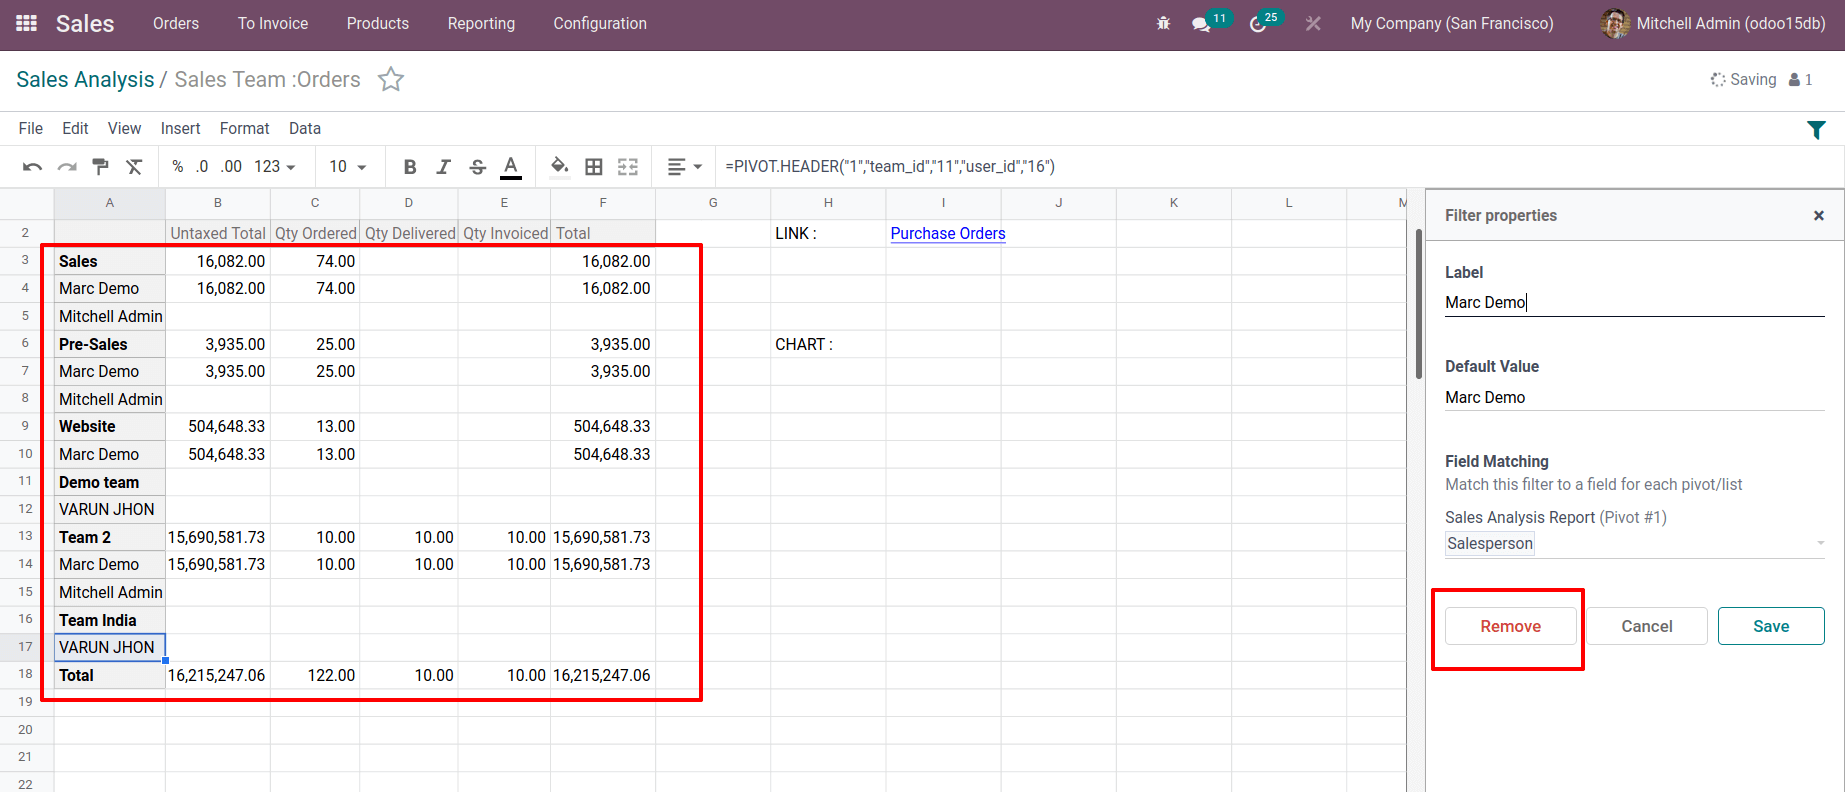
In the right corner of the screen, there is a Filter sign. So go ahead and click on it. Then, if desired, a filter can be applied. It is possible to create filters based on Date, Relationship, and Text. After selecting a segment and entering appropriate data, the filter is complete and ready to be applied to the sheet. Just Save the filter.
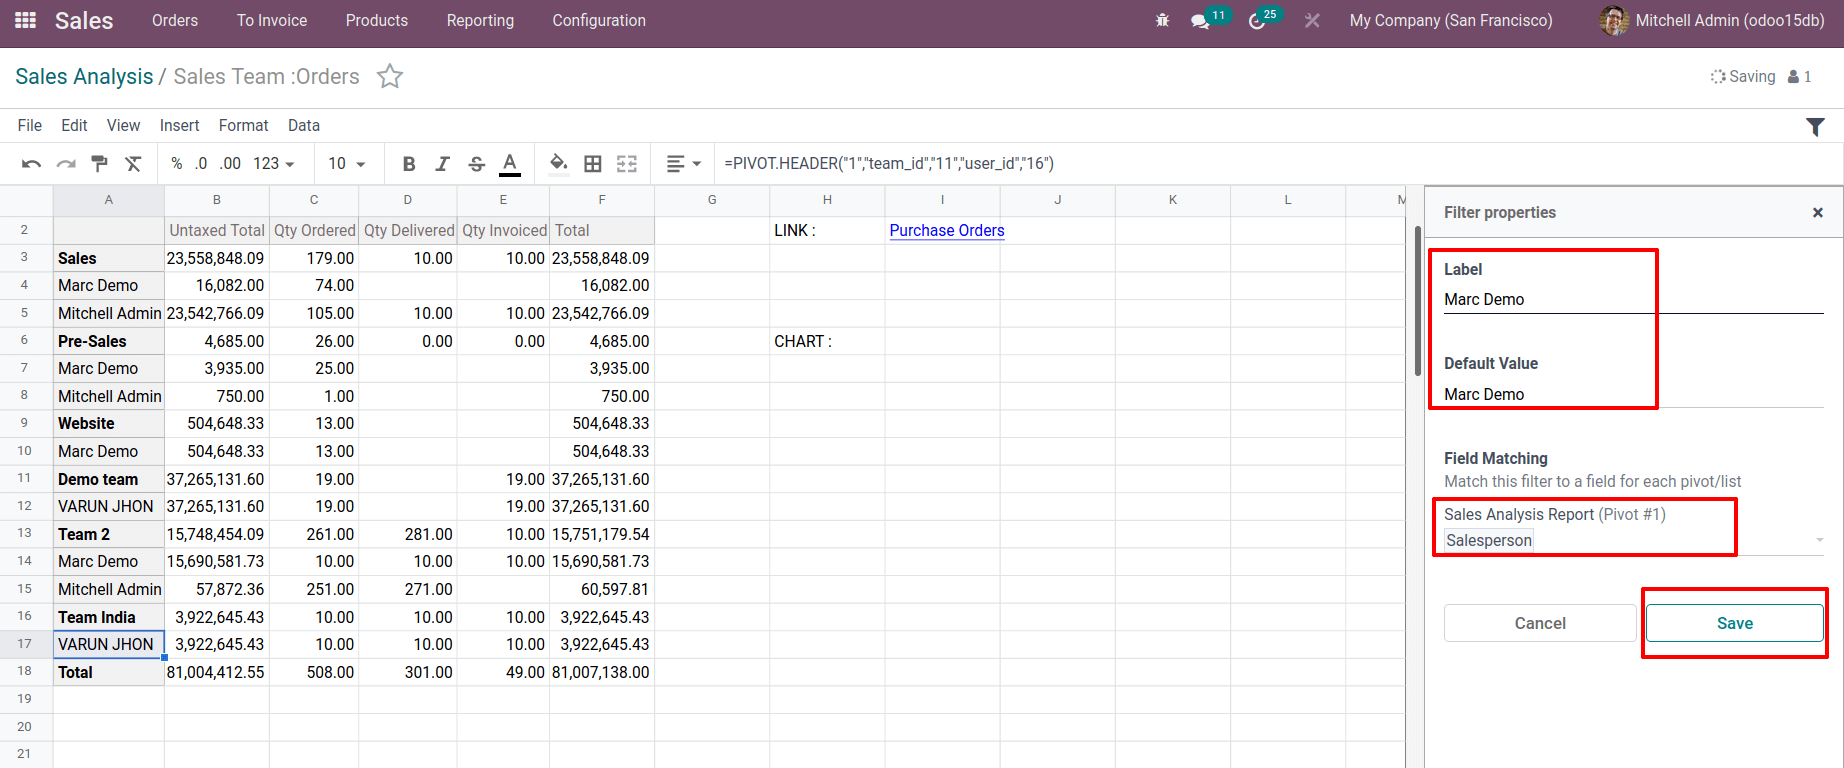
Here, created a label called Marc Demo, as well as a filter to show Marc Demo's sales information. It is possible to Remove the filter that has been applied after saving it.
These are features that are included in the Odoo spreadsheet. As we all know, there are some spreadsheet features that already exist. All of these features can also be found in an Odoo spreadsheet. Odoo spreadsheet also has tools such as New, Show Formula, Add Column and Rows, Font sizing and styling, and Strikethrough.
This blog covered all of the Odoo 15 spreadsheet's extra features. The implementation of such options is also described here.