Managing a postgres database involves much more than simply running SQL queries. Administrators must continuously monitor database activity, identify performance bottlenecks, analyze query execution, maintain healthy tables and indexes, tune configuration parameters, and ensure that the overall database remains efficient as workloads grow.
Performing all of these tasks manually can be time-consuming and often requires switching between multiple system catalogs, extensions, and monitoring views.
pgAssistant brings these capabilities together in a single interface, making it easier to inspect database health, monitor workloads, review performance statistics, explore database objects, and receive practical optimization recommendations.
Now, let’s connect the pgassistant tool with postgres by following the below steps.
Clone the repository.
git clone https://github.com/beh74/pgassistantcommunity.git
Now, go to this folder.
cd pgassistantcommunity/
Check the contents inside this folder like this.
cybrosys@cybrosys:~/pgassistantcommunity$ ls
Result:
advisor_enriched.yml  apps          config.json      Dockerfile  executive_plan_rules.yml  media                 pgtune.sh       README.md      report.sql        SECURITY.md
advisors.md           build.sh      CONTRIBUTING.md  docs        gunicorncfg.py           myqueries.json        pyproject.toml  render.yaml    requirements.txt  tests
advisor.yml           CHANGELOG.md  dockercompose   env.sample  LICENSE                   parameter_advisor.md  queries.json    reporting.yml  run.py
Create a virtual environment.
cybrosys@cybrosys:~/pgassistantcommunity$ python3 m venv .venv
Activate the virtual environment.
cybrosys@cybrosys:~/pgassistantcommunity$ source .venv/bin/activate
Install the packages in the requirements.txt file.
(.venv) cybrosys@cybrosys:~/pgassistantcommunity$ pip install r requirements.txt
Now, run pgassistant like this.
python3 run.py
Result :
 * Env var SECRET_KEY is not set. Using a random key
 * Serving Flask app 'apps'
 * Debug mode: off
WARNING: This is a development server. Do not use it in a production deployment. Use a production WSGI server instead.
 * Running on http://127.0.0.1:5000
Now, open this url in a browser.
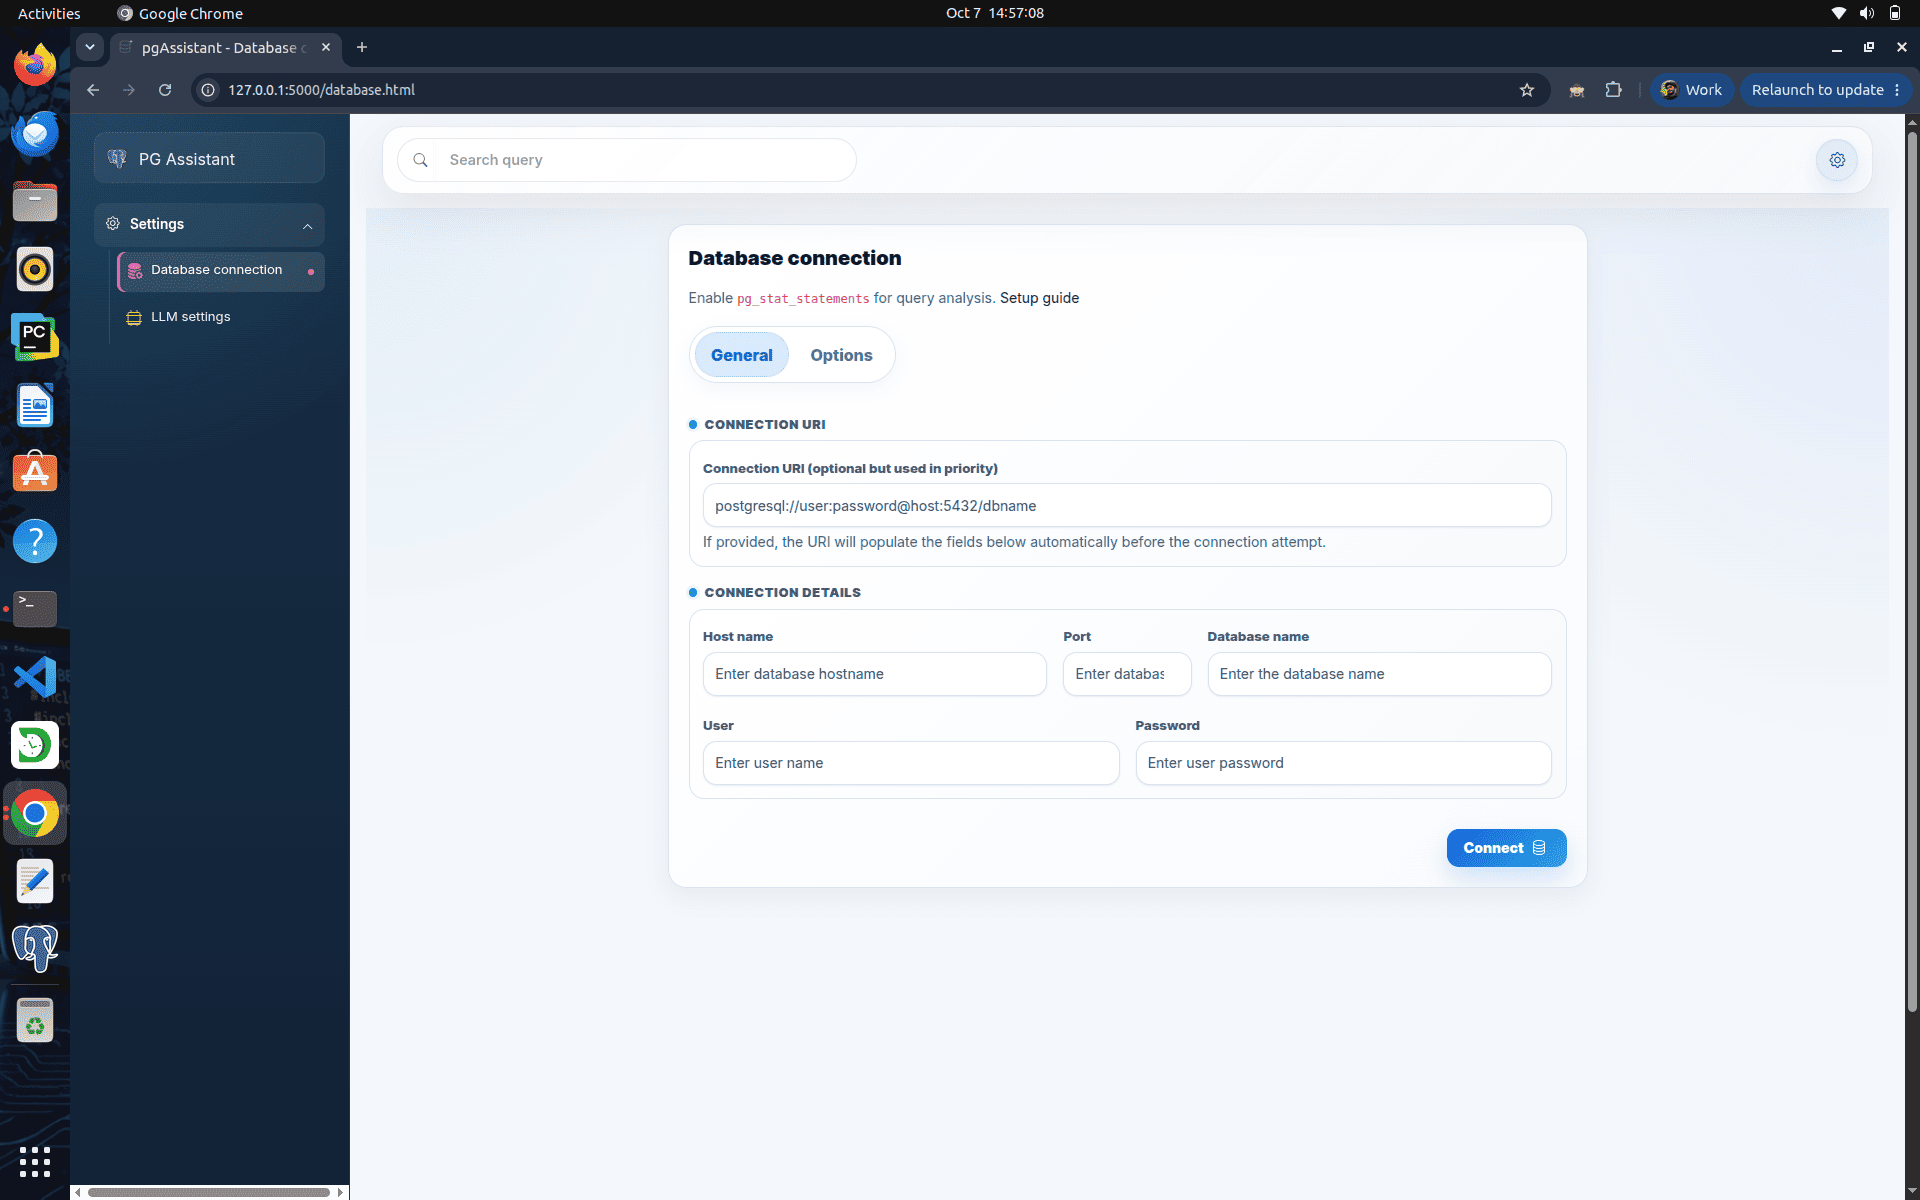
This is the first page loads in the browser, and this page is mainly used to enter the postgres credentials to connect the postgres database.
Check your current postgres clusters like this.
cybrosys@cybrosys:~$ pg_lsclusters
Result:
Ver Cluster Port Status Owner    Data directory               Log file
14  main    5435 online postgres /var/lib/postgresql/14/main  /var/log/postgresql/postgresql14main.log
17  main    5434 online postgres /var/lib/postgresql/17/main  /var/log/postgresql/postgresql17main.log
18  main    5432 online postgres /var/lib/postgresql/18/main  /var/log/postgresql/postgresql18main.log
18  main2   5433 online poperformance tuningstgres /var/lib/postgresql/18/main2 /var/log/postgresql/postgresql18main2.log
19  main    5436 online postgres /var/lib/postgresql/19/main  /var/log/postgresql/postgresql19main.log
Now, create a separate user and password for using pgassistant with postgres like this.
Inside psql terminal, enter the following.
I already have a database named odoo_17_1, and the owner of that database is cybrosys.
create user cybrosys with superuser;
alter user cybrosys with password 'cool';
We need to create the extension named pg_stat_statements for fetching the query execution-related details for the pgassistant tool.
create extension pg_stat_statements ;
Now, we need to set the value for the shared_preload_libraries parameter in postgresql.
Before that, check the current value of this parameter.
show shared_preload_libraries ;
Result:
 shared_preload_libraries

(1 row)
We need to set a value for this parameter in the postgres conf file.
So check the location of the postgres configuration file like this.
show config_file ;
Result:
               config_file
 /etc/postgresql/18/main/postgresql.conf
(1 row)
Now, open this file
sudo nano /etc/postgresql/18/main/postgresql.conf
Set the value like this.
shared_preload_libraries = 'pg_stat_statements'
Now, restart the postgresql.
sudo systemctl restart postgresql
We need to restart after setting the value for this parameter because the context of this parameter is postmaster.
Check this parameter’s metadata from pg_settings like this.
select * from pg_settings where name = 'shared_preload_libraries';
Result:
[ RECORD 1 ]+
name            | shared_preload_libraries
setting         | pg_stat_statements
unit            |
category        | Client Connection Defaults / Shared Library Preloading
short_desc      | Lists shared libraries to preload into server.
extra_desc      |
context         | postmaster
vartype         | string
source          | configuration file
min_val         |
max_val         |
enumvals        |
boot_val        |
reset_val       | pg_stat_statements
sourcefile      | /etc/postgresql/18/main/postgresql.conf
sourceline      | 813
pending_restart | f
This is the first page that shows when we enter this url http://127.0.0.1:5000 in the browser.
Now, add the details like host type, database name, port, user name and password to connect to the postgres from pg_assistant like this.
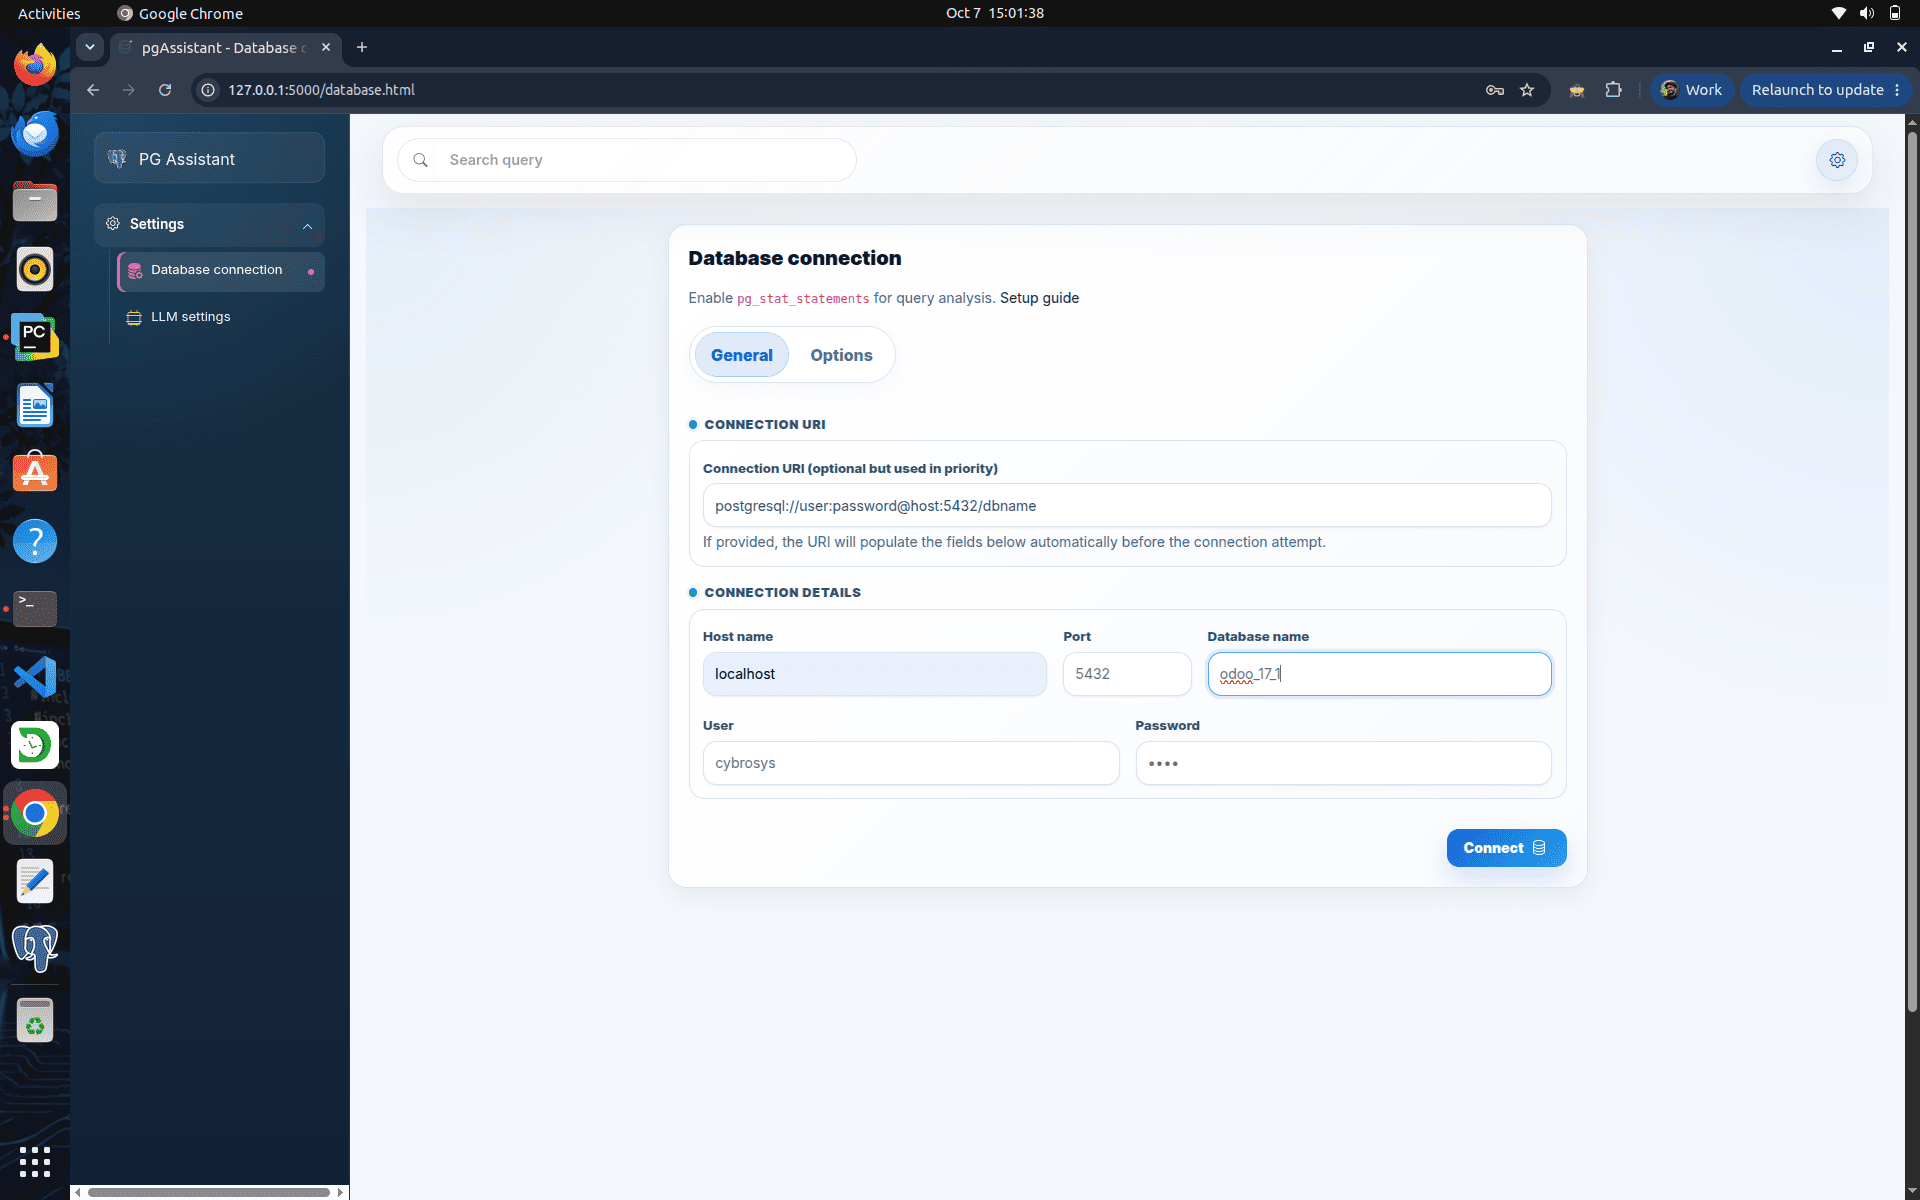
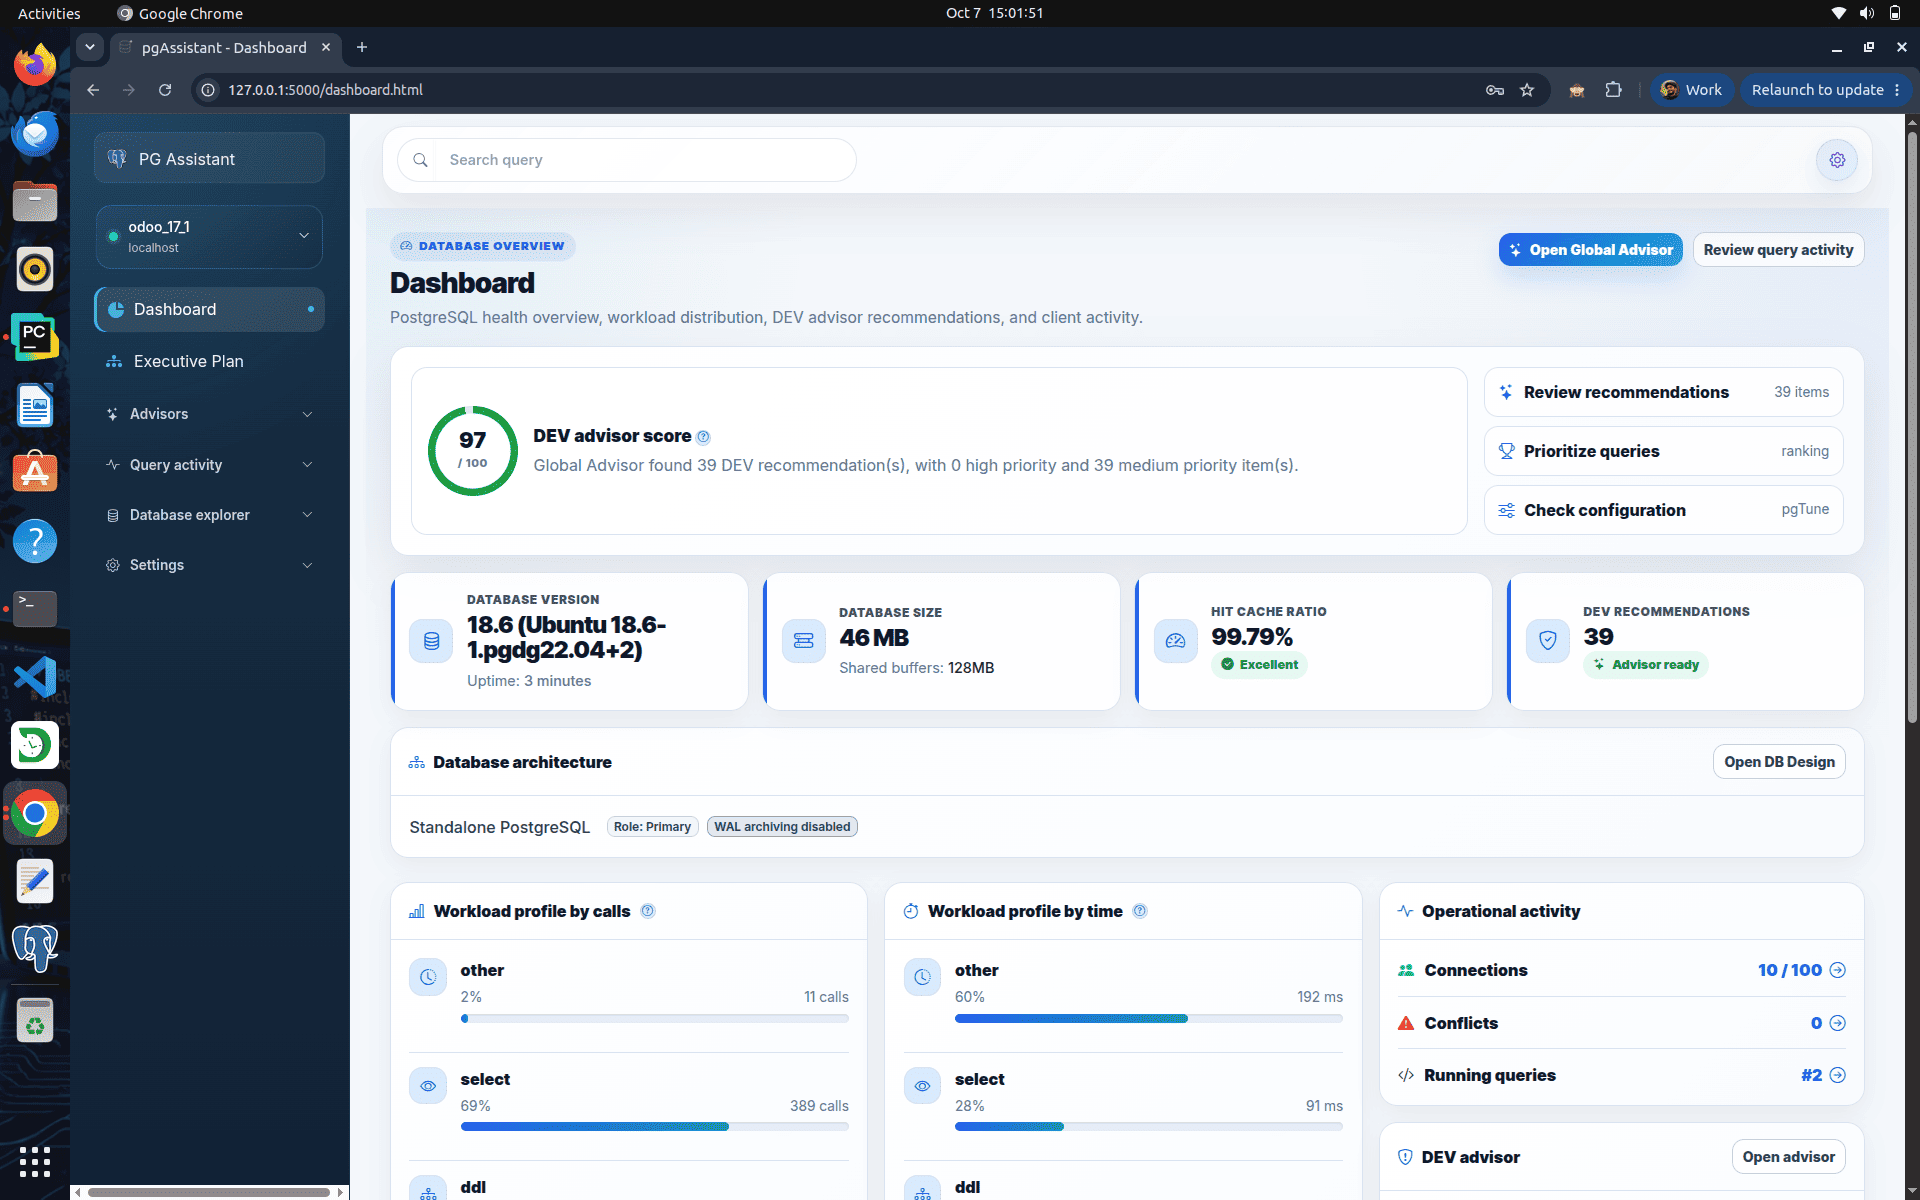
If the connection is successful, you can get a dashboard view like this.
The Dashboard serves as the main landing page of the database monitoring tool. It provides administrators and database engineers with a real-time overview of the postgres database, allowing them to quickly assess system health, identify performance issues, monitor activity, and access optimization recommendations from a single interface.
The dashboard combines performance metrics, workload analysis, database statistics, and advisory recommendations to help users monitor and optimize their postgres environment.
This includes
- A score at the top of this page
- Postgres version
- Database size
- Hit cache ratio
- Developer recommendations based on the analysis of this connected database
- Workload profile by calls
- Workload profile by time
- Operational activity like connections, conflicts, running queries
- DEV advisors like Missing useful foreign key indexes and Table without primary keys, etc.
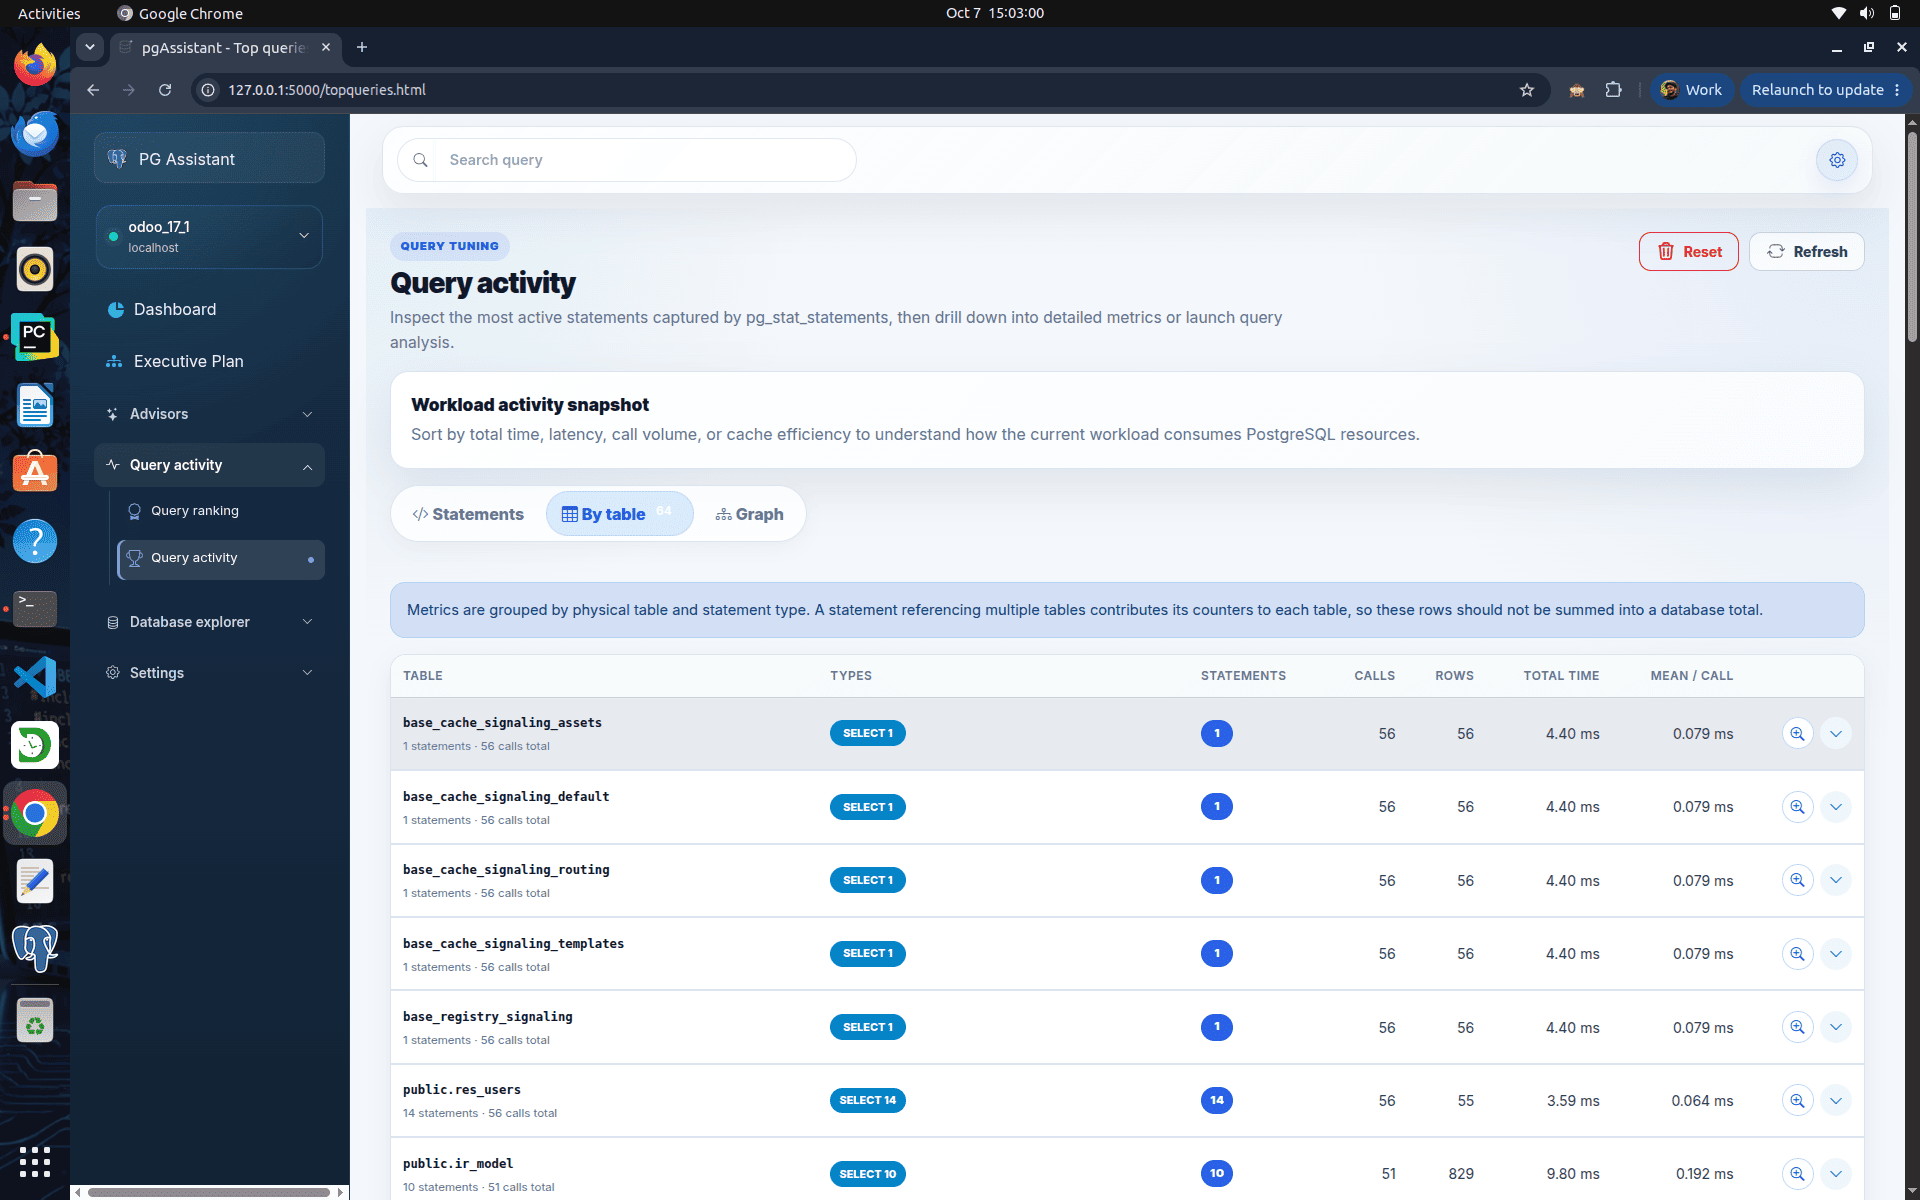
When you click on the query activity button on the top, you get this below page.
This page mainly shows the metadata from the extension named pg_stat_statements.
It includes the queries recorded in the pg_stat_statements view, and it includes the query total calls, total time taken, mean execution time, query identifier, etc.
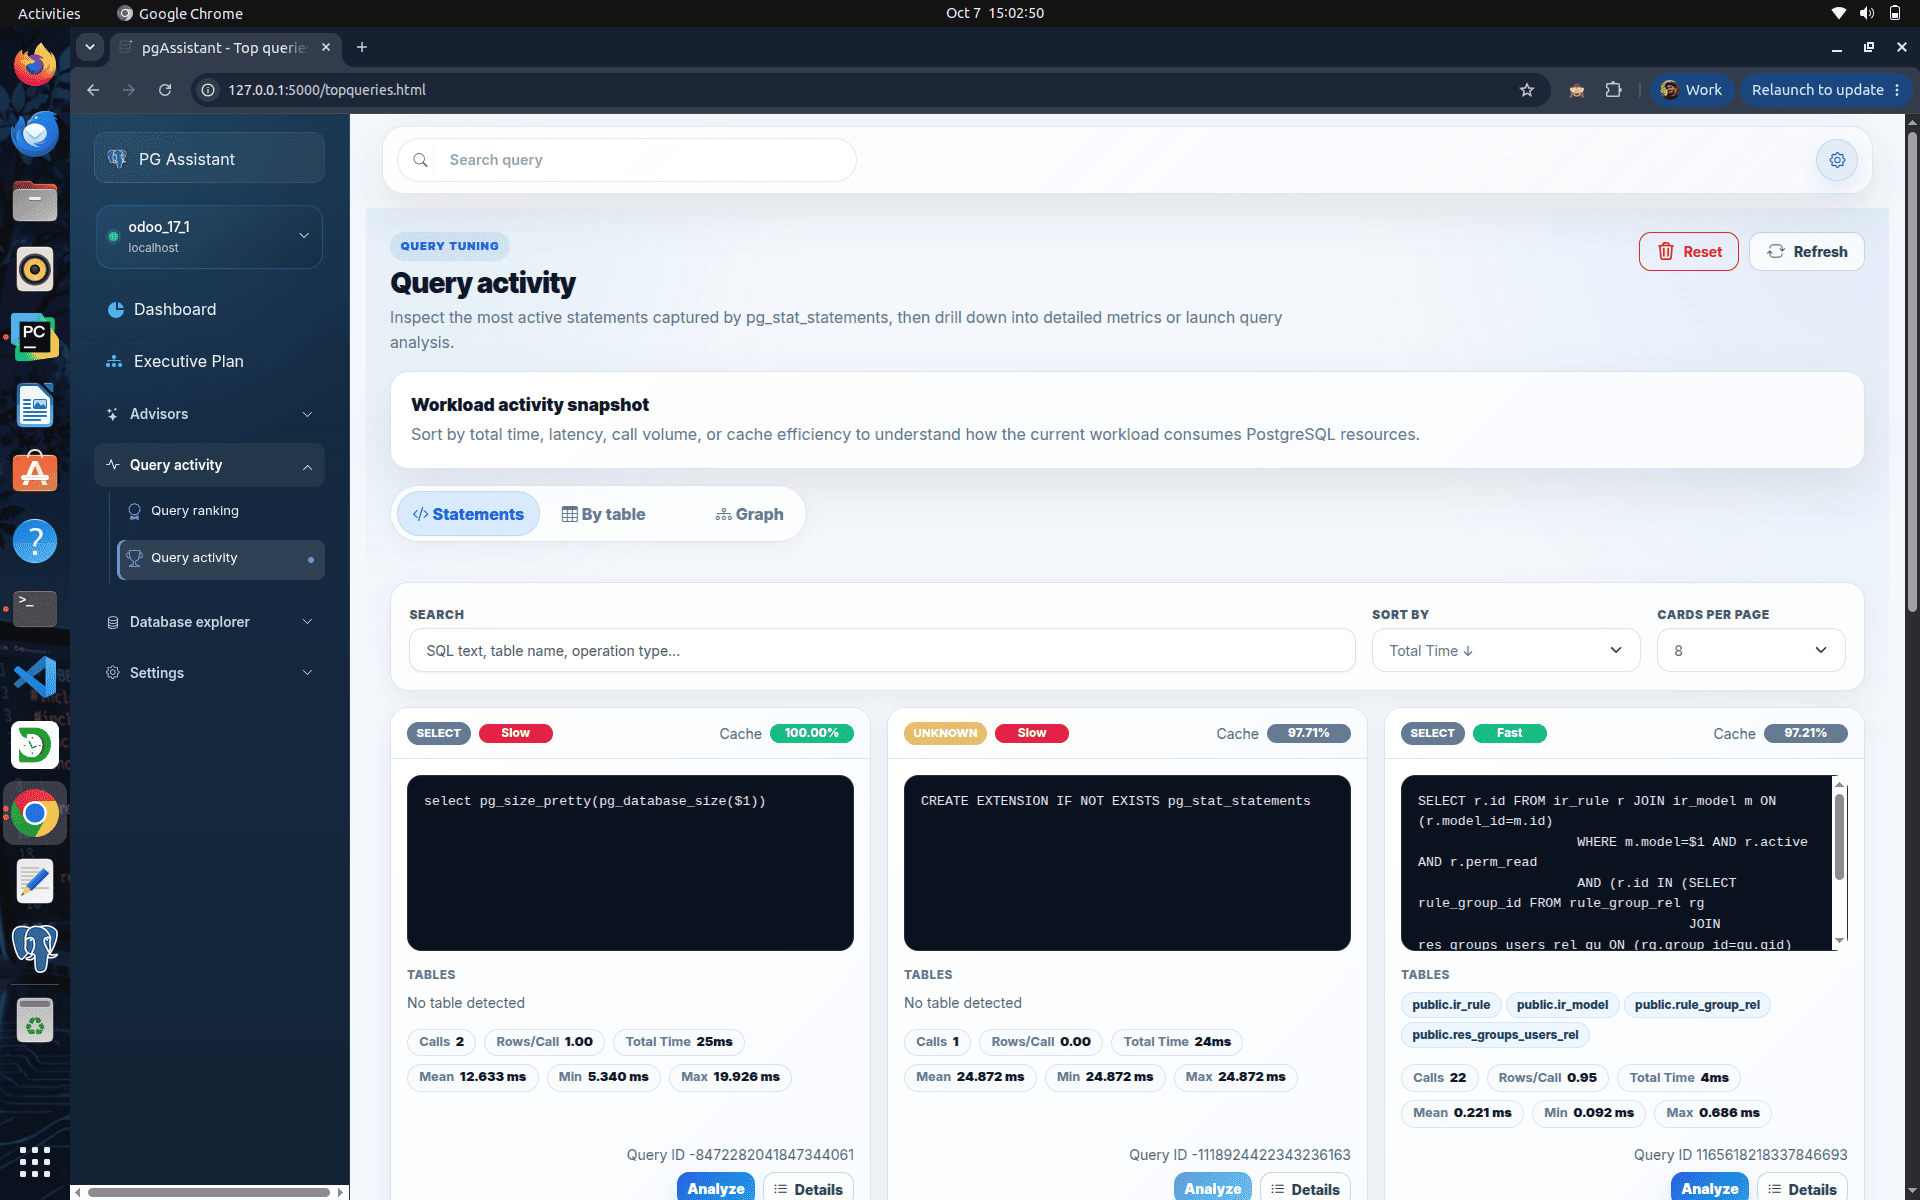
You can also get the query activity-related details based on the table-wise and also the graph-like view also.
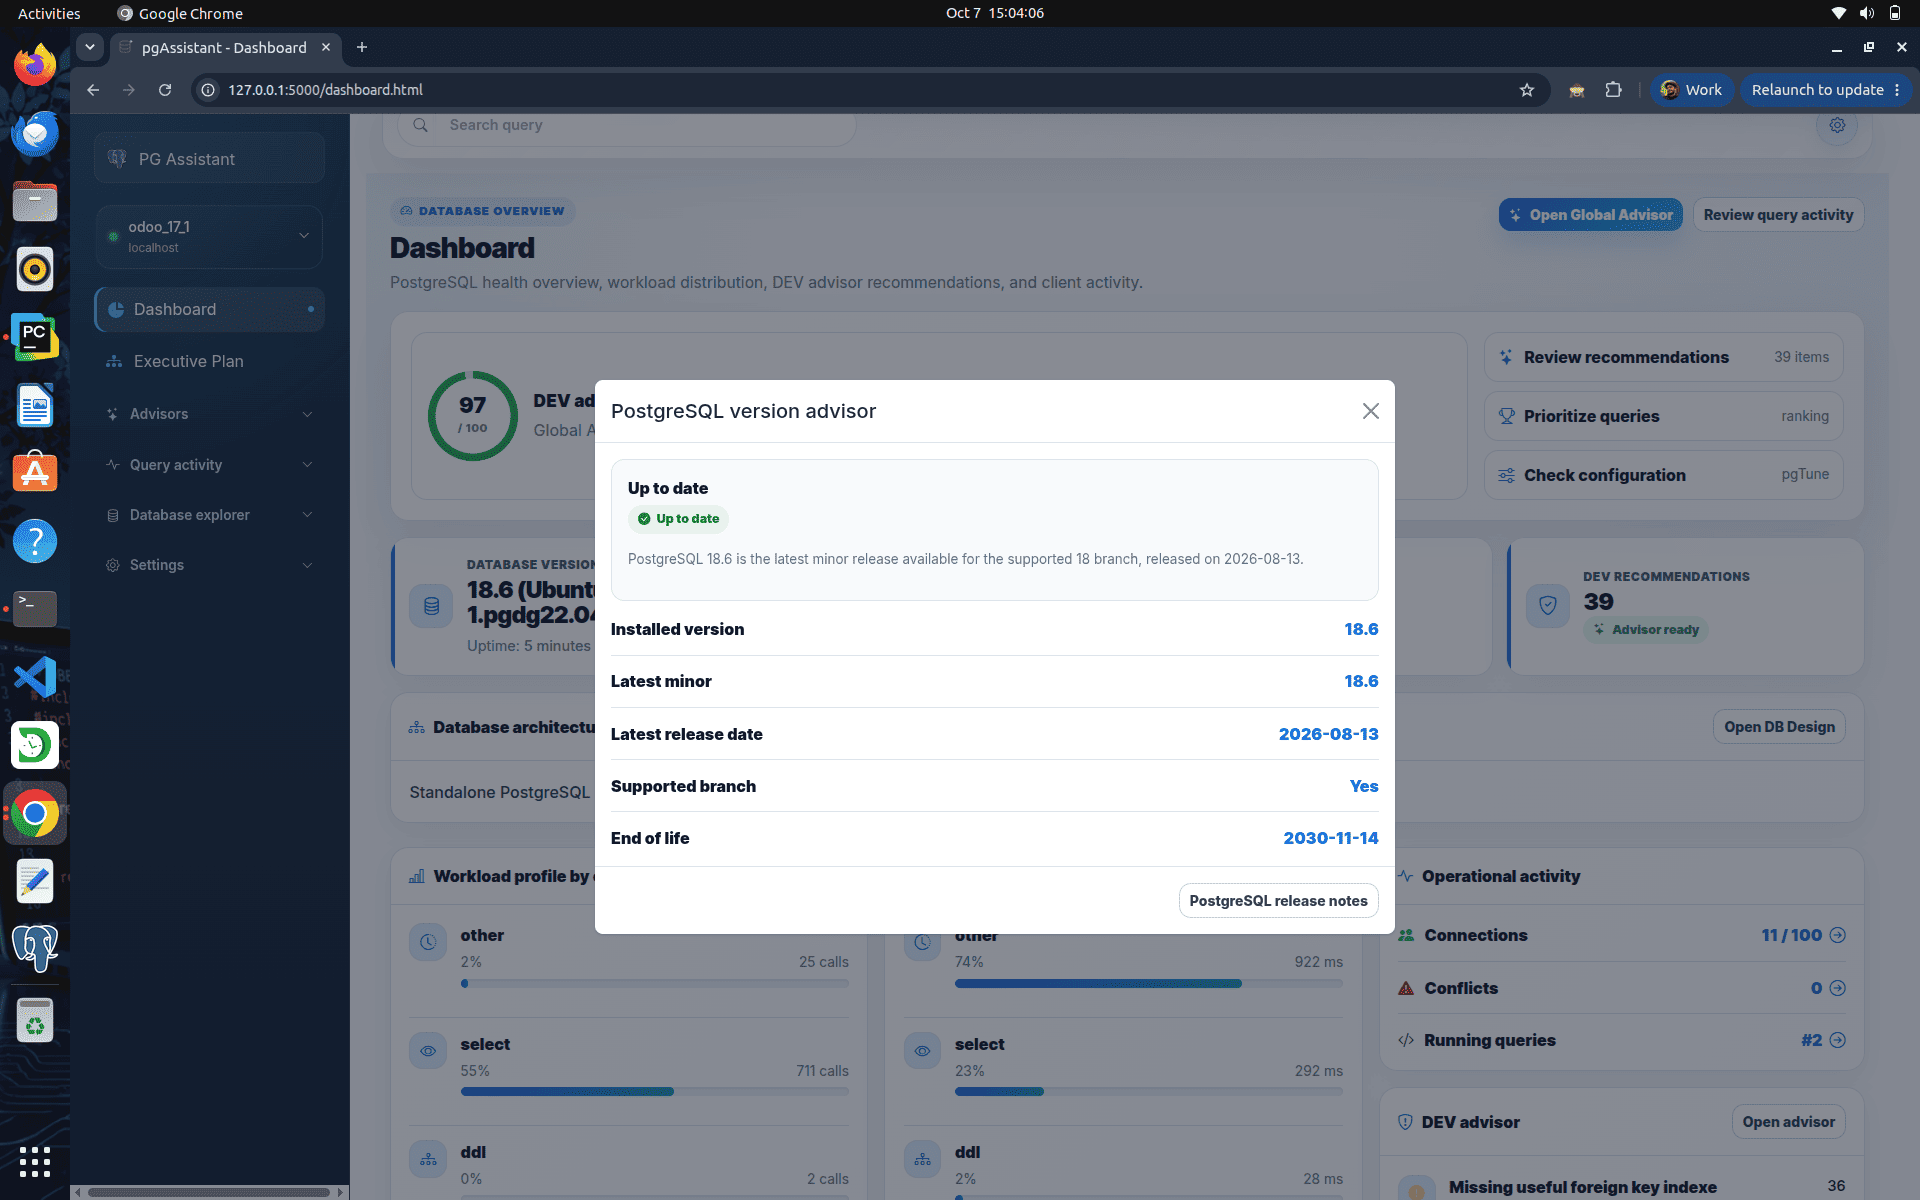
When you click on the postgres version in the dashboard, you get a small pop-up like this and it shows the latest released postgres version , the latest postgres version release date, its end-of-life cycle and release notes also.
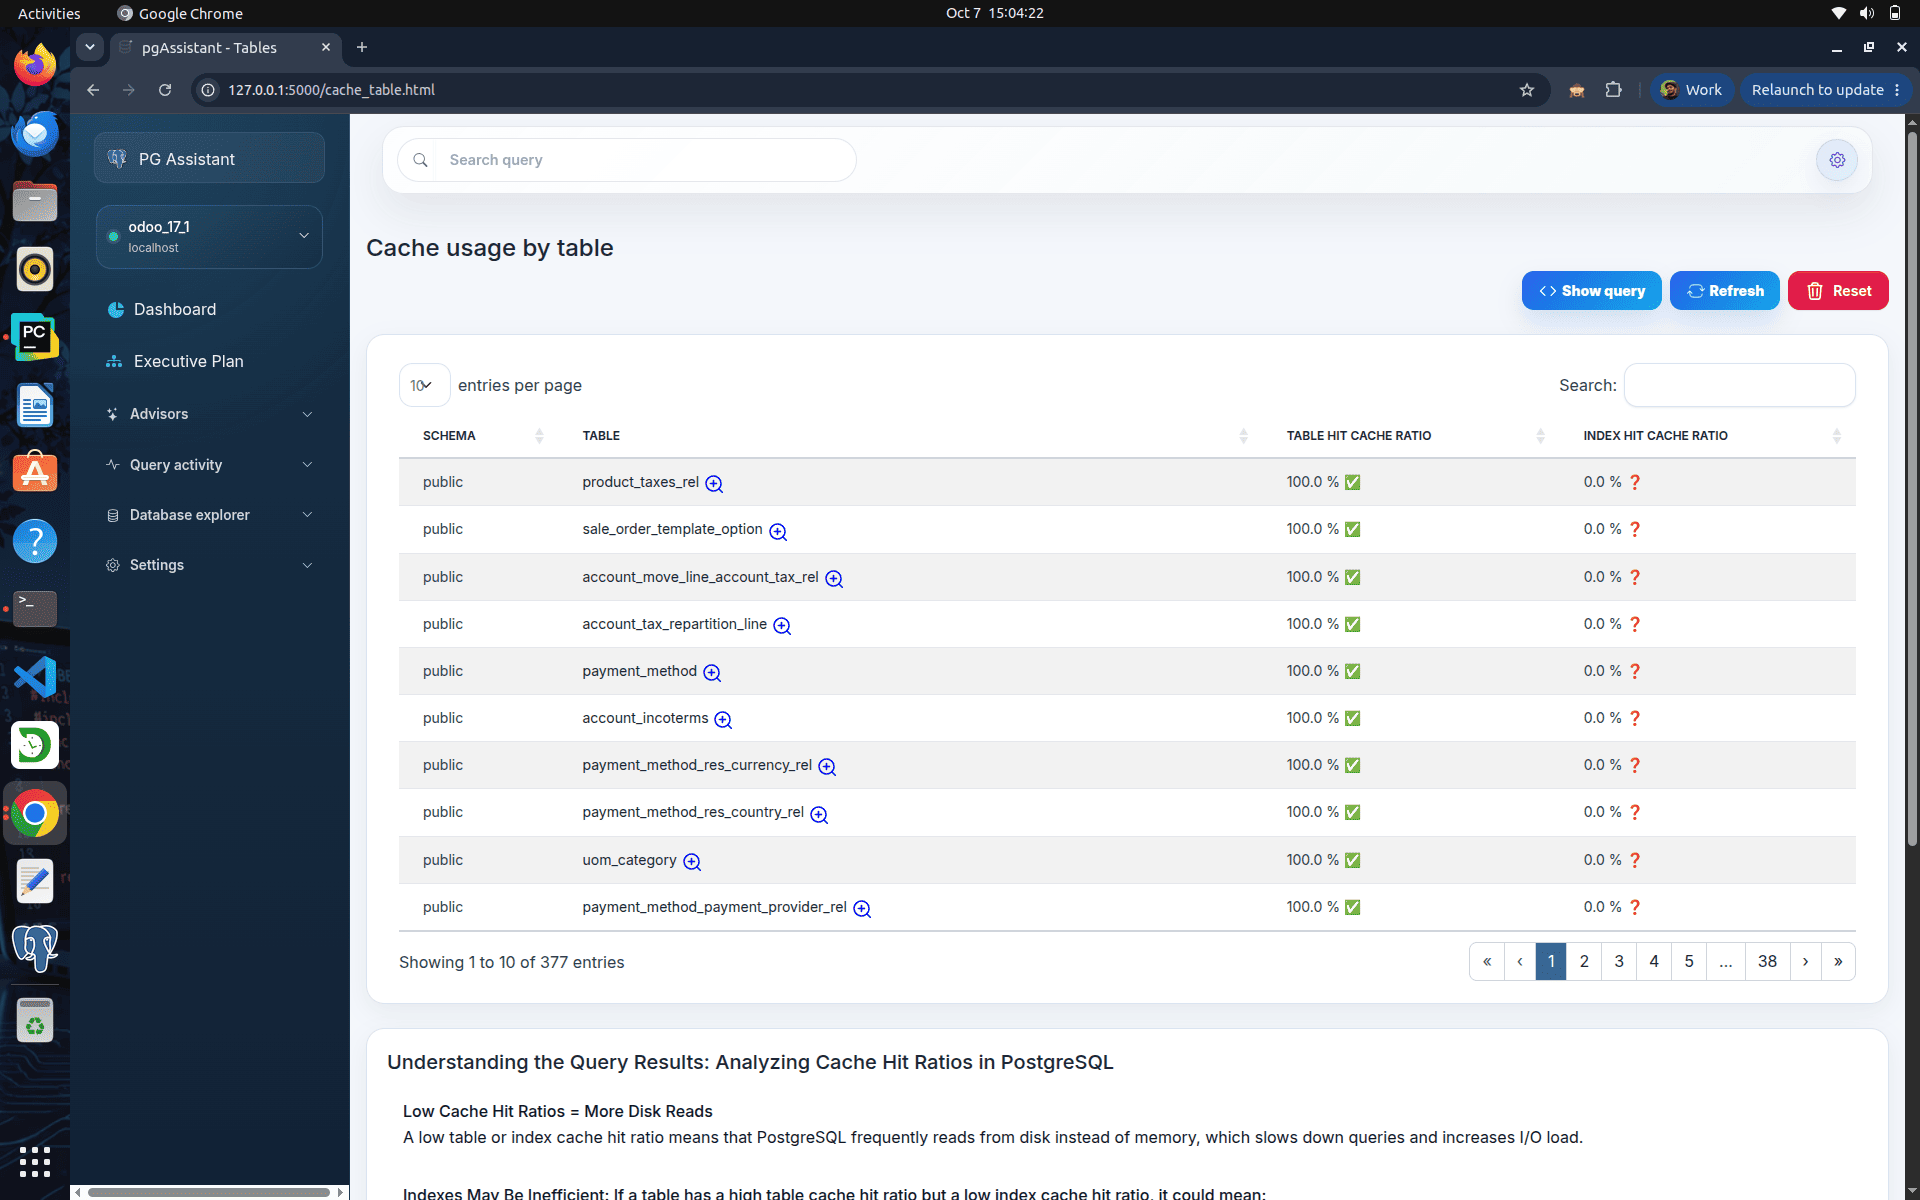
When you click on the hit cache ratio, you can see each table with its cache-related metadata like this.
It includes
- Scheme name
- Table name
- Table hit cache ratio
- Index hit cache ratio
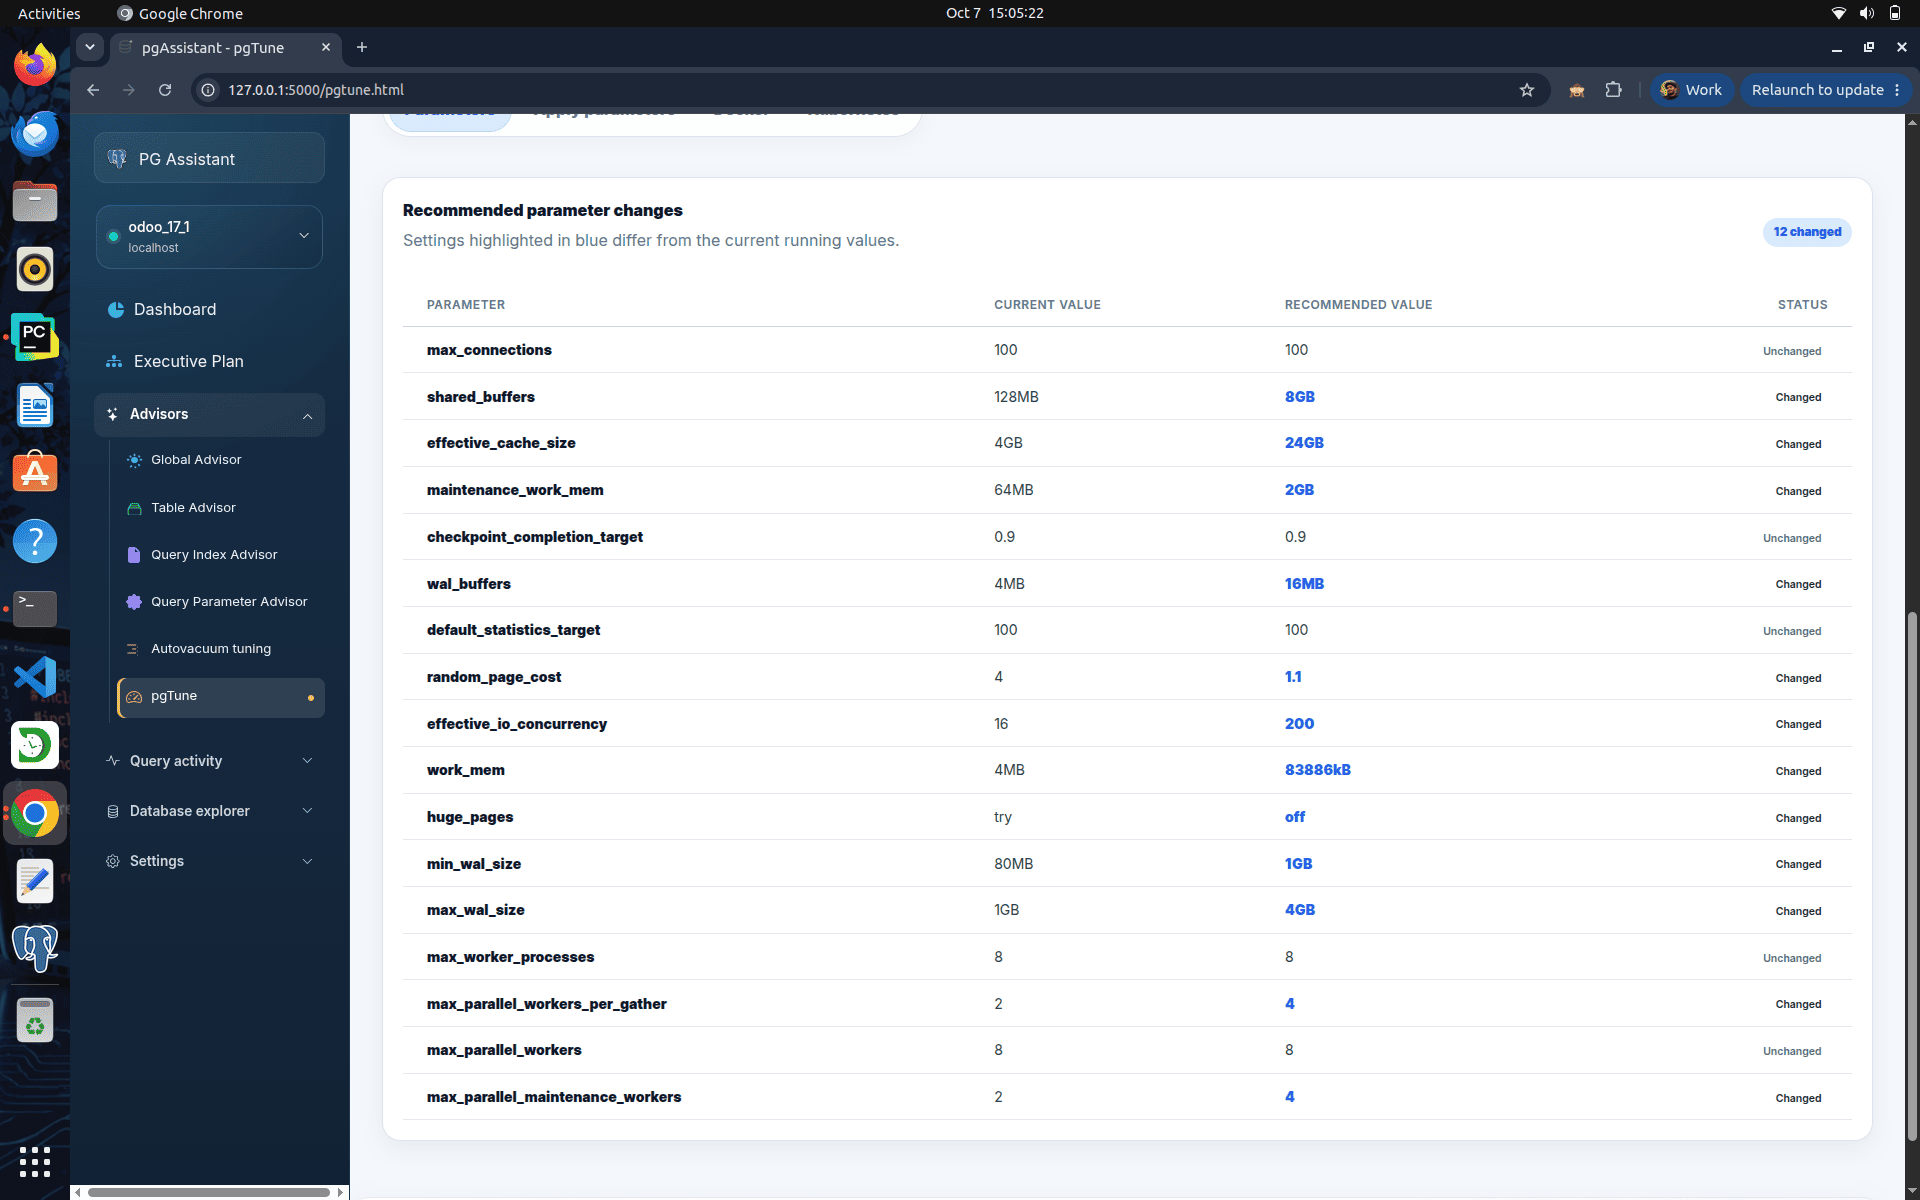
There is also a separate page for getting the best postgres parameters tuning-related recommendations.
Here, we can specify the database type, total memory, total CPU, max connections and data storage to get the best values for tuning the postgres parameters.
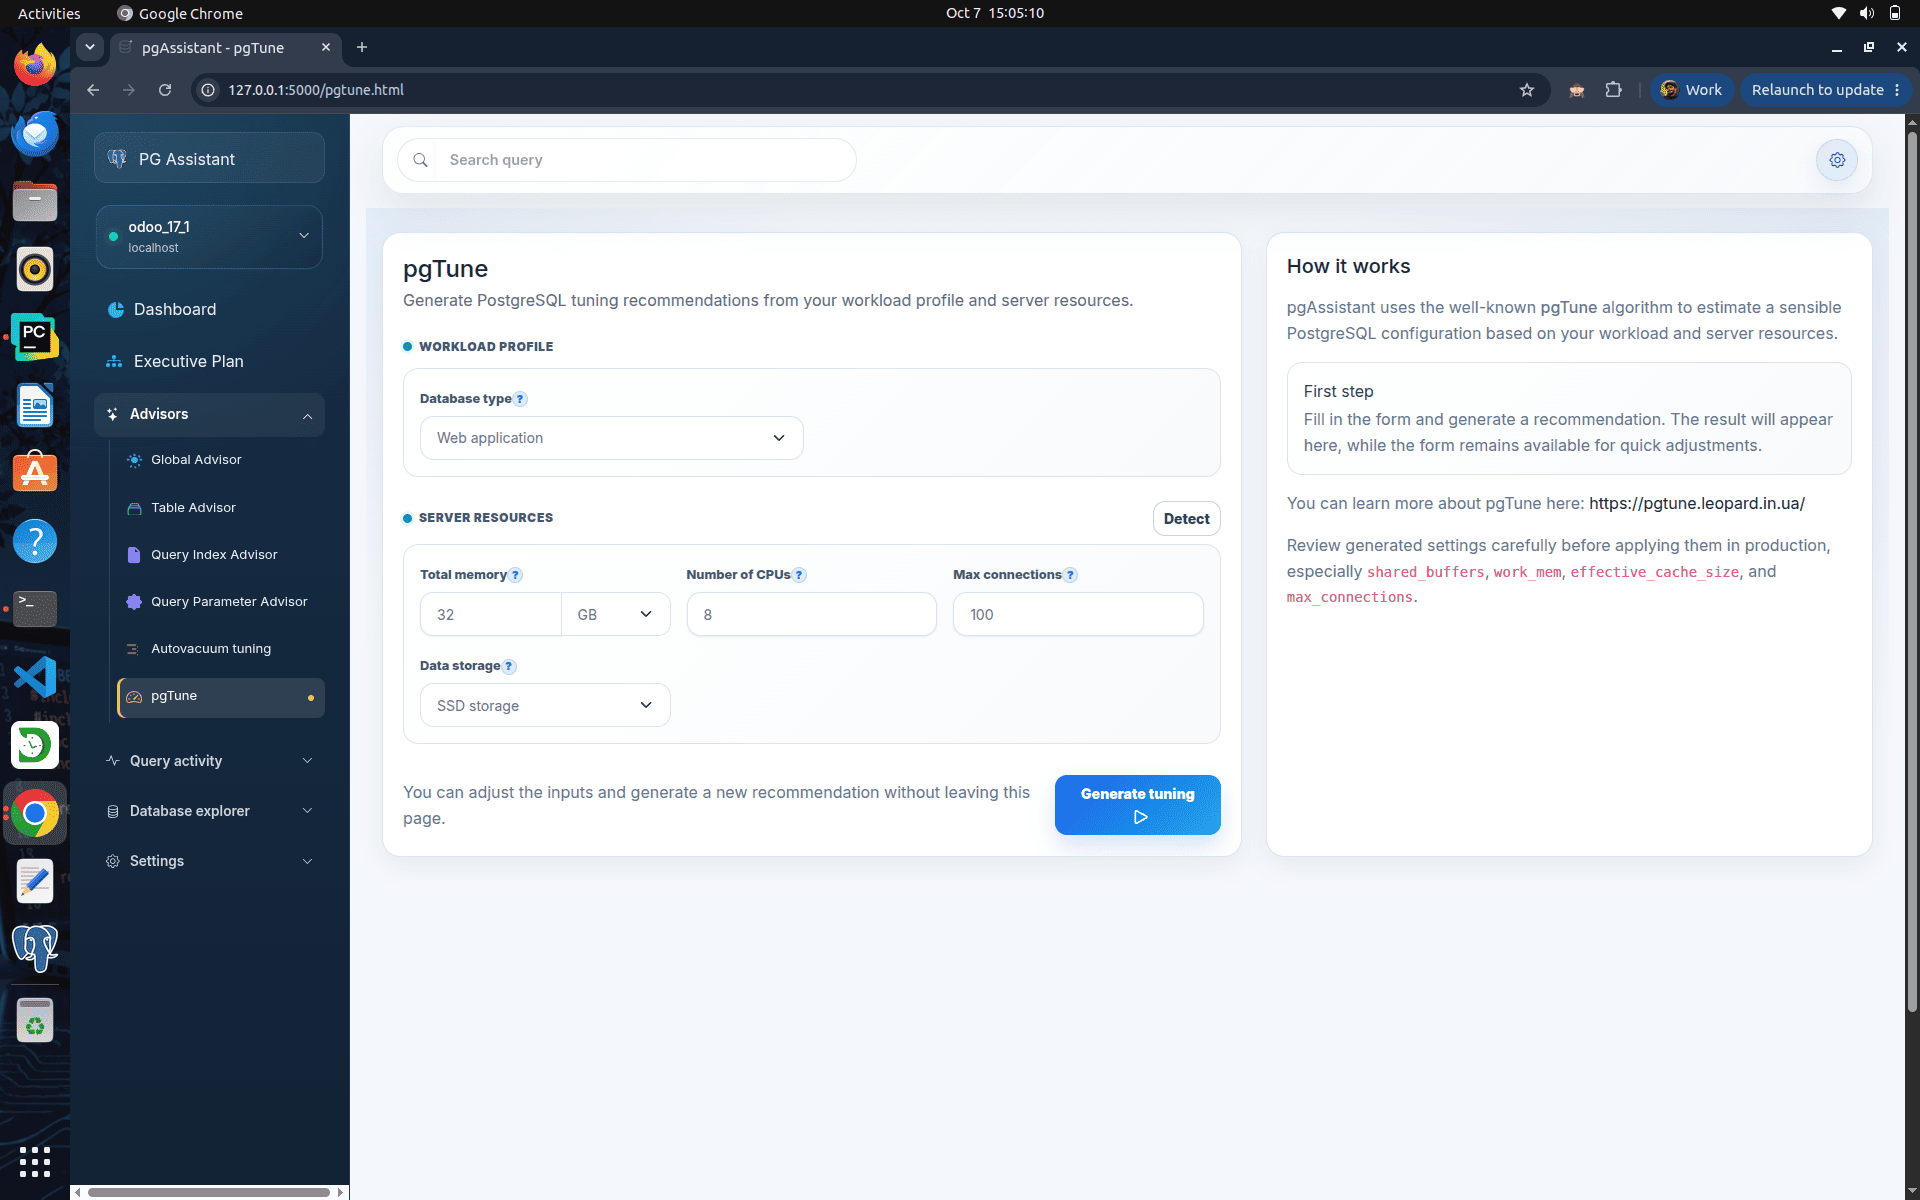
Example:
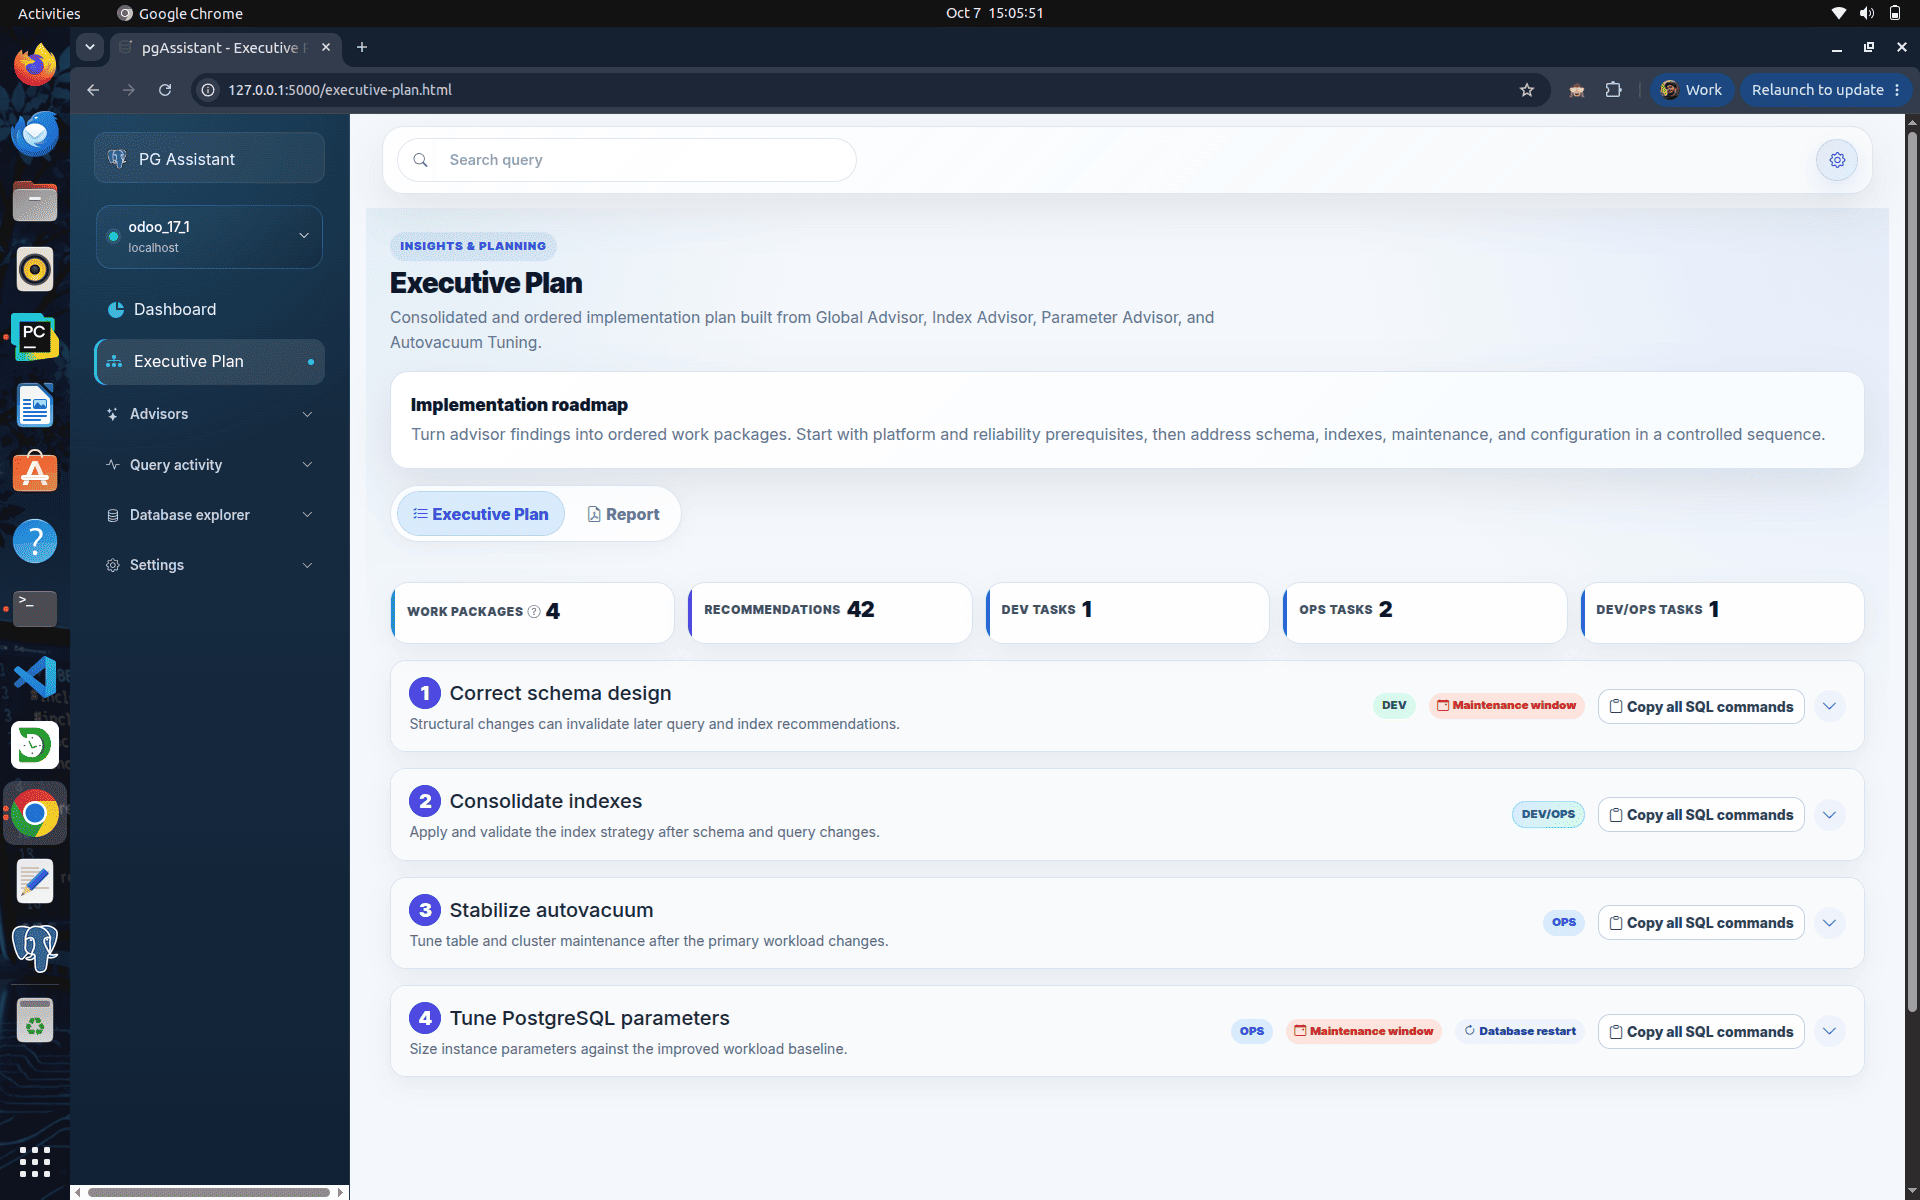
The Executive Plan page provides a structured roadmap for implementing the postgres optimization recommendations in the correct order.
It consolidates findings from various advisors into logical work packages, making it easier to plan database improvements. The page displays the total number of work packages, recommendations, and the distribution of DEV, OPS, and shared tasks.
Each work package focuses on a specific optimization area, such as schema design, index optimization, autovacuum tuning, or postgres parameter tuning. It also identifies the team responsible for each task and highlights operational requirements like maintenance windows or database restarts. Users can copy all SQL commands required for implementation and generate a report for documentation or sharing. Overall, this page helps administrators execute database optimization in a systematic, organized, and efficient manner.
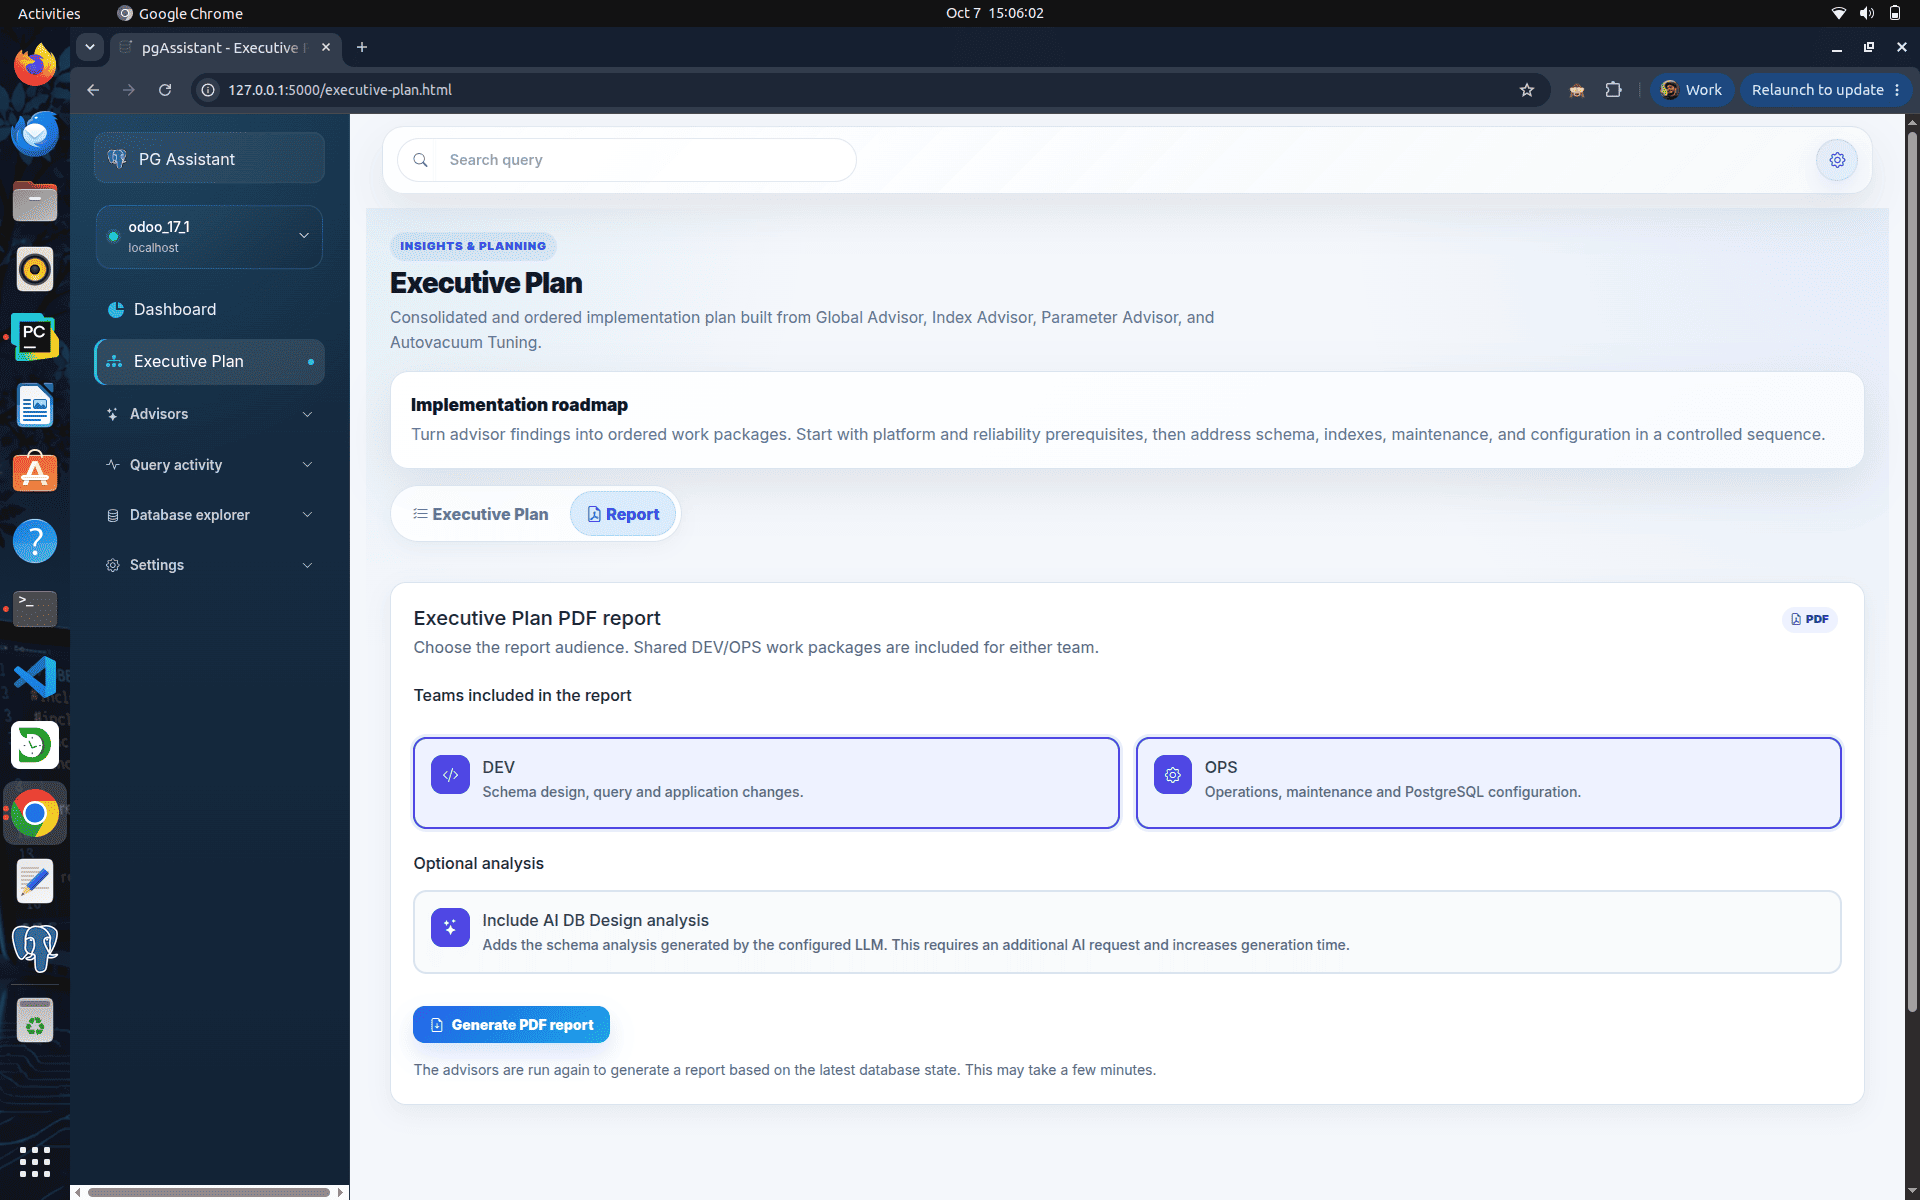
We can also generate a pdf report based on this.
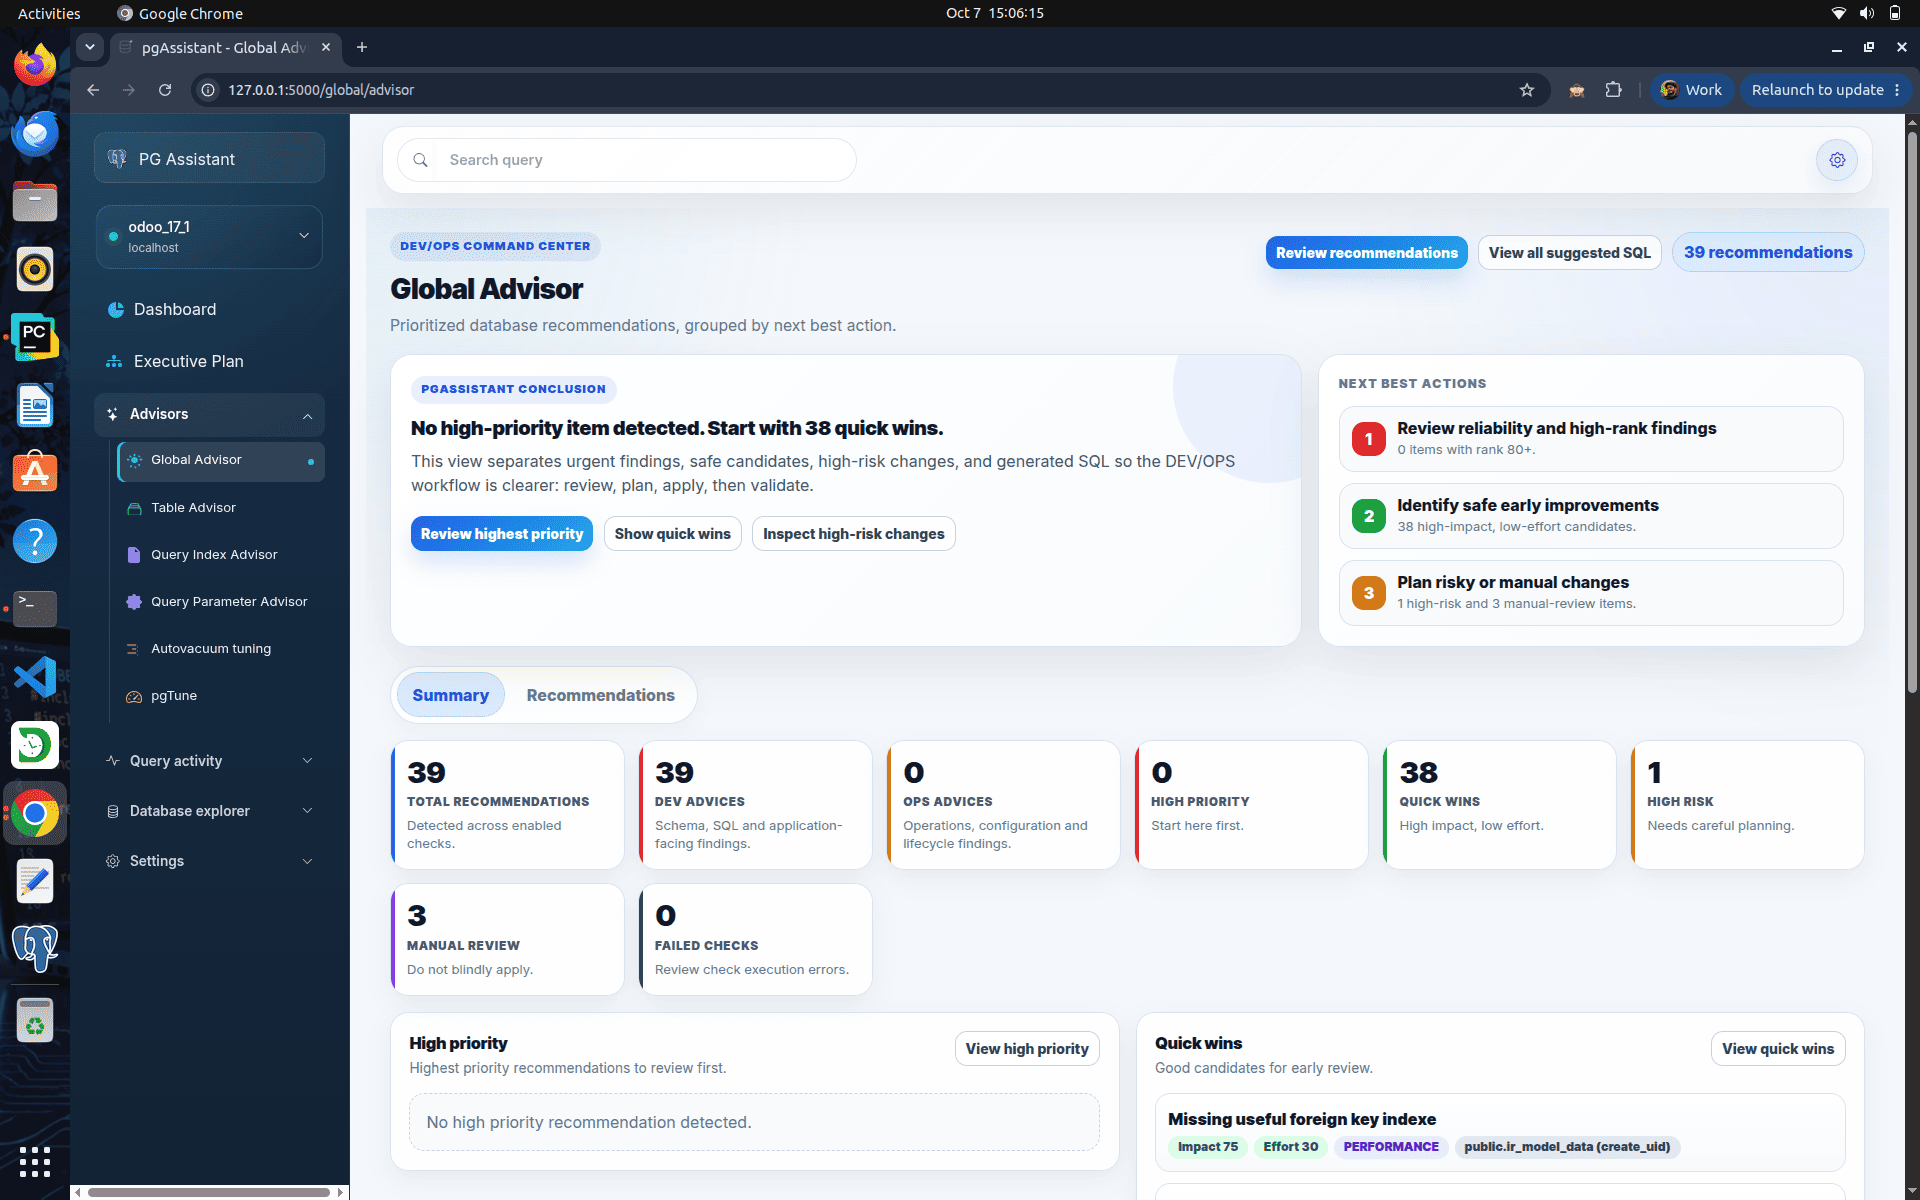
Now, there is a separate section for the advisors that includes the global advisor, table advisor, Query index advisor, query parameter advisor and also the autovacuum tuning.
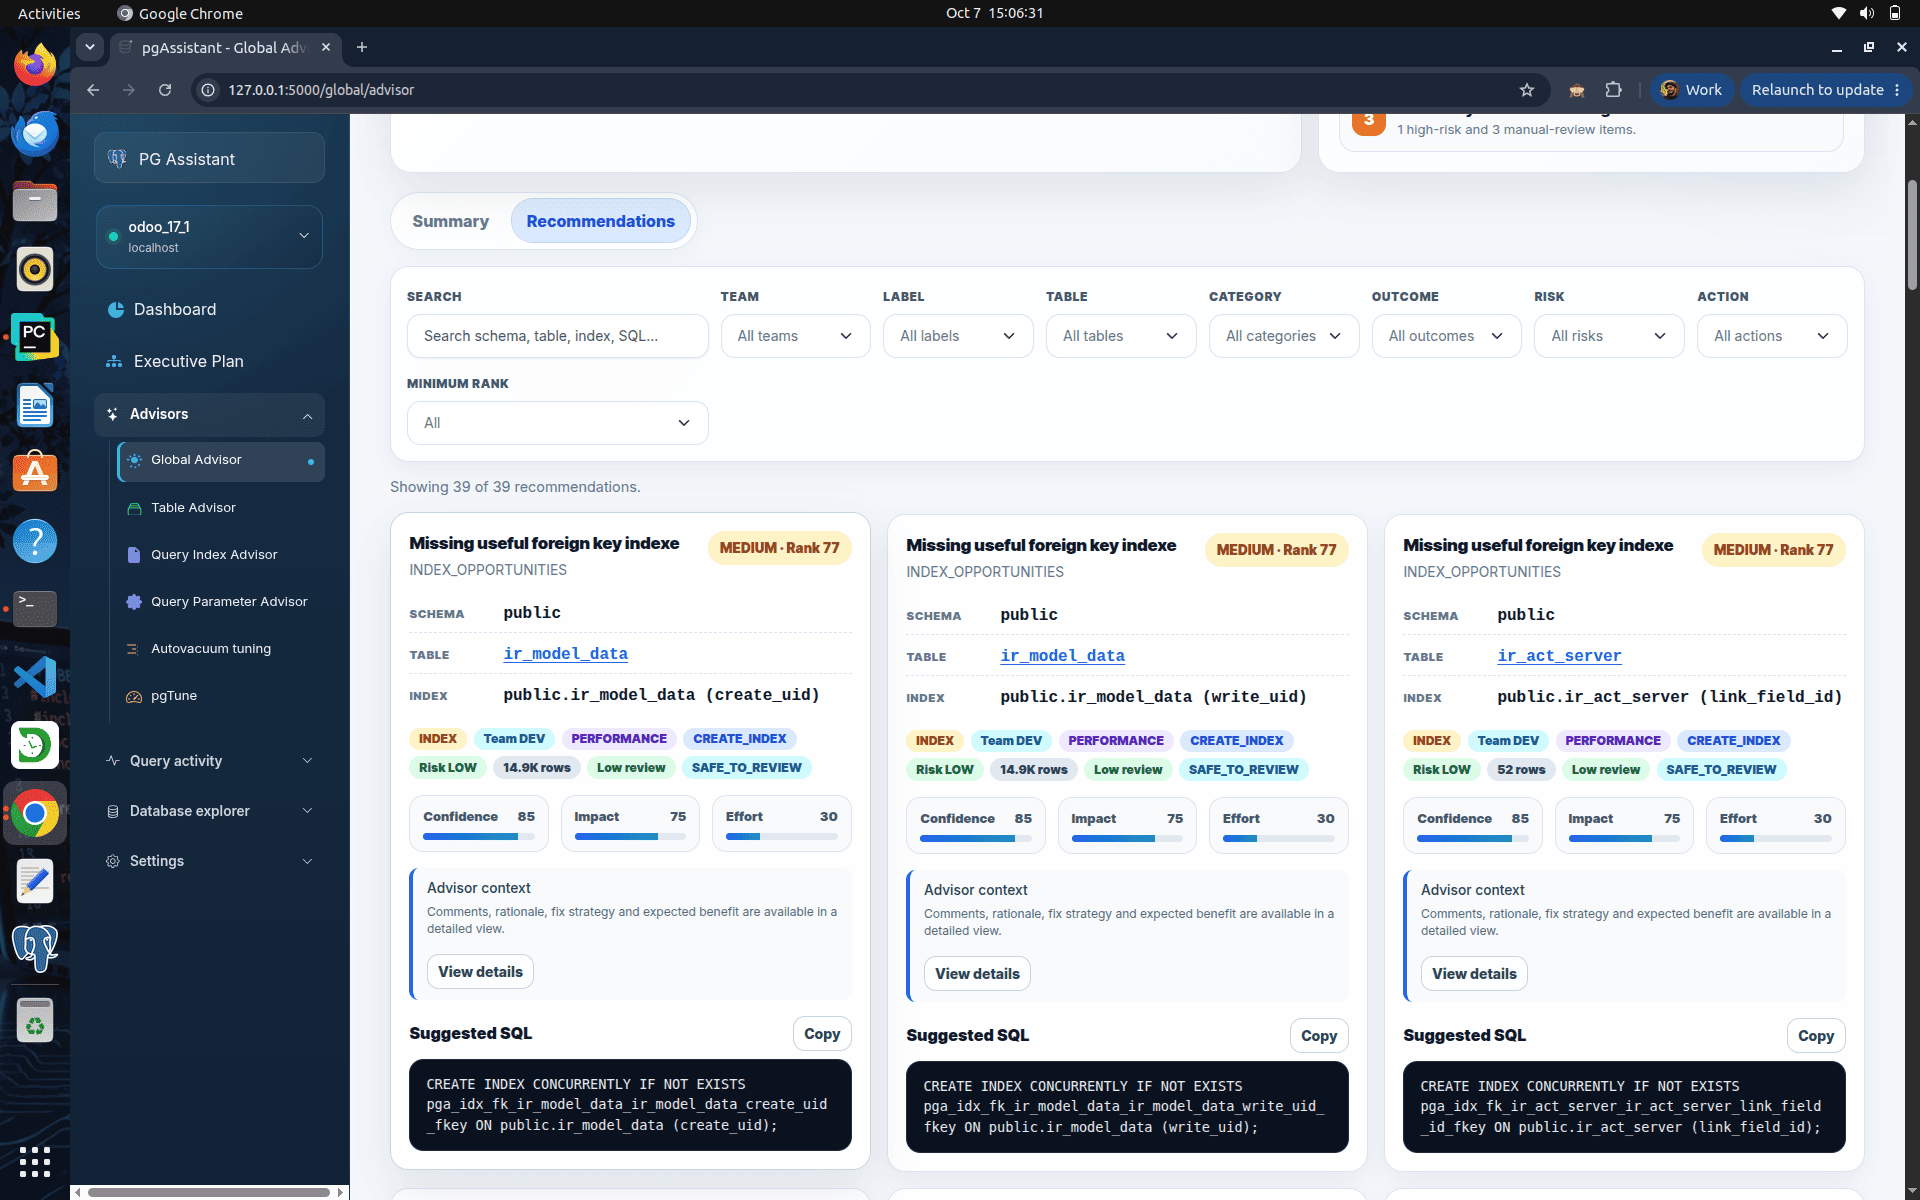
The Global Advisor page provides a centralized view of all database optimization recommendations generated by the monitoring tool. It prioritizes recommendations based on their impact and effort, helping administrators focus on the most beneficial improvements first.
This includes
- Summary of total recommendations
- High-priority-based recommendations
- Quick win things like Missing useful foreign key indexes, Table without primary keys.
When you click on the Recommendations tab, you can see more metadata related to Missing useful foreign key indexes, and it includes the schema name, table name, index and also it suggests the index creation query.
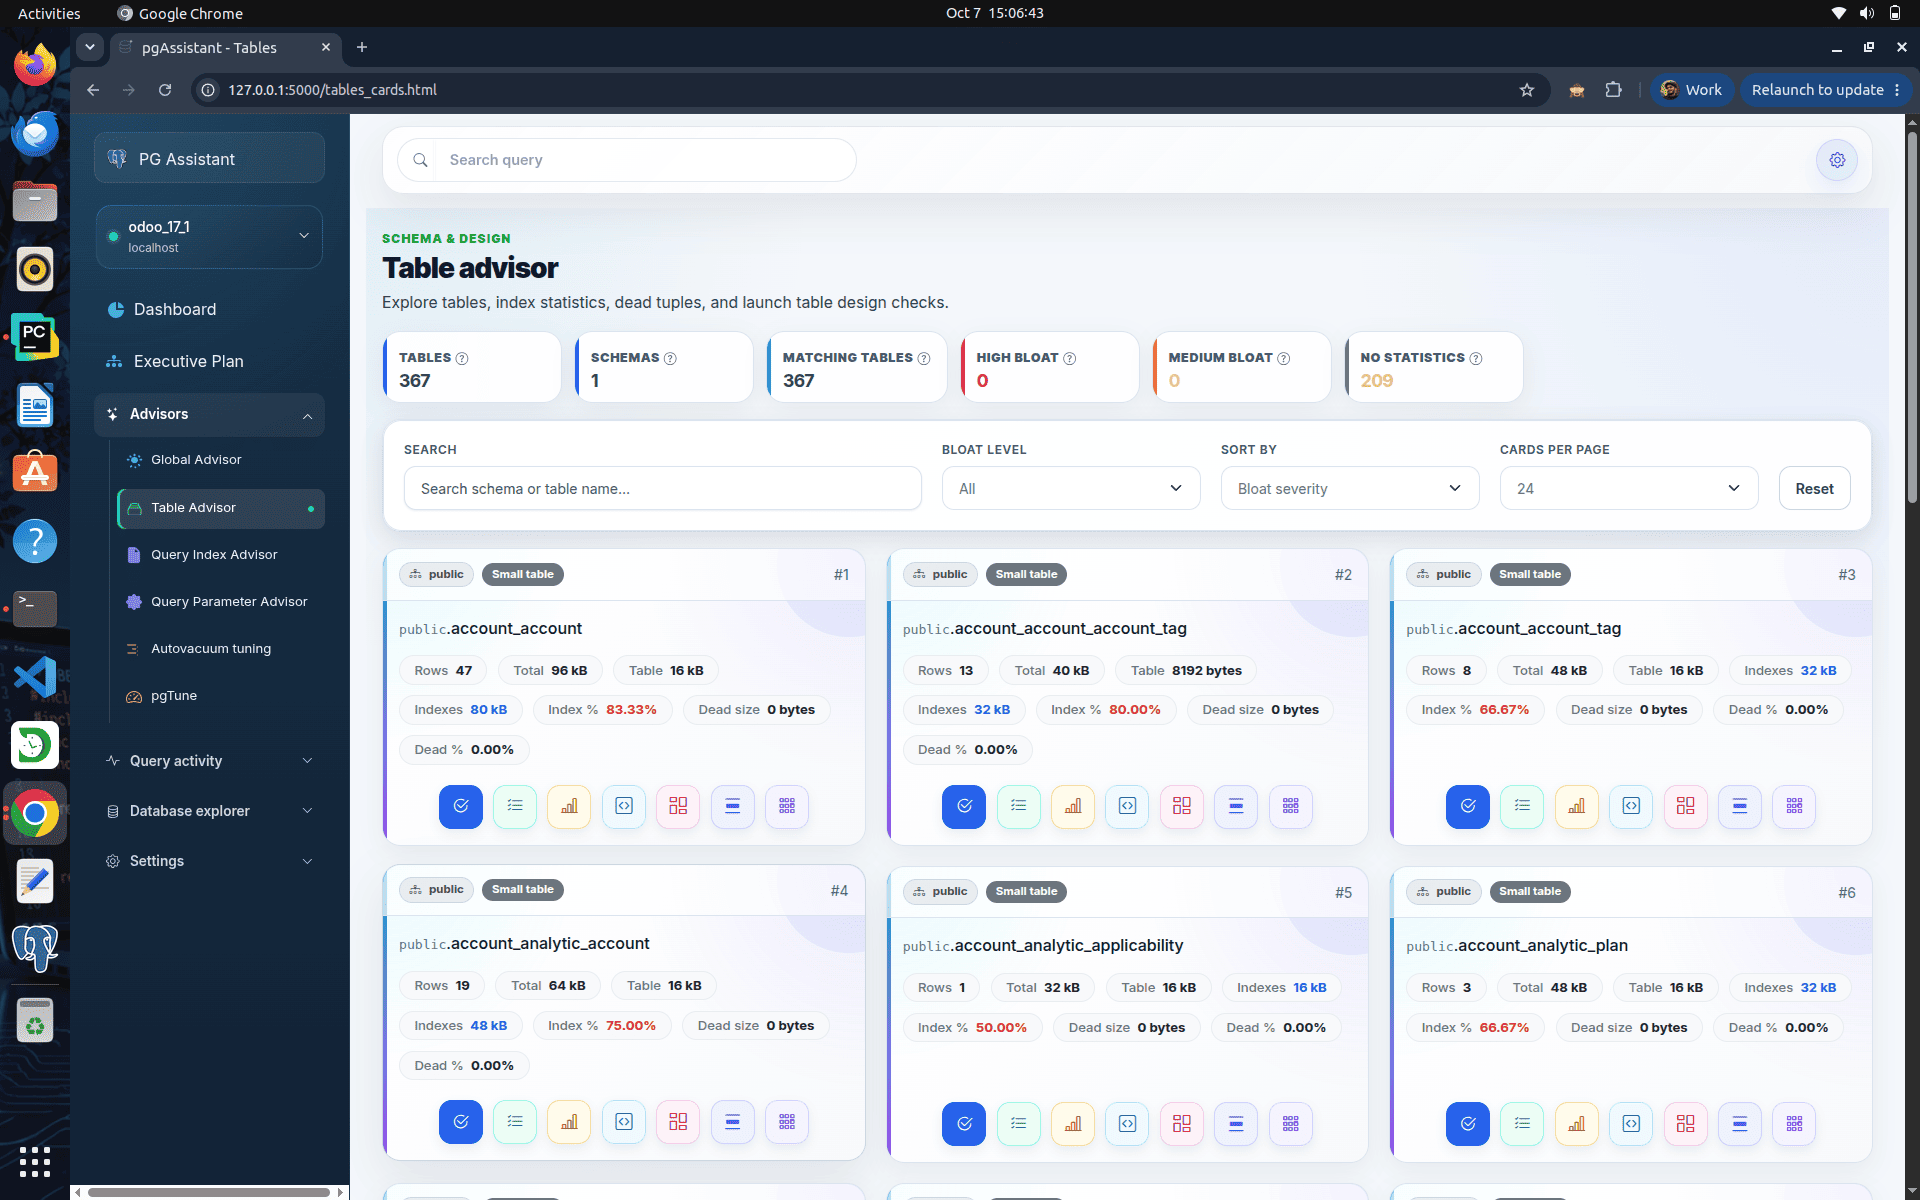
The table advisor page includes
- Schema name
- Table names
- Row counts
- Total table size with index
- Total table size without index
- Dead tuple ratio
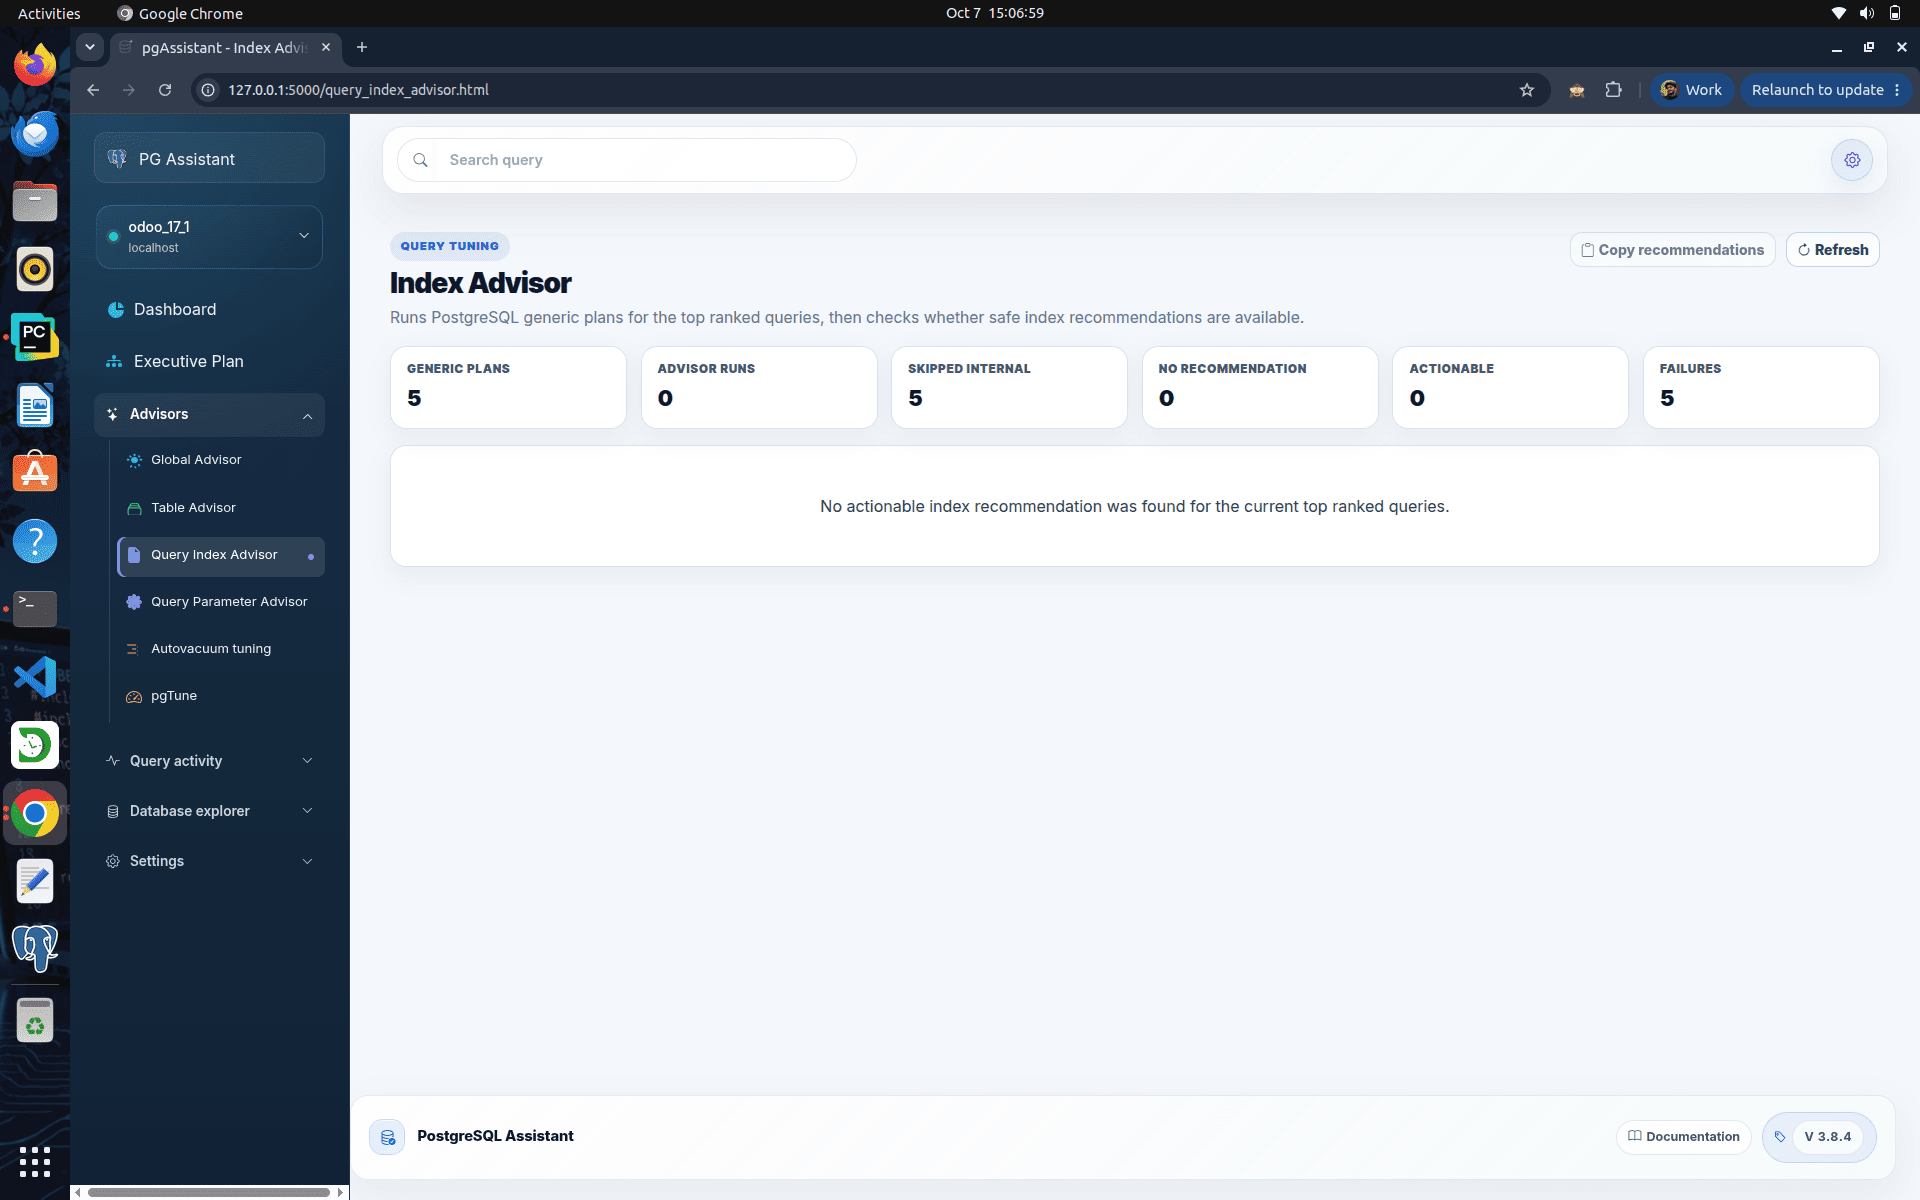
The Index Advisor page analyzes the execution plans of top-ranked queries to determine whether new indexes can improve query performance. It generates generic execution plans and evaluates them to identify safe and effective indexing opportunities.
The page provides a summary of analyzed queries, advisor runs, skipped queries, actionable recommendations, queries with no recommendations, and any analysis failures. Users can refresh the analysis or copy the generated recommendations for implementation.
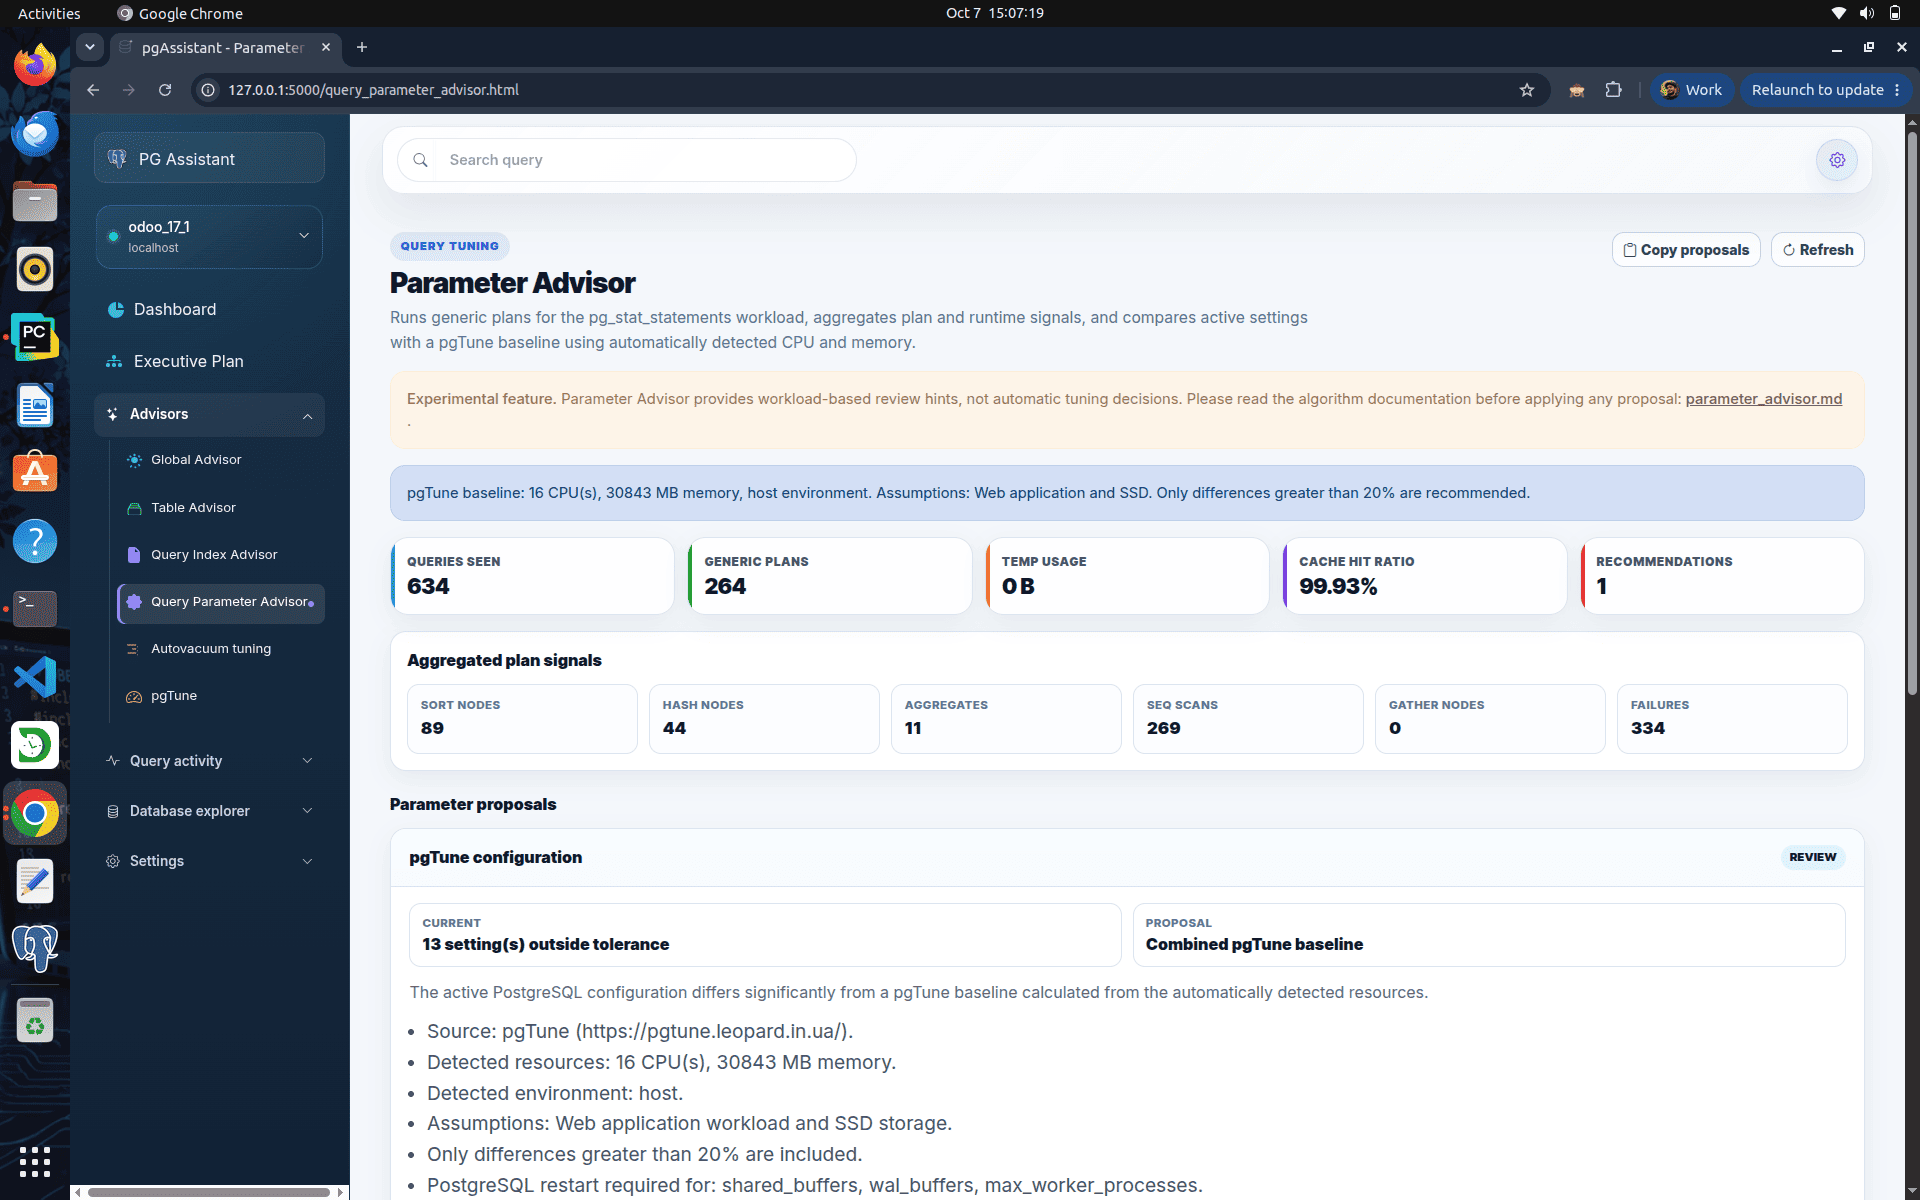
This parameter advisor page mainly runs generic plans for the pg_stat_statements workload, aggregates plan and runtime signals, and compares active settings with a pgTune baseline using automatically detected cpu and memory.
We can see the list of best values for setting the postgres parameters like this.
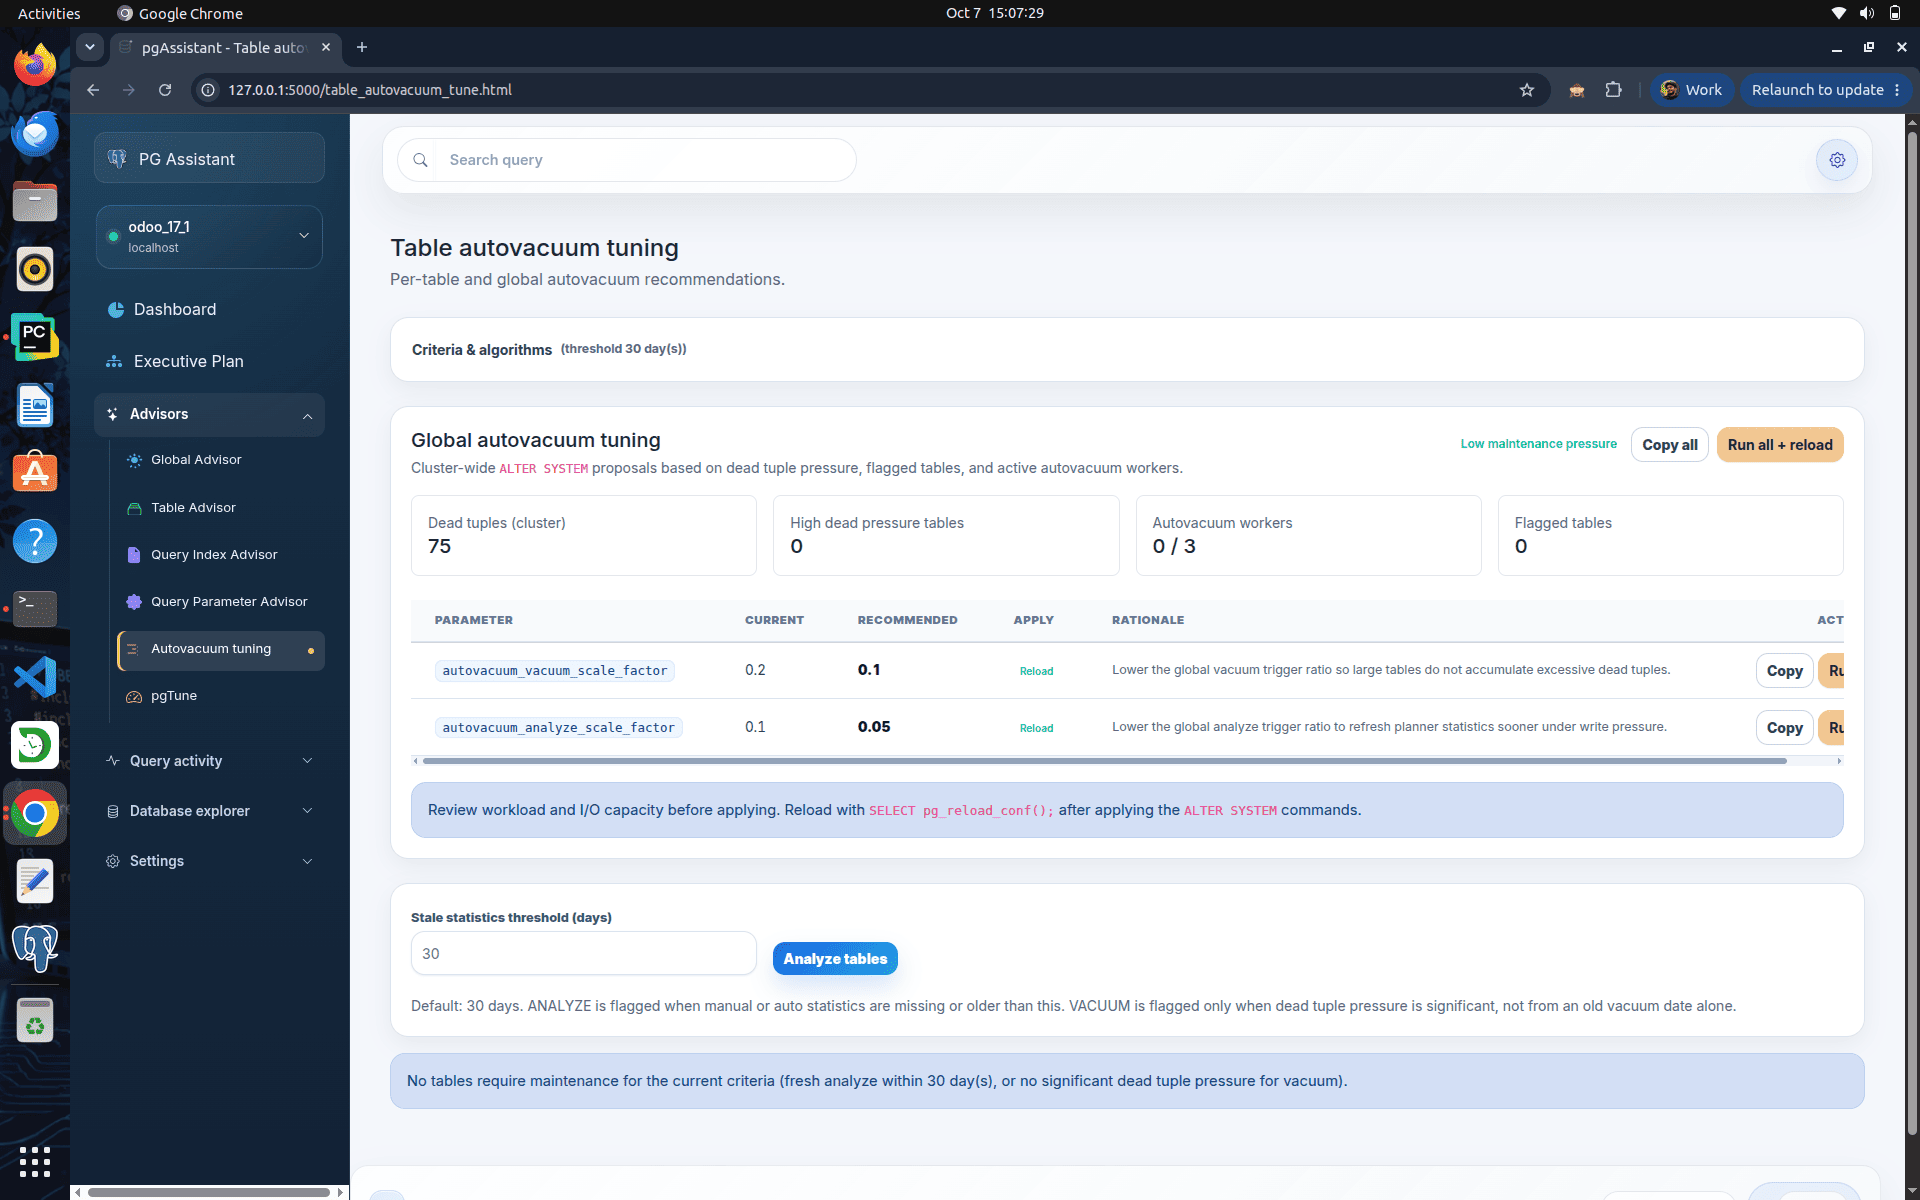
The Autovacuum Tuning page provides recommendations for optimizing the autovacuum settings of postgres at both the cluster and table levels.
It analyzes dead tuples, autovacuum worker usage, maintenance pressure, and flagged tables to determine whether tuning is required. The page displays current and recommended autovacuum parameters along with the rationale for each recommendation and the required action, such as a configuration reload.
Users can copy or apply the generated configuration changes directly and analyze tables based on configurable maintenance criteria. It also identifies tables that require vacuum or analyze operations due to stale statistics or excessive dead tuples. Overall, this page helps administrators improve database maintenance efficiency, prevent table bloat, and ensure optimal query performance through effective autovacuum configuration.
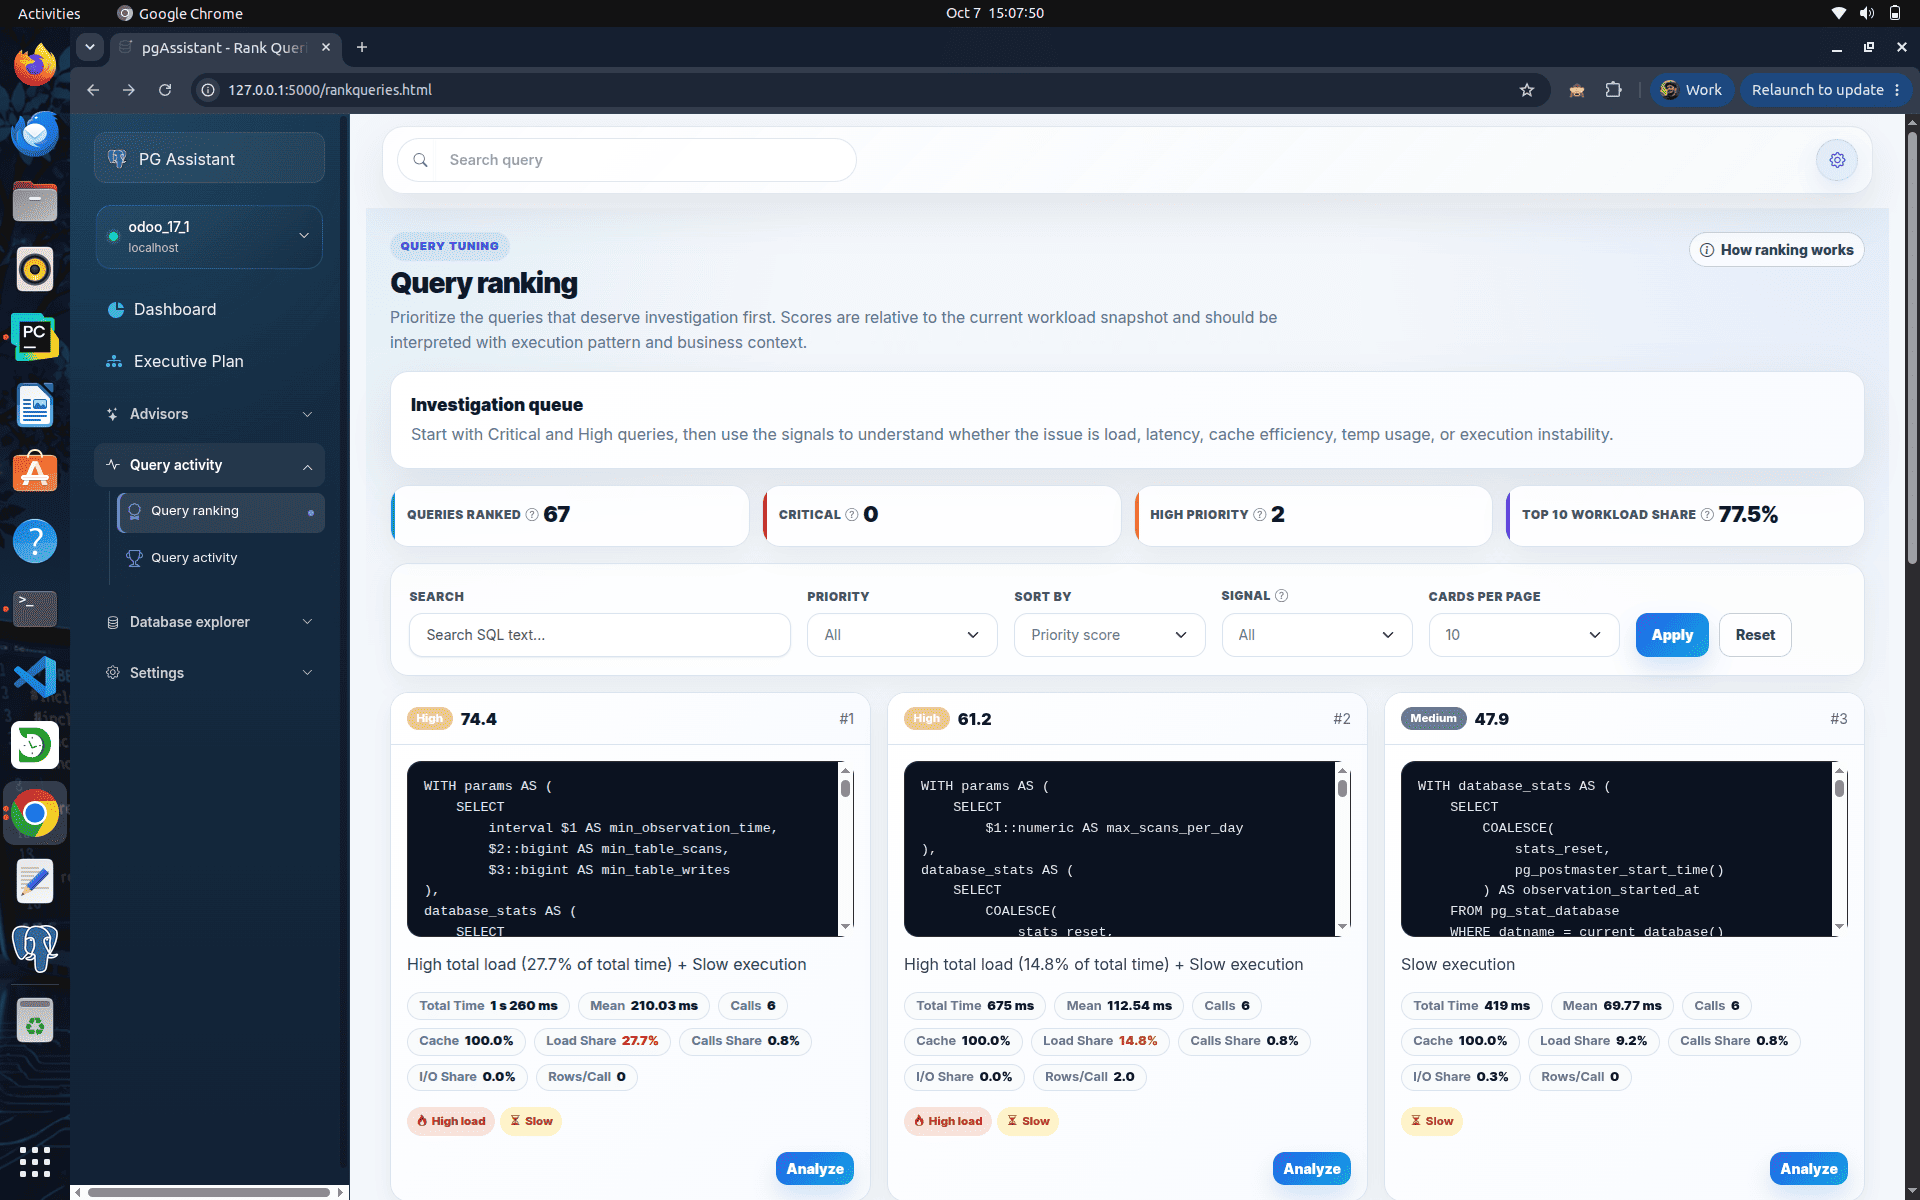
This query ranking page mainly displays the high-ranked queries that include each query's metadata, like:
- Total query execution time
- Total mean execution time
- Total query calls
- Cache hit ratio
- Calls share ratio
- Load share ratio
- i/o ratio
- Type of query ranking levels like high, medium, etc.
This tools page mainly contains a group of table metadata options.
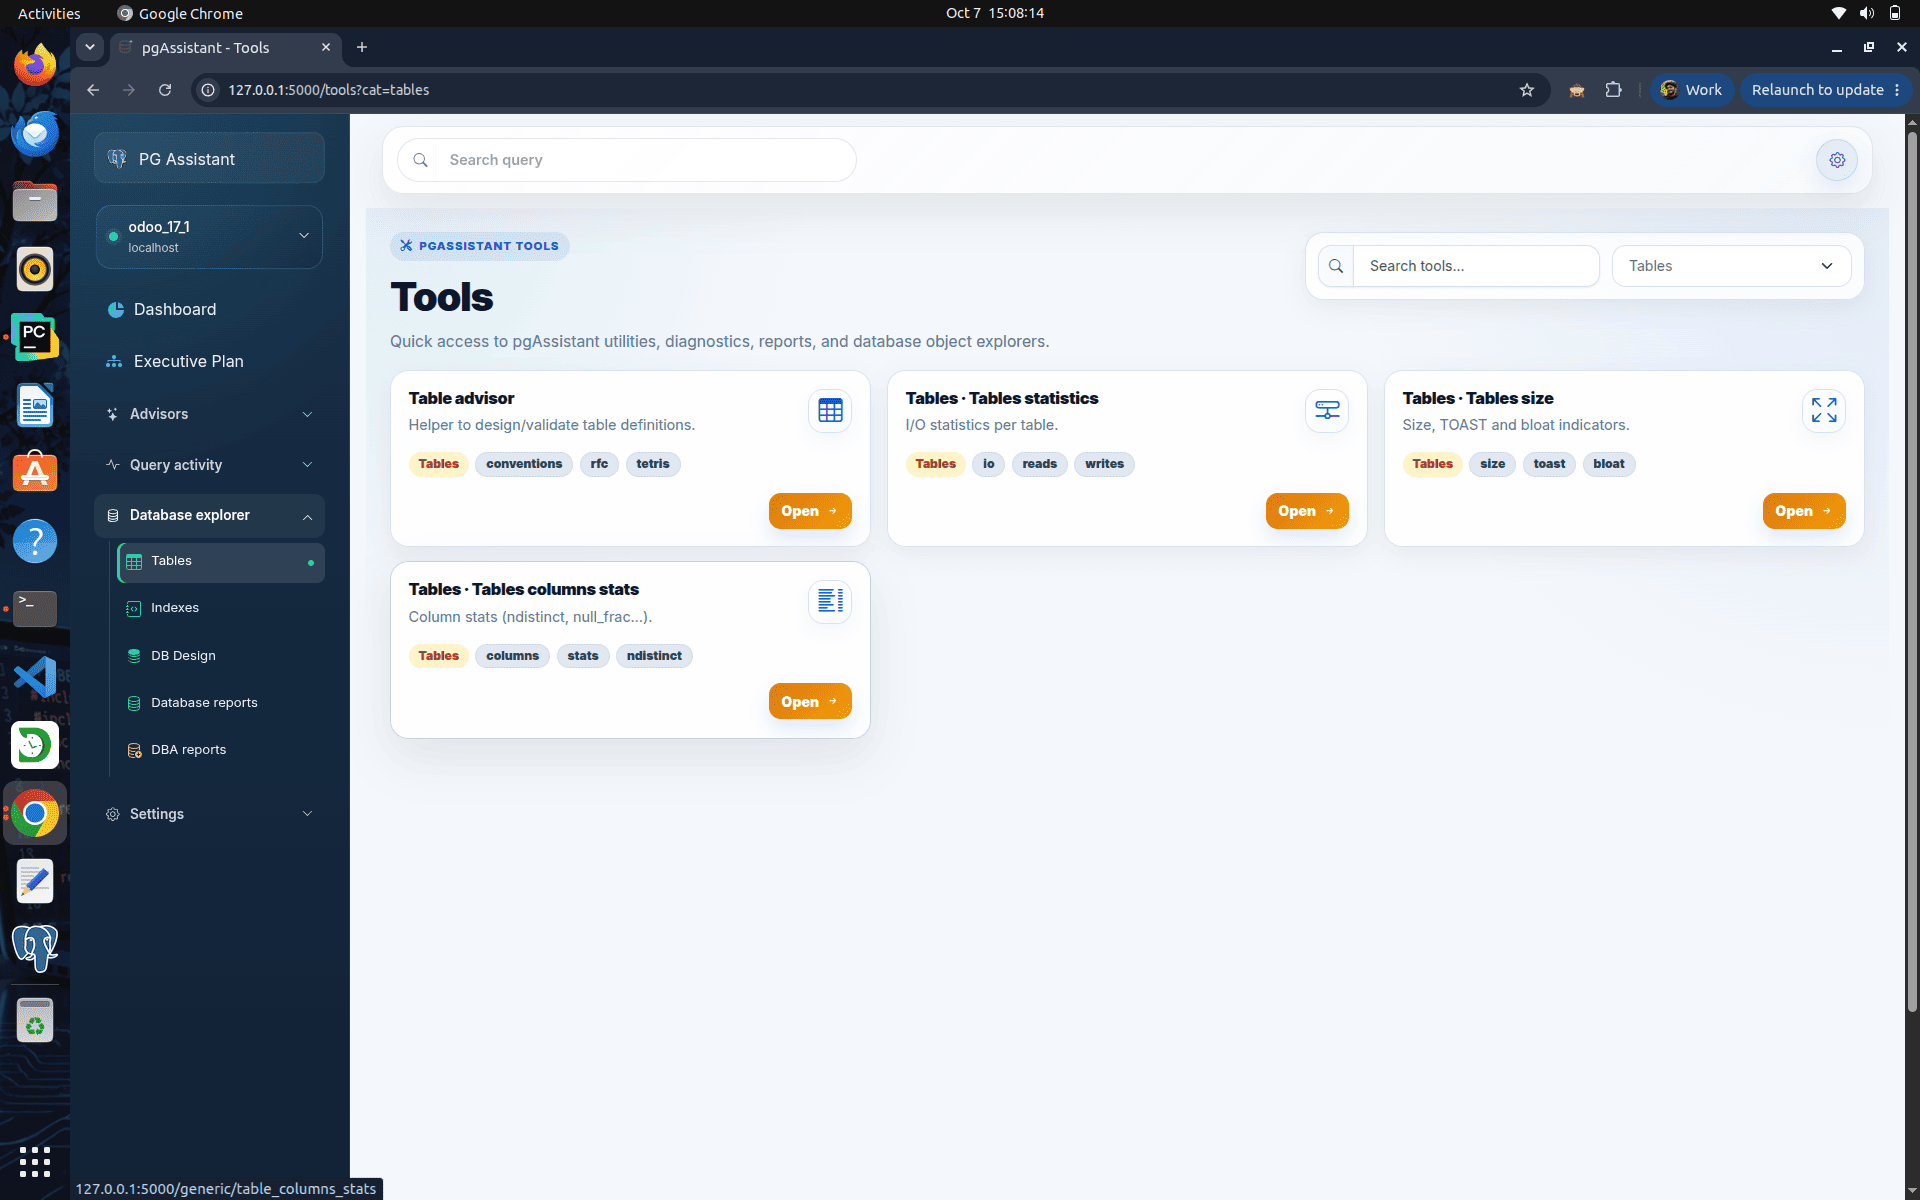
Let’s explore each option one by one.
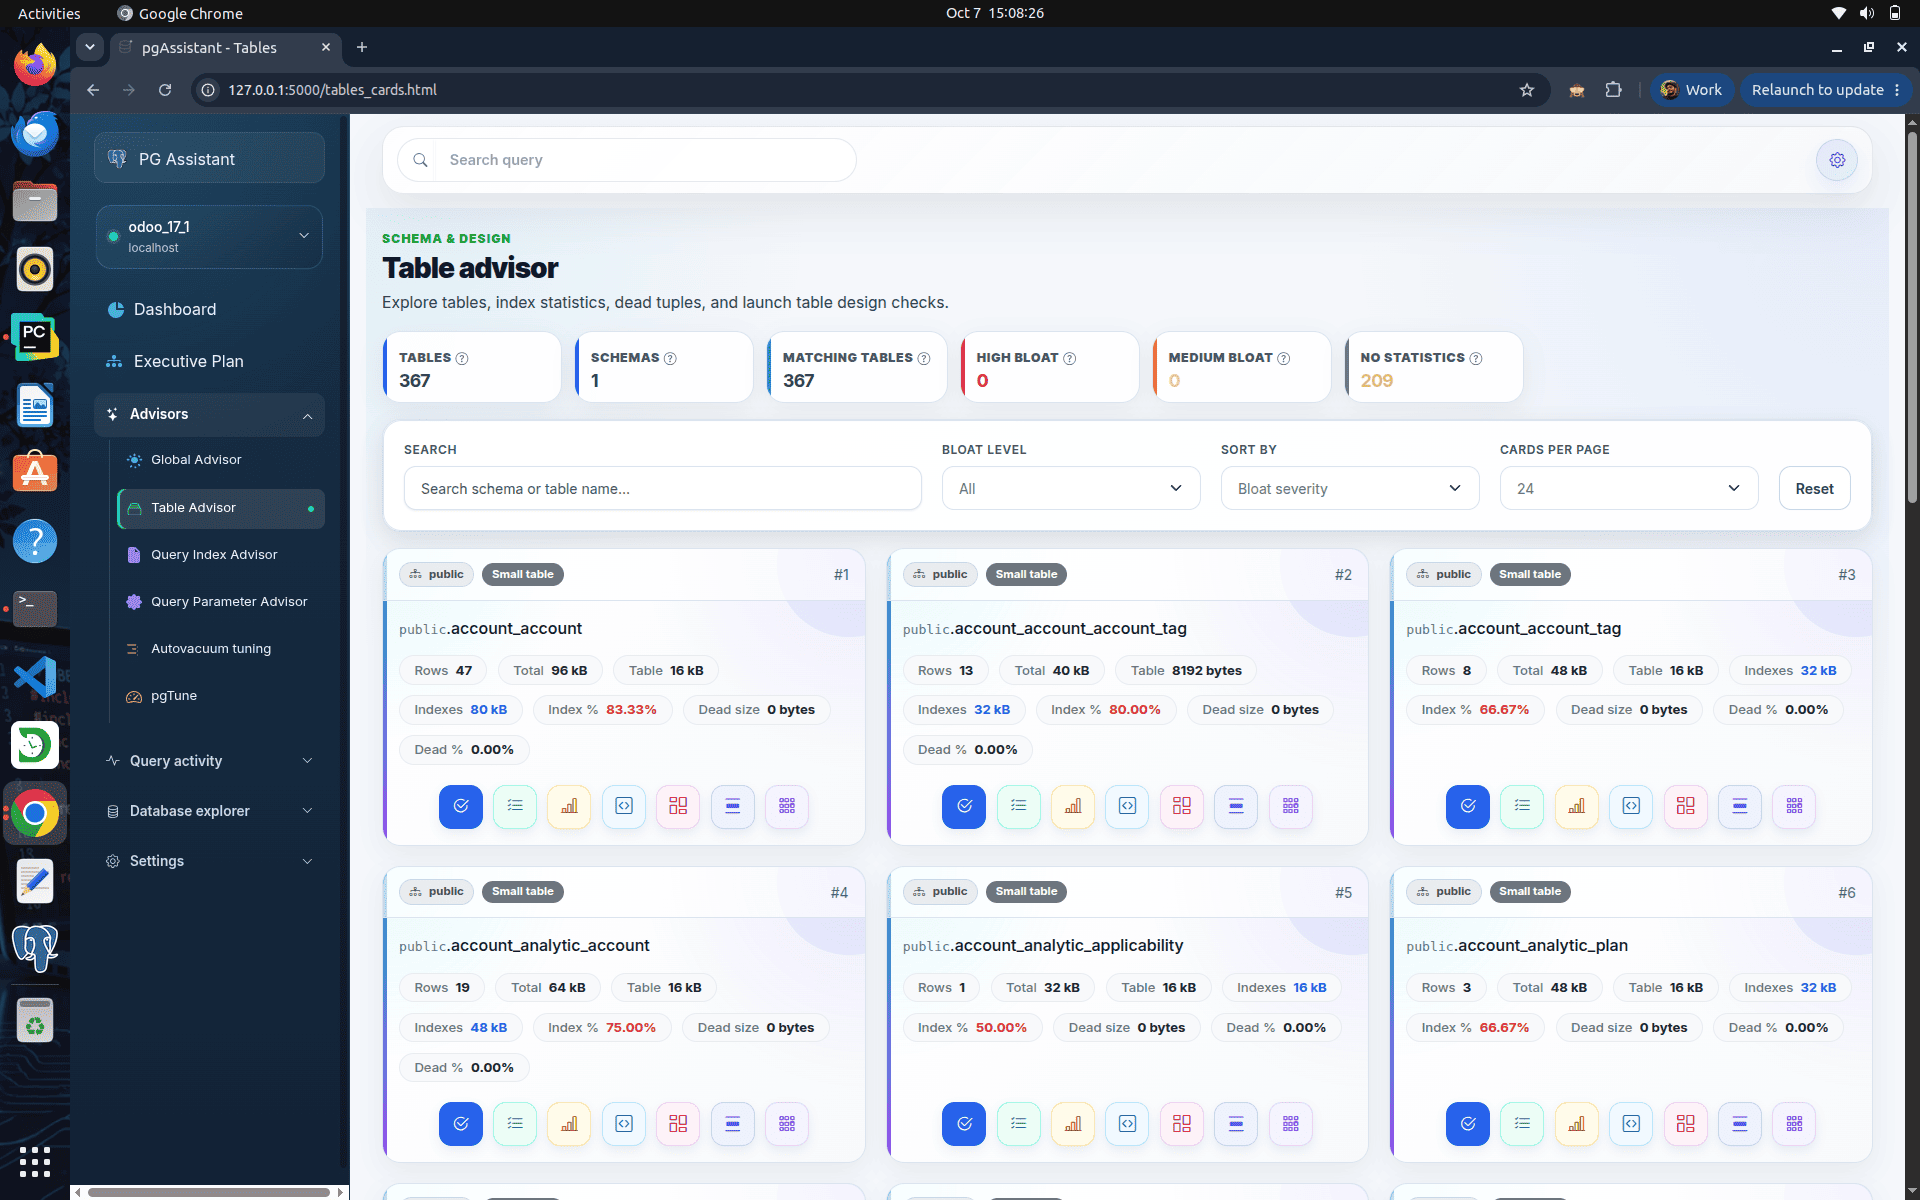
The first one is table advisor.
It includes
- Total table counts
- Total schema counts
- High bloated table counts
- Medium bloated table counts
- Total rows
- Total table size
- Total table size + index size
- Dead tuple ratio also.
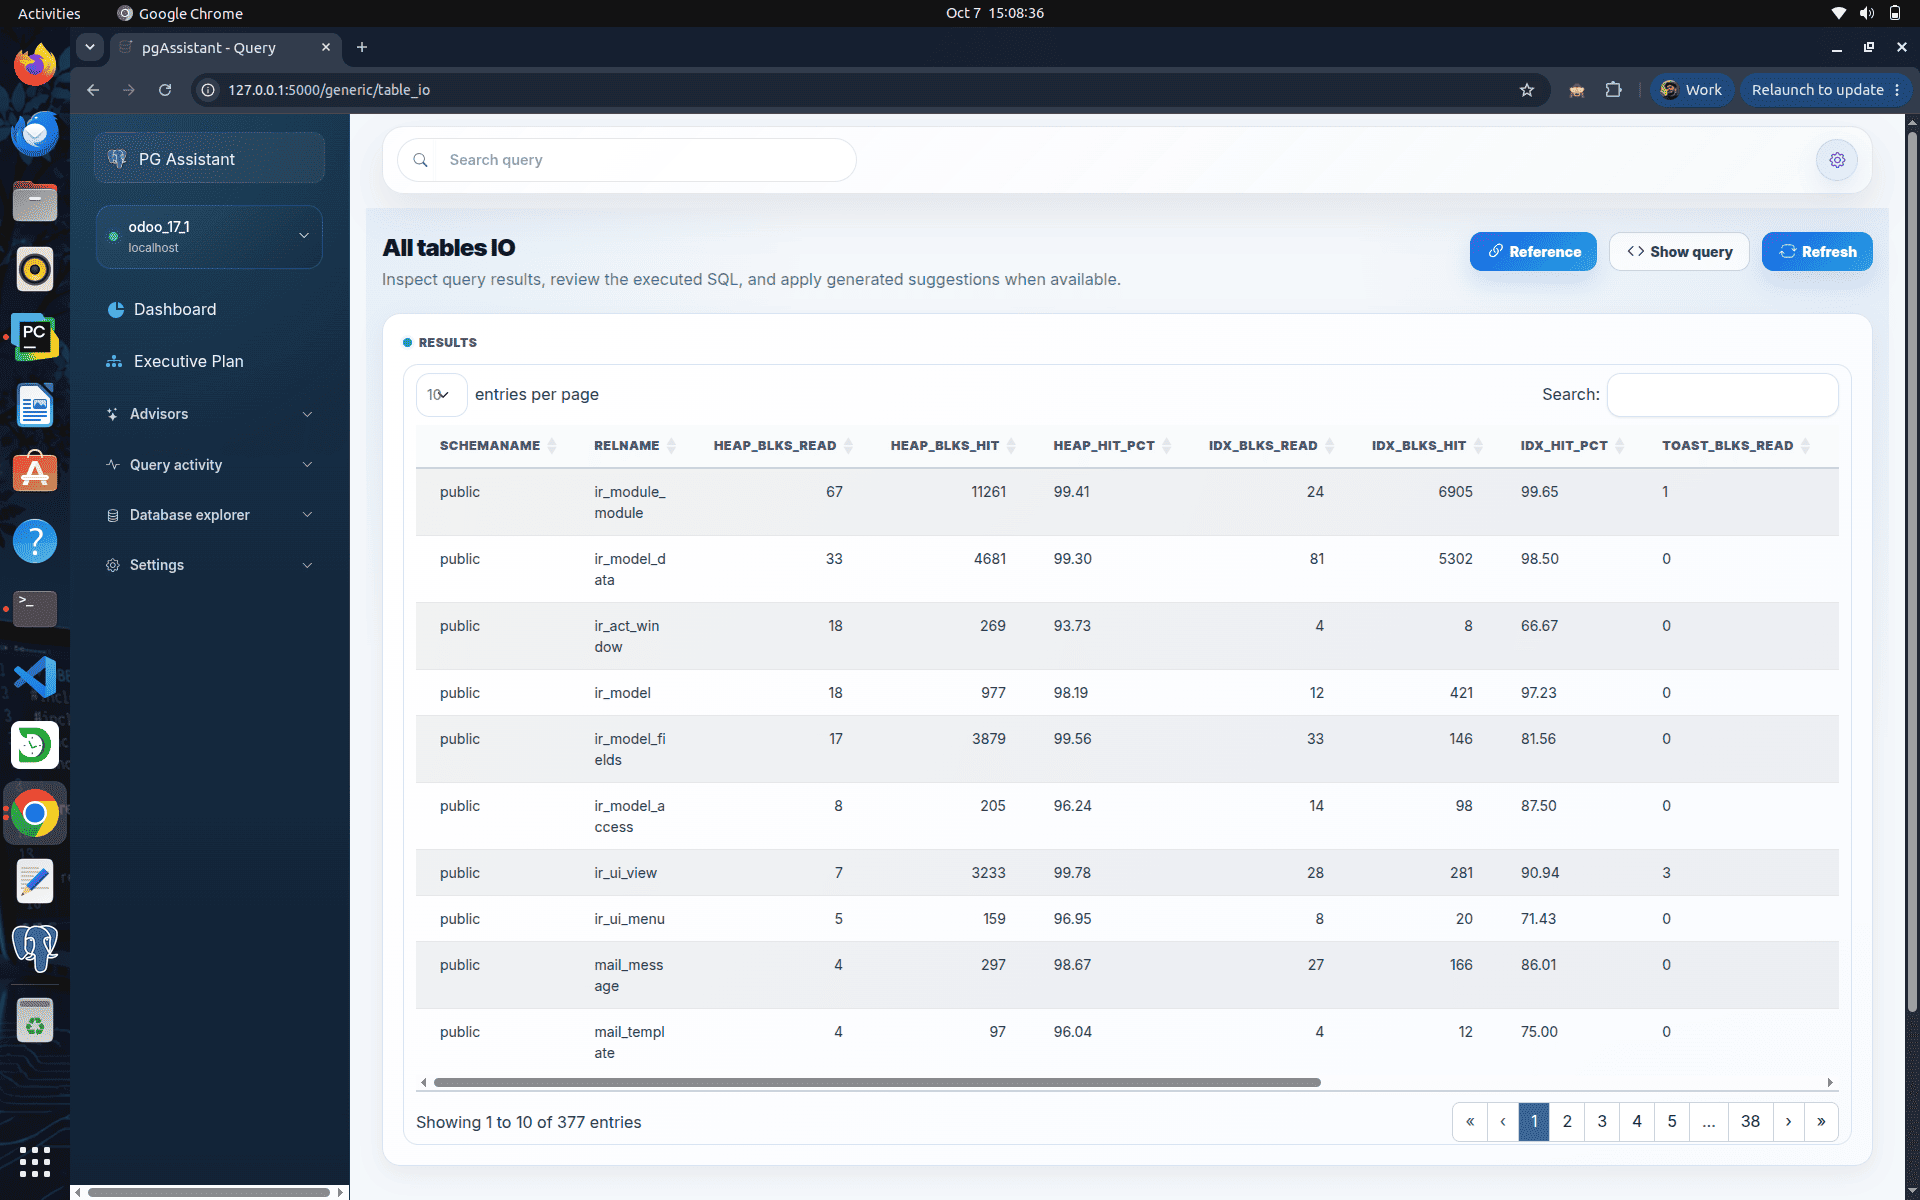
The All Tables I/O page provides detailed input/output statistics for every table in the database, helping administrators analyze table access patterns and cache efficiency.
It includes:
- Schema name and table name
- Heap blocks read from disk
- Heap blocks served from cache
- Heap cache hit percentage
- Index blocks read from disk
- Index blocks served from cache
- Index cache hit percentage
- TOAST block read statistics
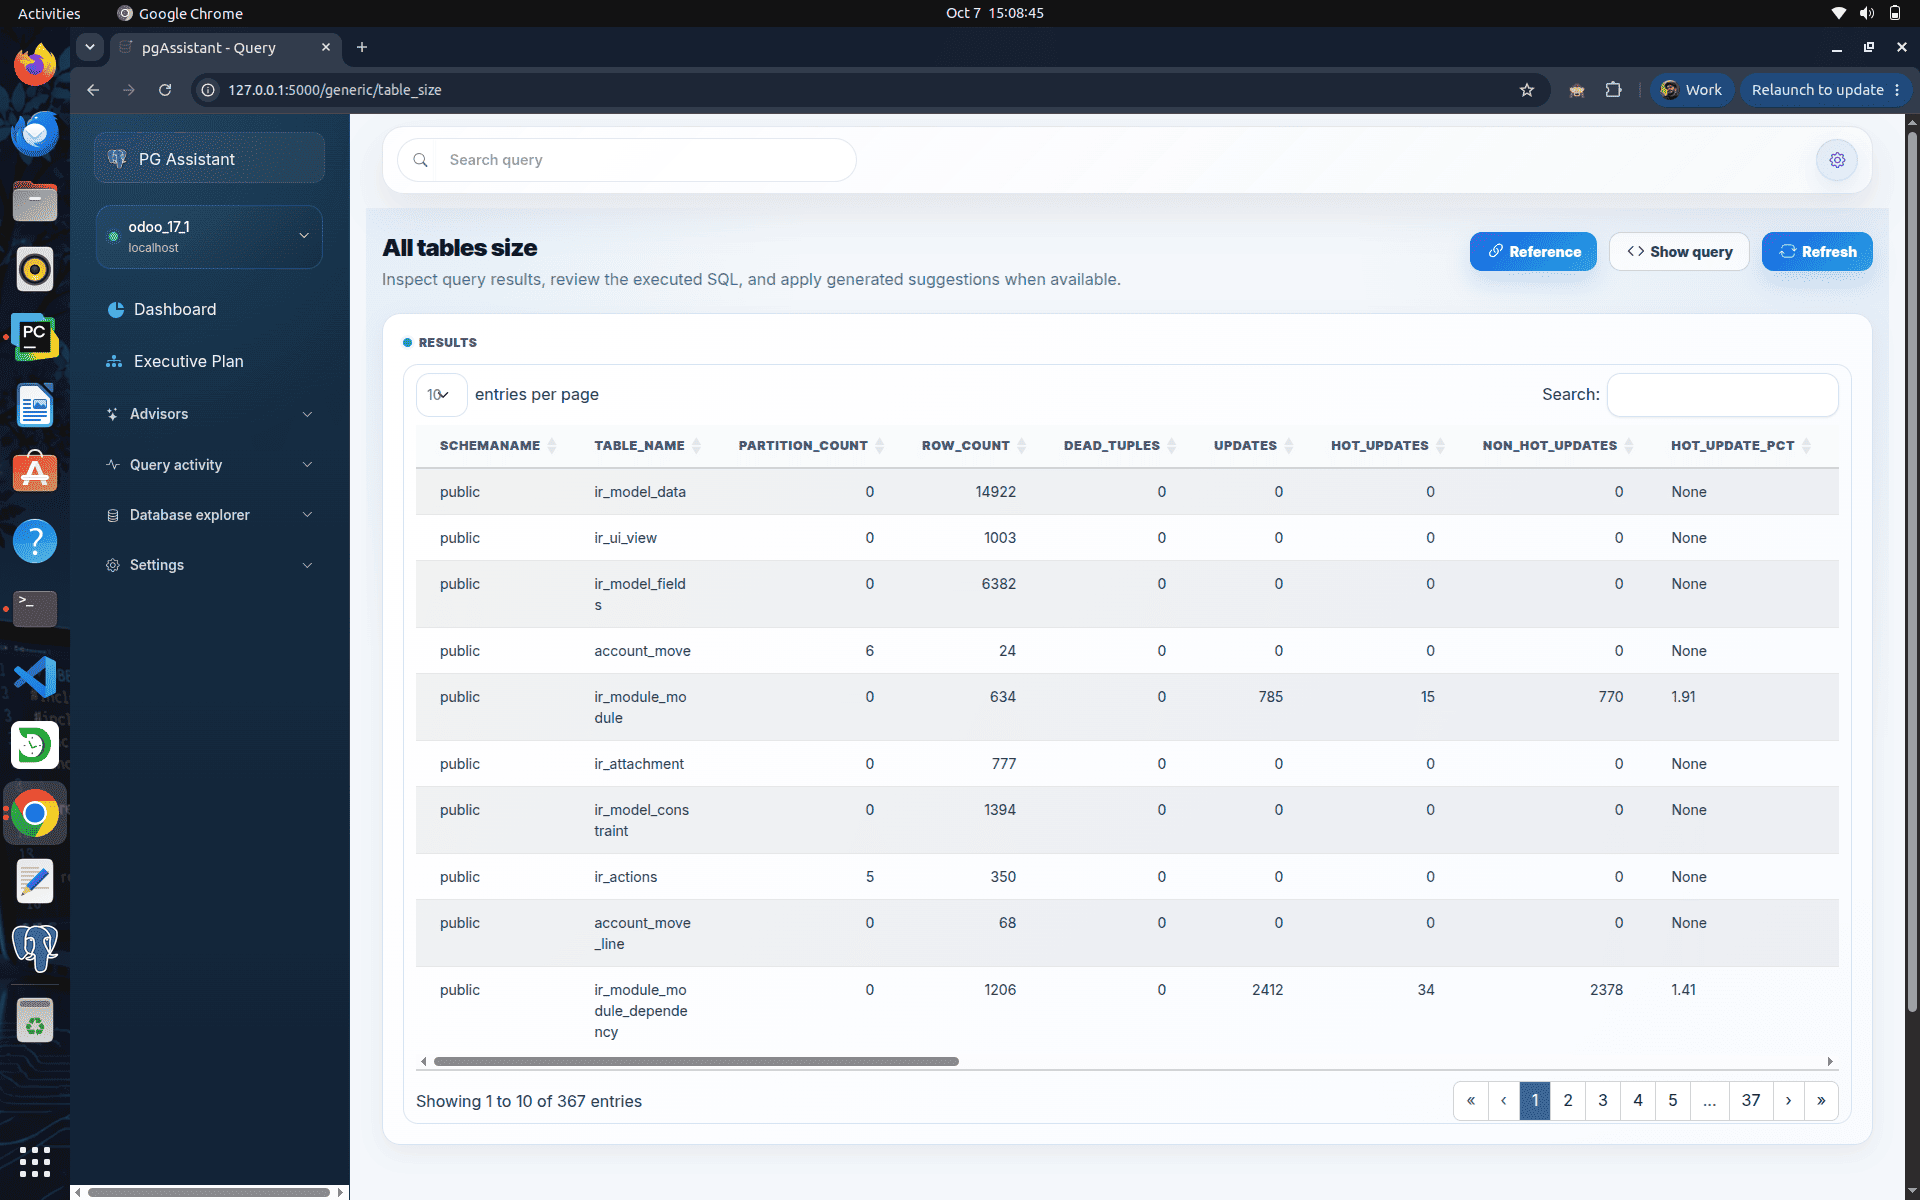
The All Tables Size page provides detailed storage and update statistics for every table in the database, helping administrators analyze table growth and maintenance activity.
It includes:
- Schema name and table name
- Partition count for each table
- Total row count
- Dead tuple count
- Number of updates performed
- HOT (HeapOnly Tuple) update count
- Non-HOT update count
- HOT update percentage
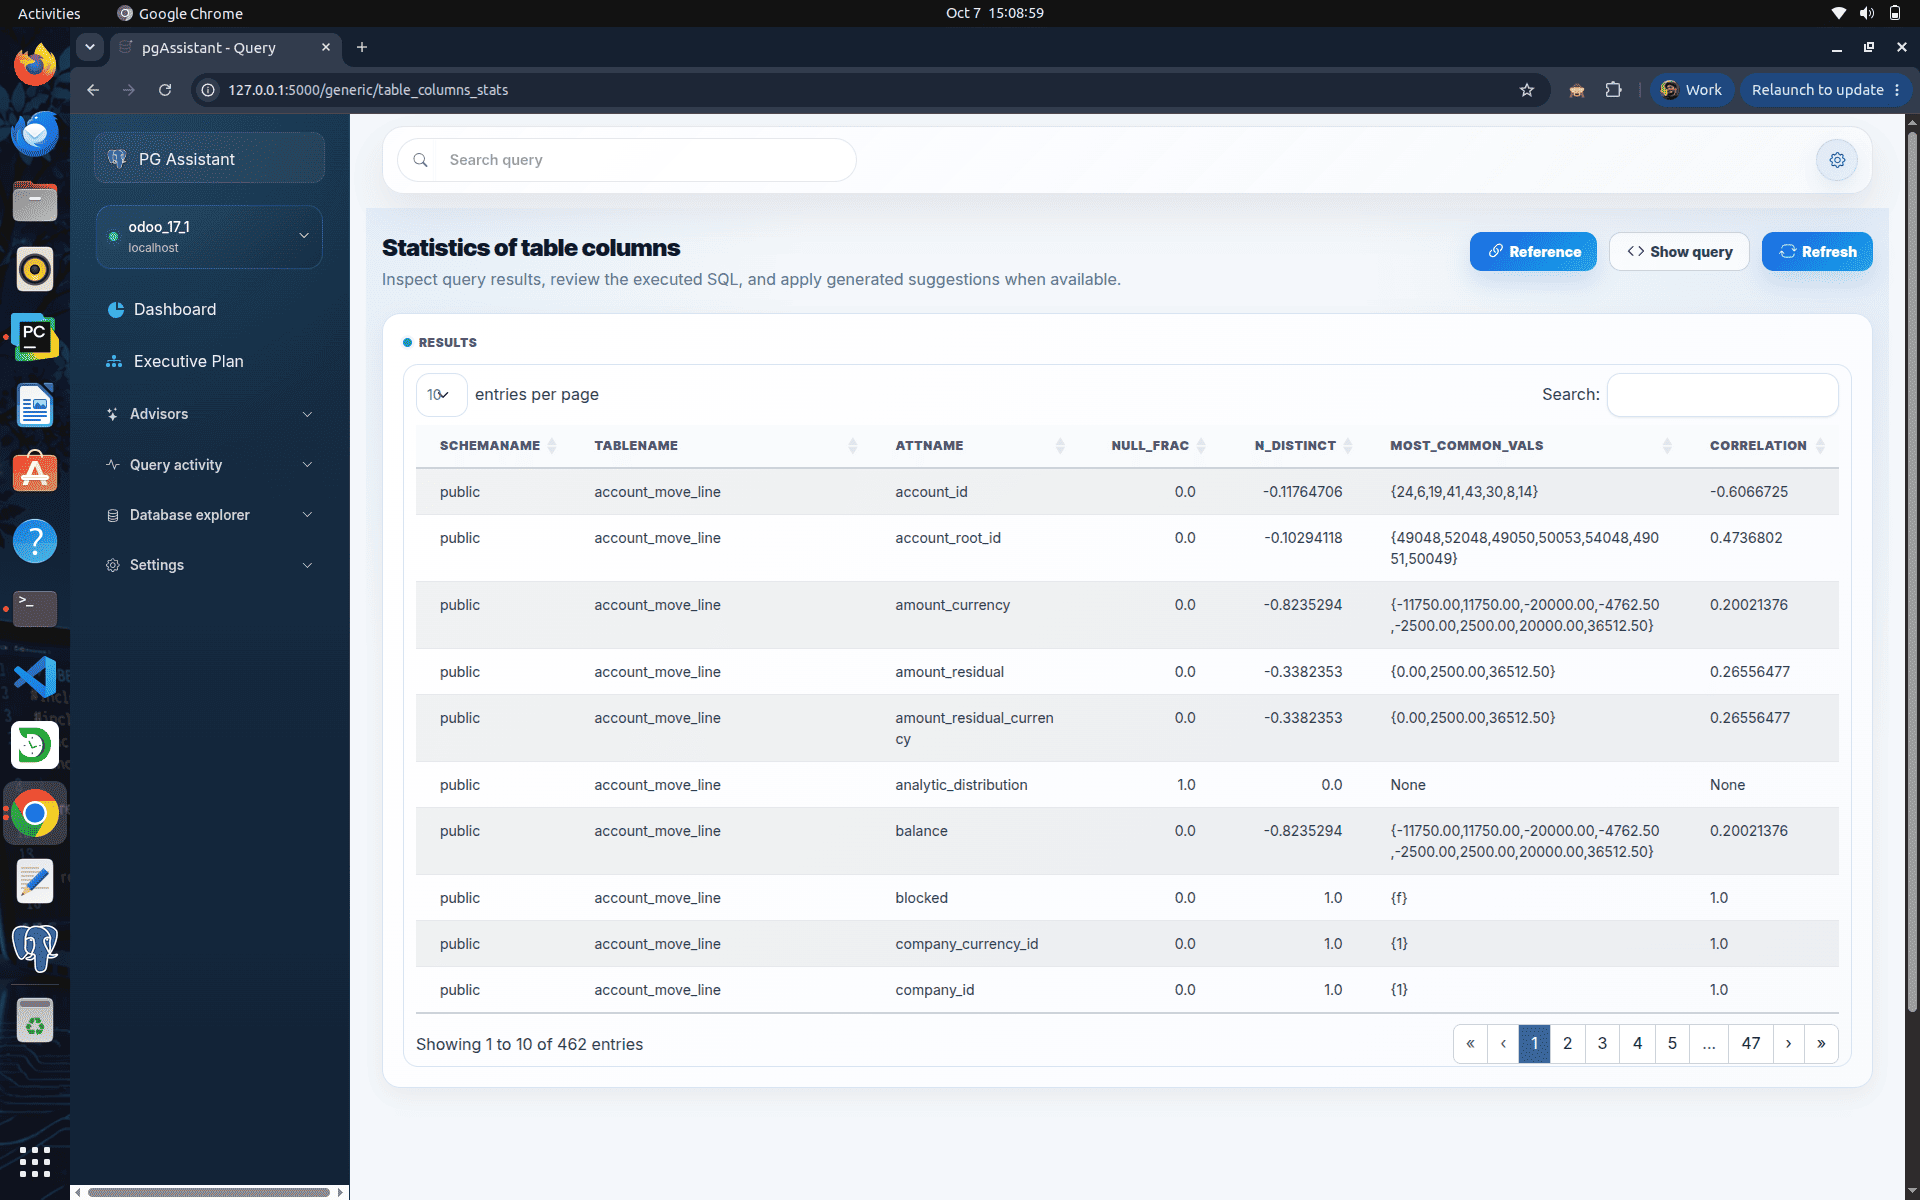
The Table Column Statistics page provides detailed statistics about individual table columns, helping administrators understand data distribution and query optimization.
It includes:
- Schema name and table name
- Column name
- NULL value fraction (NULL_FRAC)
- Number of distinct values (N_DISTINCT)
- Most common values (MCVs)
- Correlation between column values and physical row order
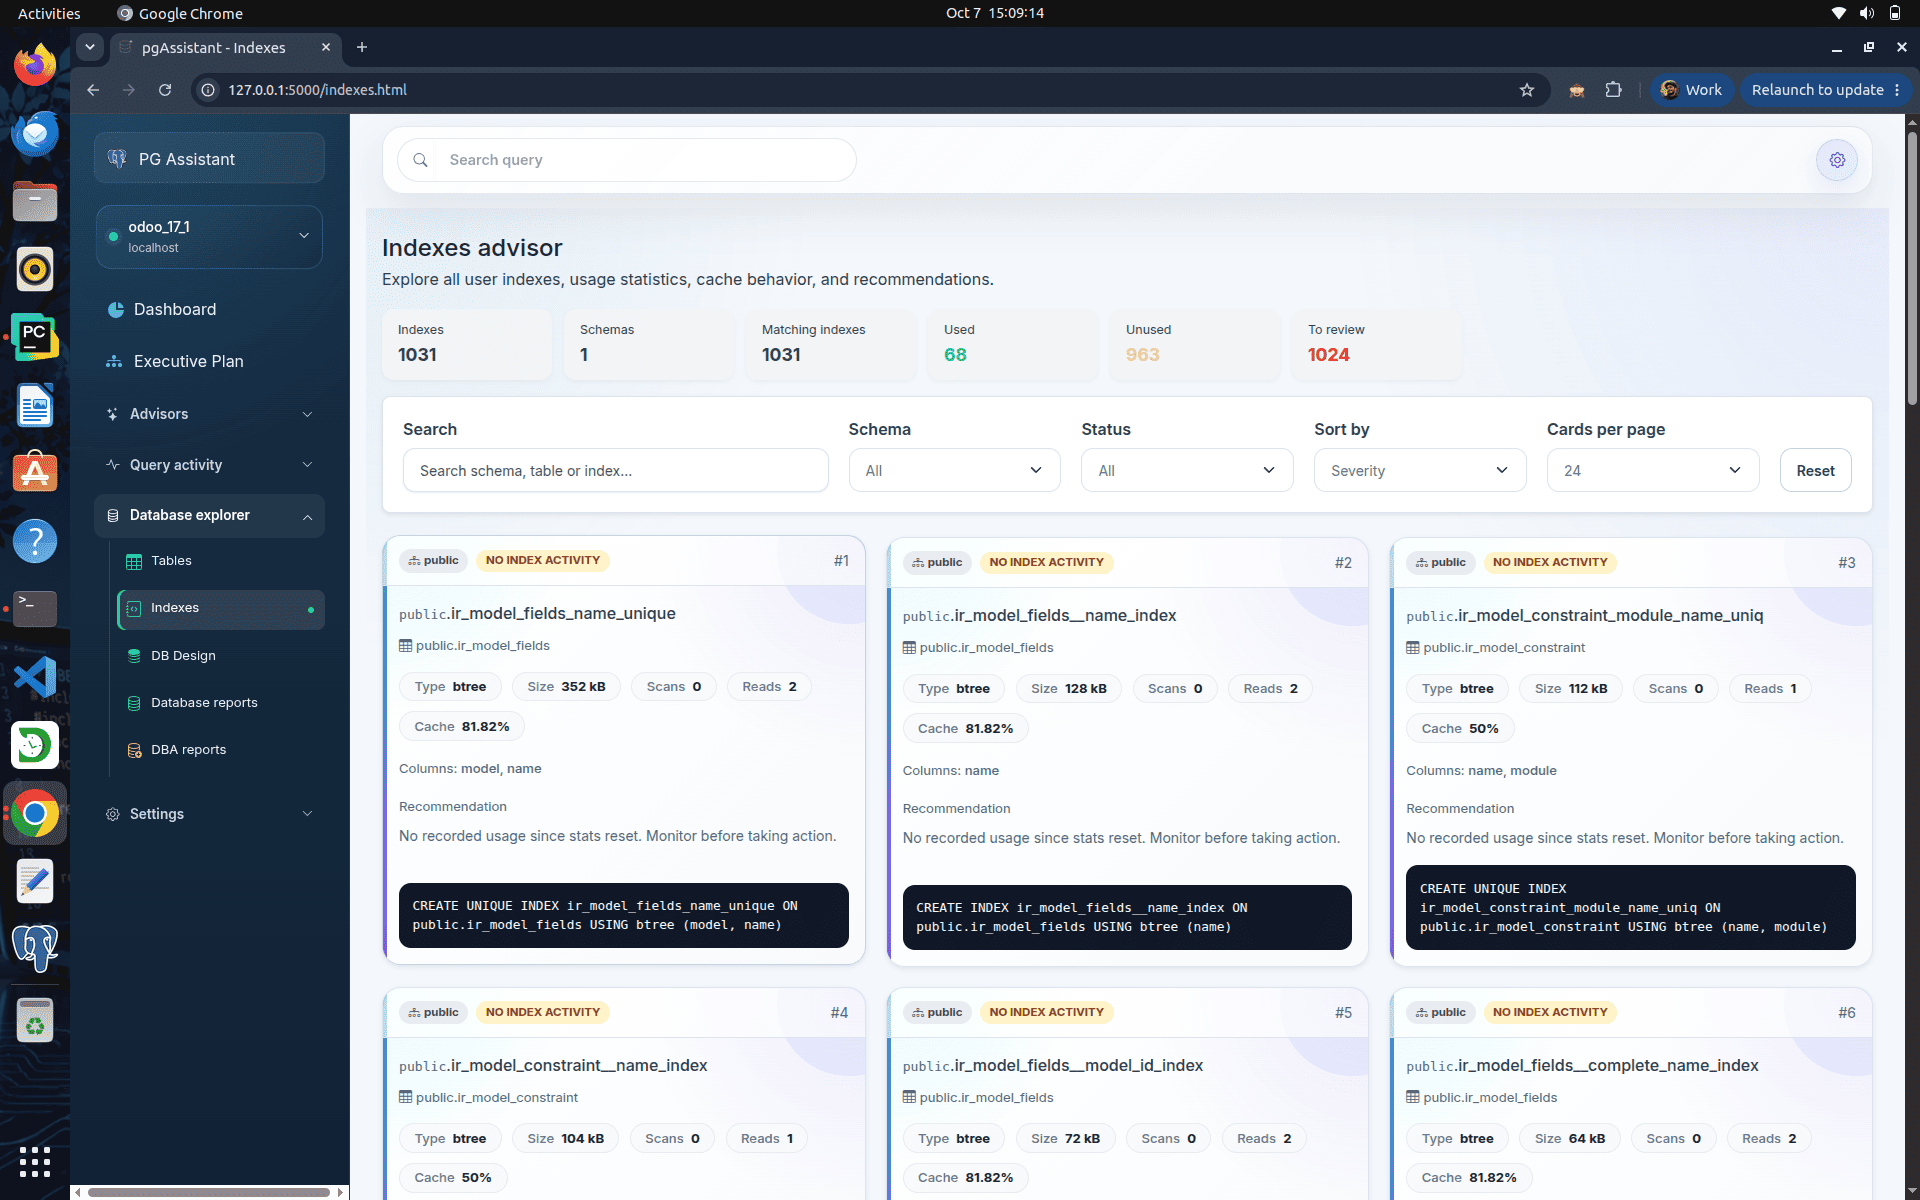
The Indexes Advisor page provides a comprehensive overview of all user-defined indexes, their usage statistics, cache performance, and optimization recommendations.
It includes:
- Total number of indexes and schemas
- Used and unused index counts
- Indexes that require review
- Search and filter options by schema, status, and severity
- Index name, associated table, and index type
- Index size, scan count, read count, and cache hit ratio
- Indexed columns and usage recommendations
- SQL definition for each index
- Helps identify unused, inefficient, or underutilized indexes for optimization
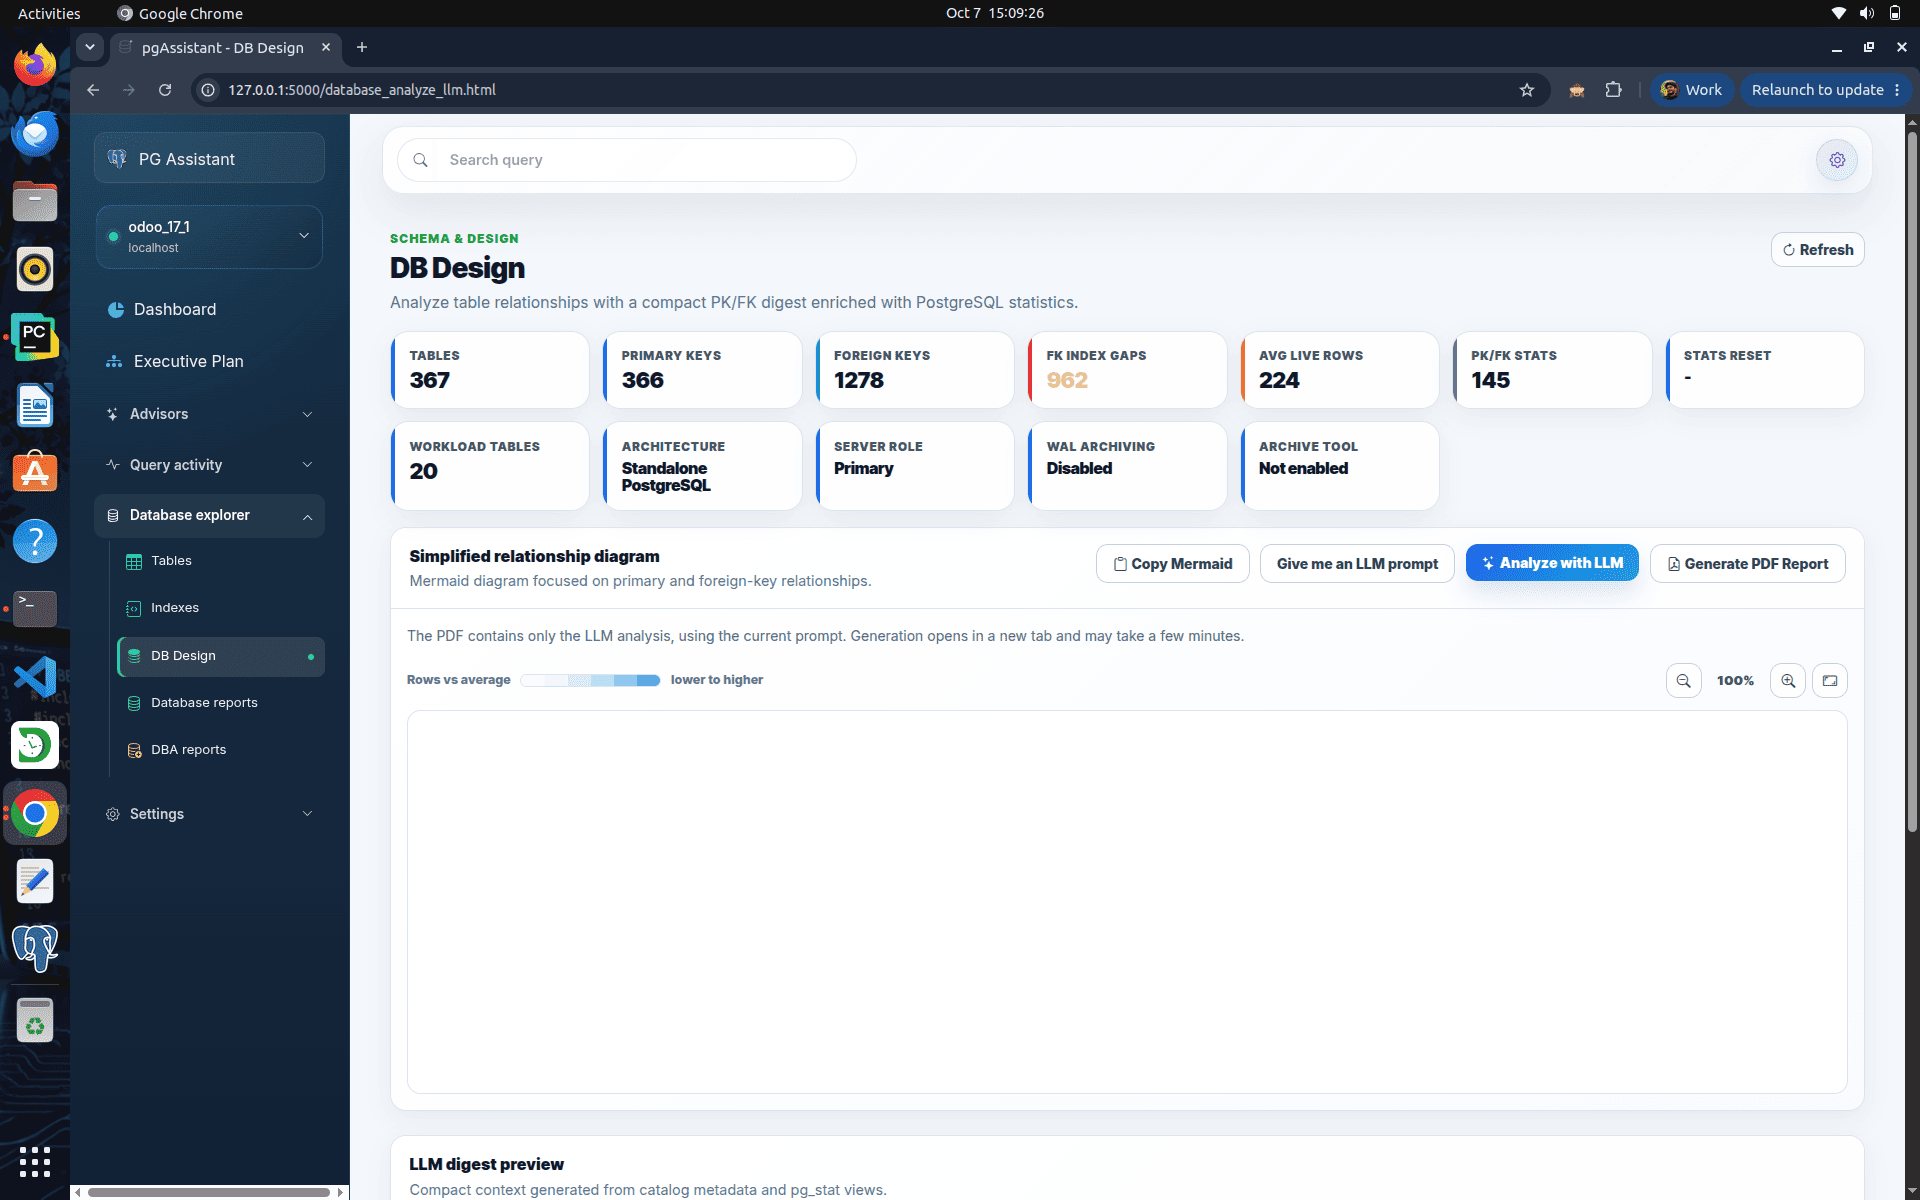
The DB Design page provides a high-level overview of the database schema and table relationships, helping administrators understand the overall database structure.
It includes:
- Total number of tables, primary keys, and foreign keys
- Foreign key index gap count
- Average live rows and PK/FK statistics
- Database architecture, server role, and wal archiving status
- Simplified relationship diagram showing primary key and foreign key relationships
- Options to analyze the schema using an llm, copy the Mermaid diagram, and generate a PDF report
- LLM digest preview with schema analysis and design insights
- Helps identify relationship patterns, missing indexes, and schema optimization opportunities
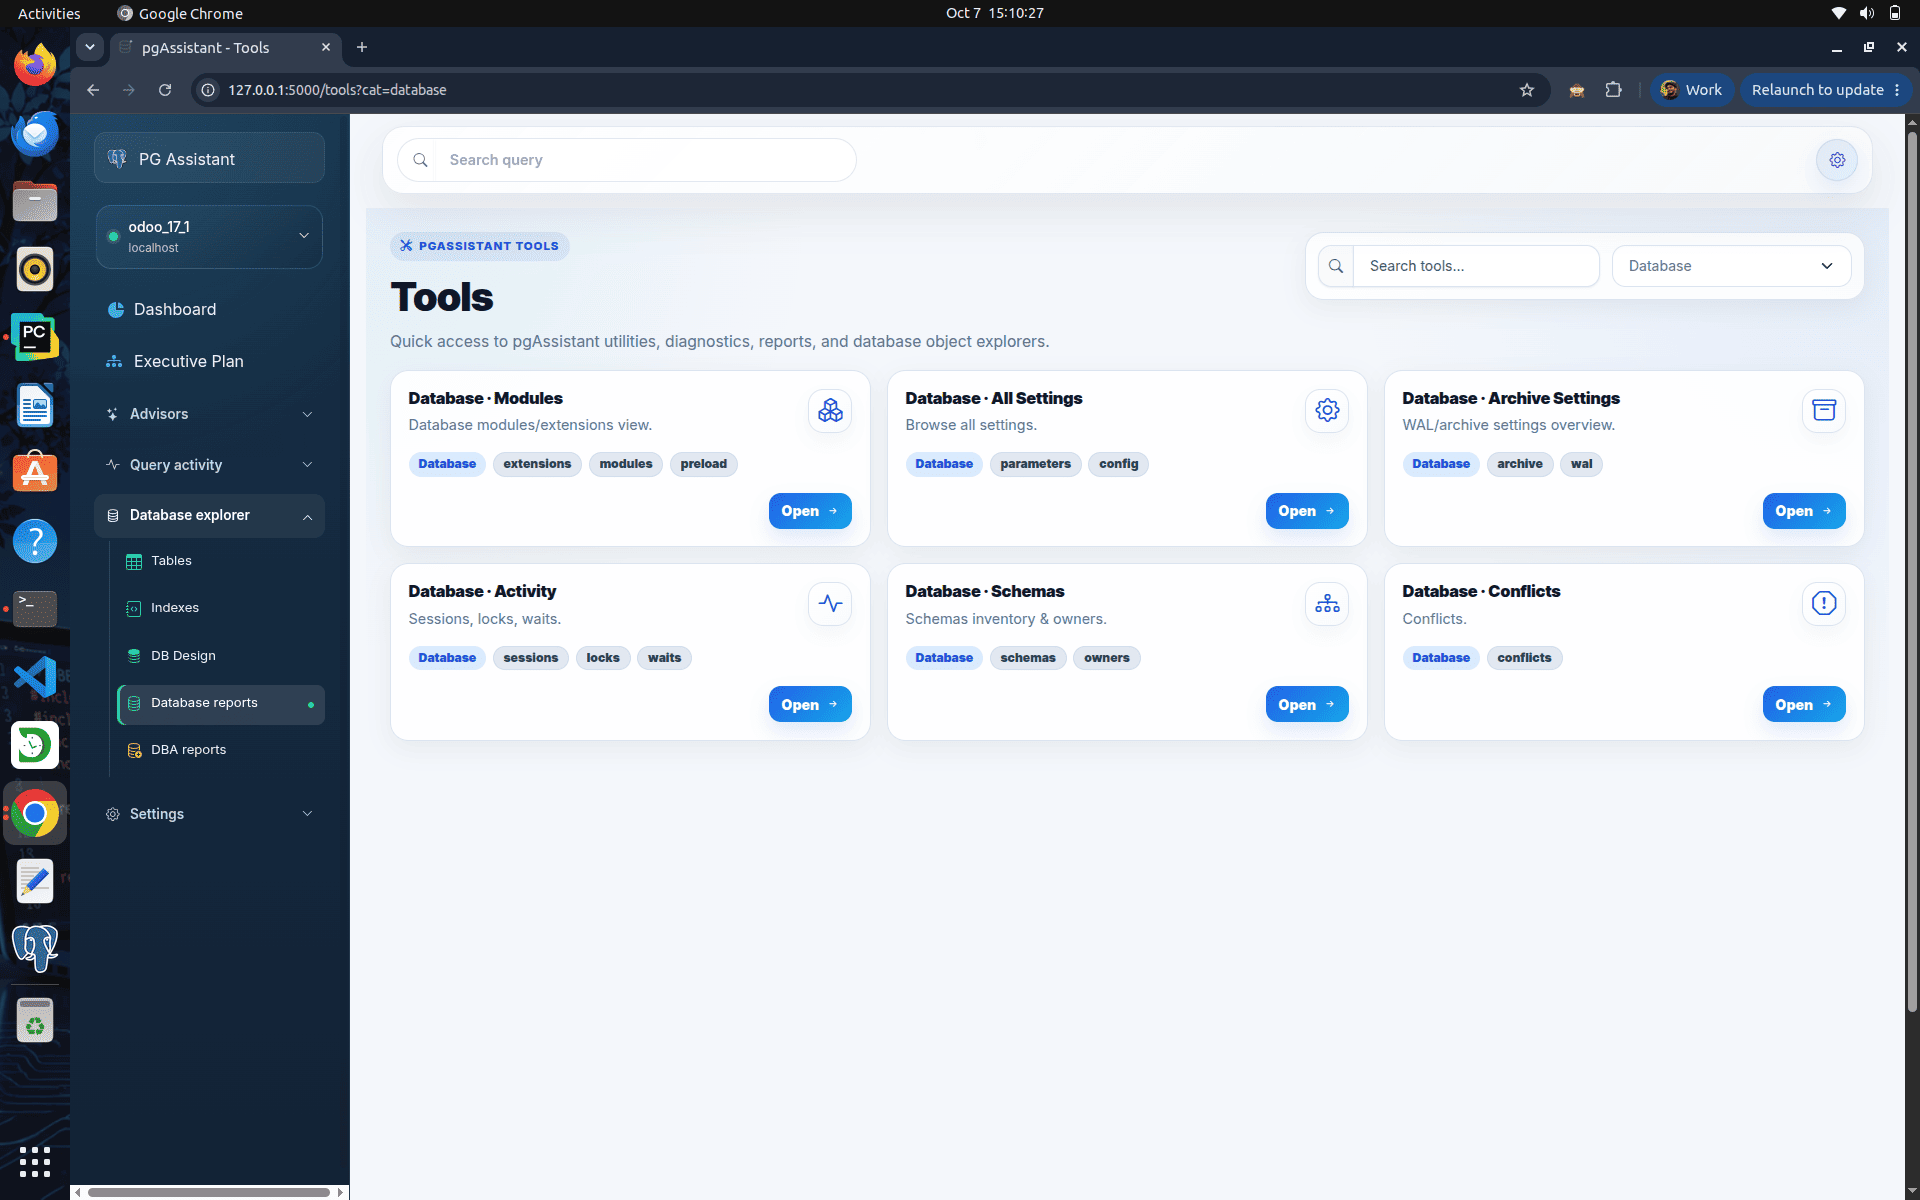
The Database Reports page provides centralized access to PostgreSQL utilities, diagnostics, reports, and database administration tools.
It includes:
- Quick access to database modules and extensions
- Database configuration and parameter settings
- WAL and archive configuration details
- Database activity, including sessions, locks, and waits
- Schema and database object information
- Conflict monitoring and diagnostics
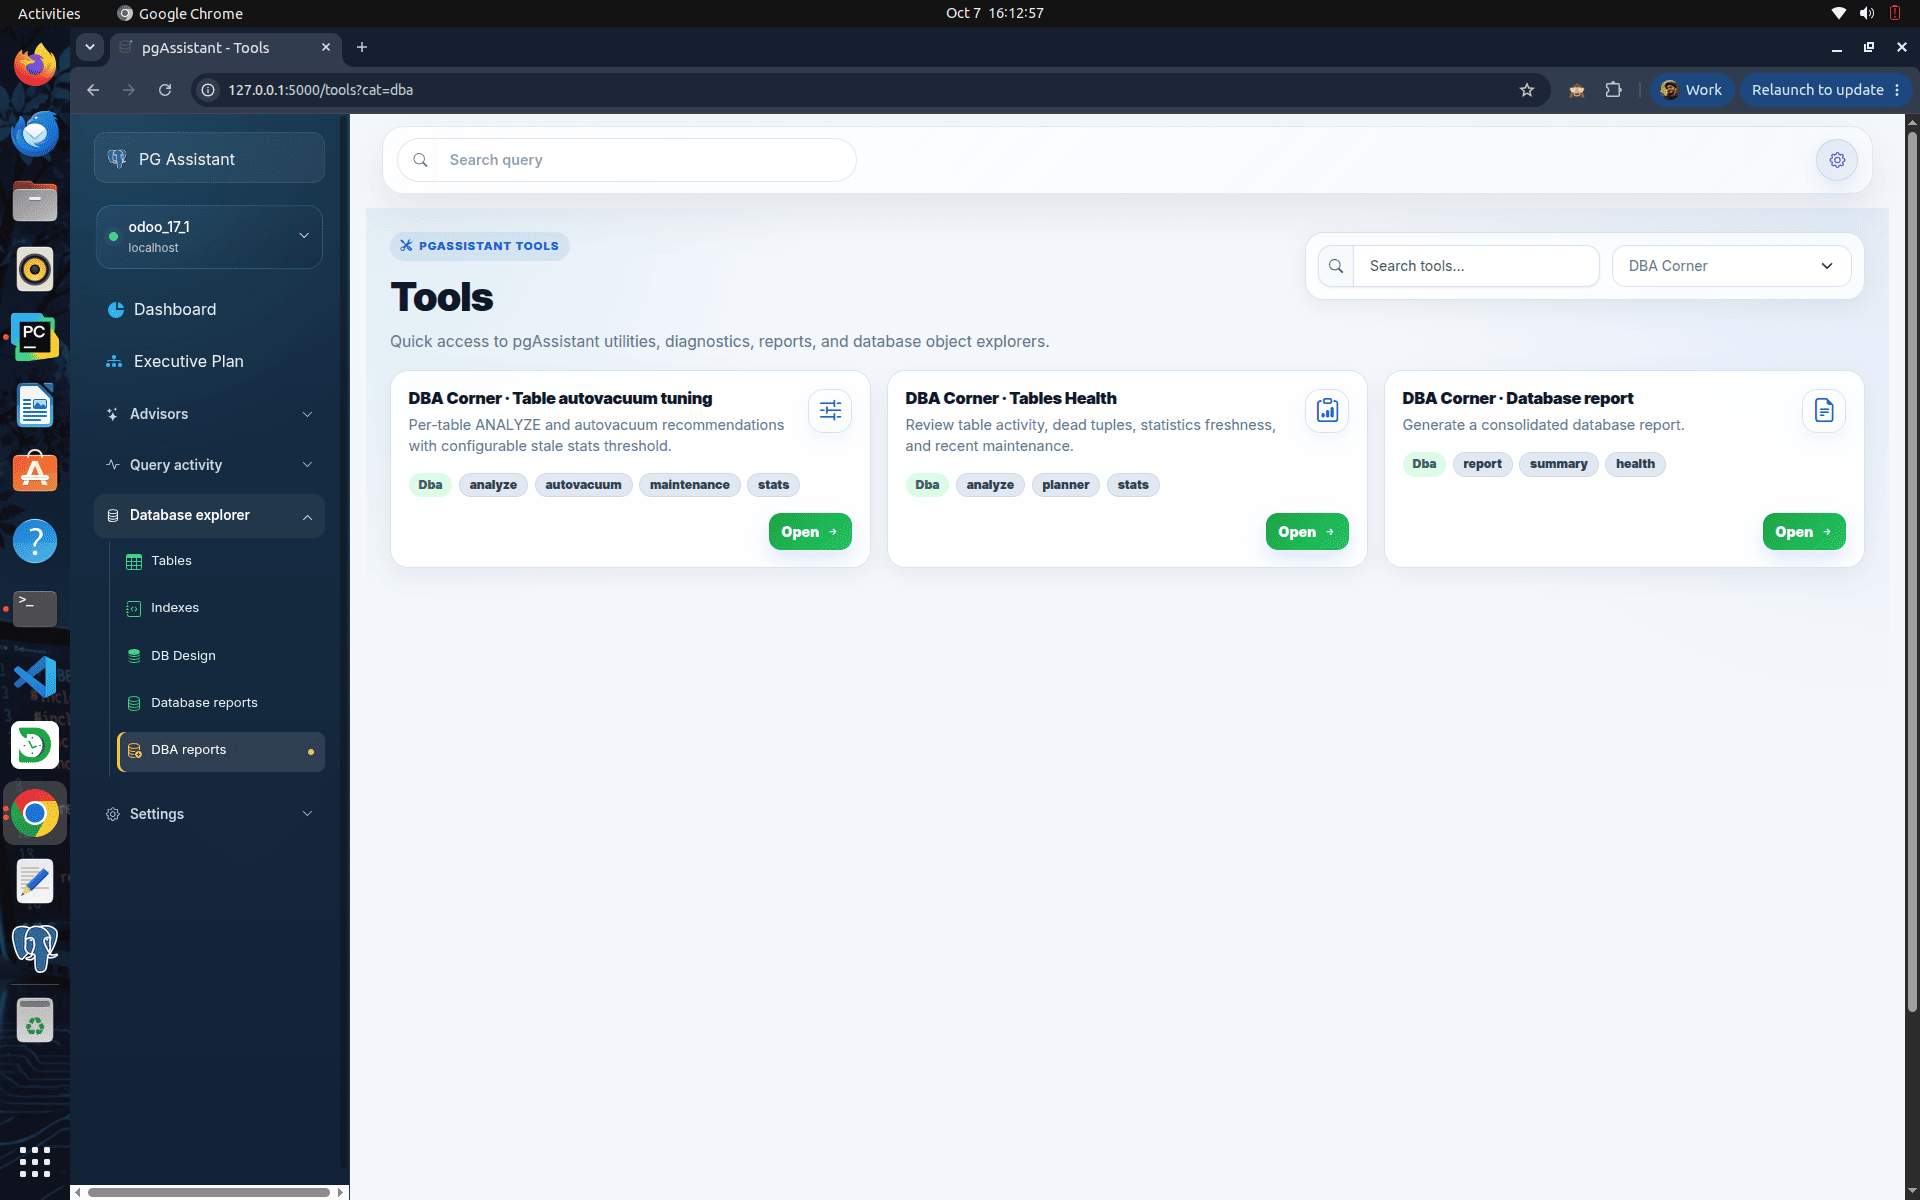
The DBA Reports page provides quick access to DBA-focused tools for monitoring database health, maintenance, and reporting.
It includes:
- Table of autovacuum tuning recommendations
- Table health analysis, including dead tuples and statistics freshness
- Consolidated database health and summary reports
- Database maintenance and ANALYZE recommendations
- Planner and statistics-related insights
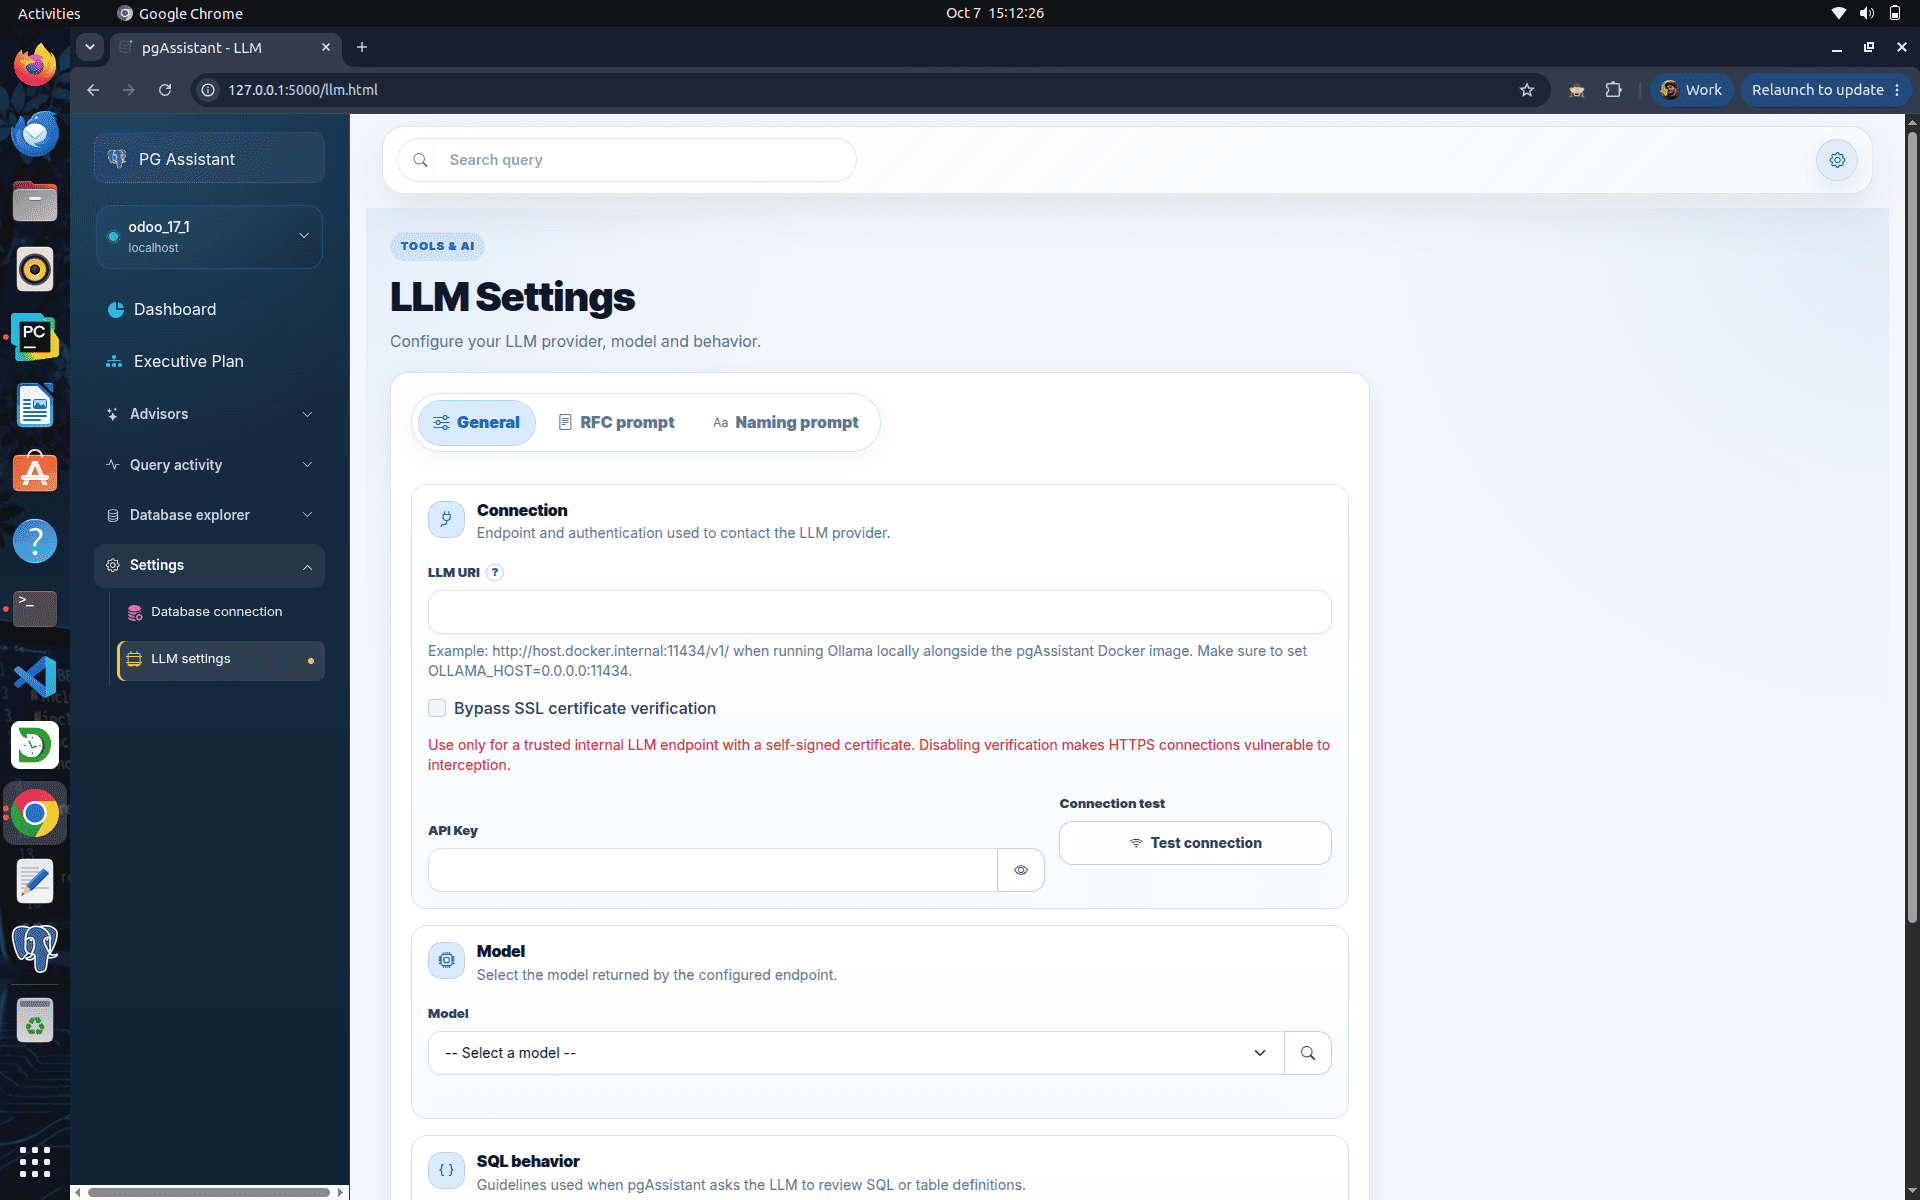
The LLM Settings page allows users to configure and customize the AI model used by pgAssistant for sql analysis, recommendations, and AI-powered features.
pgAssistant provides a comprehensive environment for monitoring, analyzing, and maintaining postgtres databases. From workload analysis and query statistics to index recommendations, autovacuum tuning, schema exploration, database reports, and maintenance utilities, it brings together the information needed for day-to-day database administration in a single place.
By using the dashboards, advisors, reporting tools, and database explorers covered in this guide, administrators can quickly identify performance issues, monitor database health, optimize storage and query execution, and make informed configuration decisions. Whether you are managing a development database or a production environment, pgAssistant offers a practical way to simplify postgres monitoring and improve overall database performance.