The Odoo ERP software provides equal prominence to generate reports in various measures as it gives importance to conduct various operations and helps to manage the entire business. The Odoo ERP software provides a good platform to make reporting easier and simple. For generating reports and viewing the details, Odoo provides a separate section where you can generate, view, and customize various reports on the basis of your needs. The Odoo reporting aspect gives an insight into a new path of managing data and it will be capable of generating complex reports within a few seconds.
Each module of Odoo includes a reporting subsection that is intended to generate reports associated with that module. The platform provides you the provision to create analytical and quantitative reports and the graphical representation of data will give more visual effect and experience. The graphical representations are suitable for presentations and this will provide more visual impact on viewers. You can also create and customize Pivot tables within seconds. The reporting aspects of your activities can be used not only for the management of day-to-day operations but also it is suitable for creating long-term plans and decisions.
In this blog, let us have a close look at the reporting aspects of the Odoo Live Chat module.
The Odoo Live chat reporting section provides you a detailed analysis of each of its operations and this can be accessed from the reporting tab of the Live Chat module.
Under the Reporting tab of the Odoo Live Chat module, you have various menus such as Dashboard, Sessions History, Session Statistics, Operator Analysis, and Customer ratings. Let's discuss each of these in detail.
Dashboard
The Dashboard window available under the Report tab of the Odoo Live Chat module will provide you with an overview of all the operations conducted on the Live Chat platform. The image of the Dashboard window is depicted below.
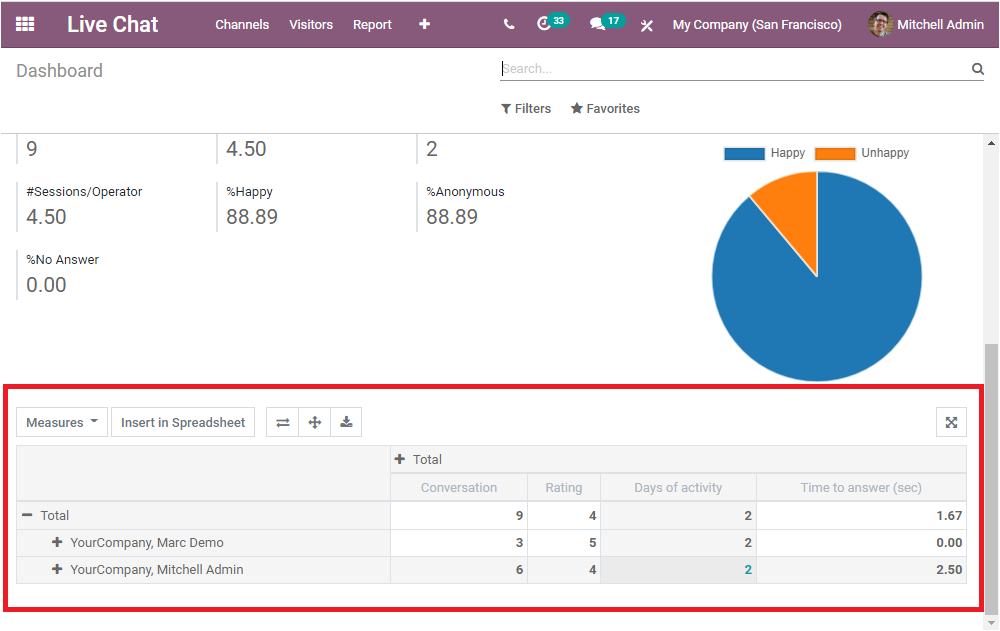
Here in the Dashboard window, Odoo offers a good platform to represent the data in both graphical and tabular format. That means you can view the data in both graphical view and pivot view. The graphical representation of the data is displayed in the above image and the pivot table can be viewed at the bottom of the window as highlighted in the below screenshot.
First, we can discuss the graphical view of the Dashboard window and the other related data provided in the window.
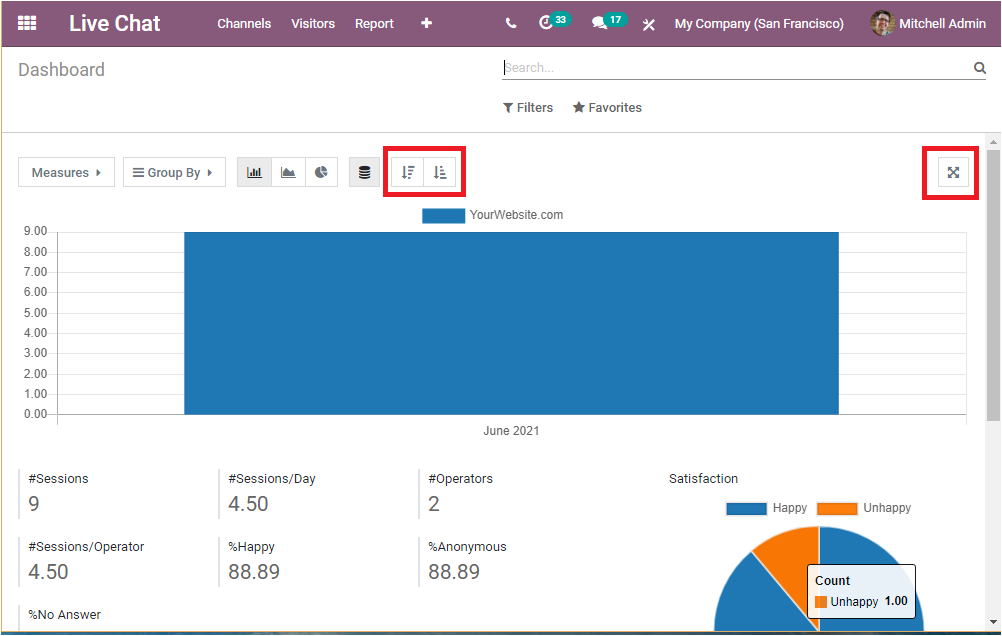
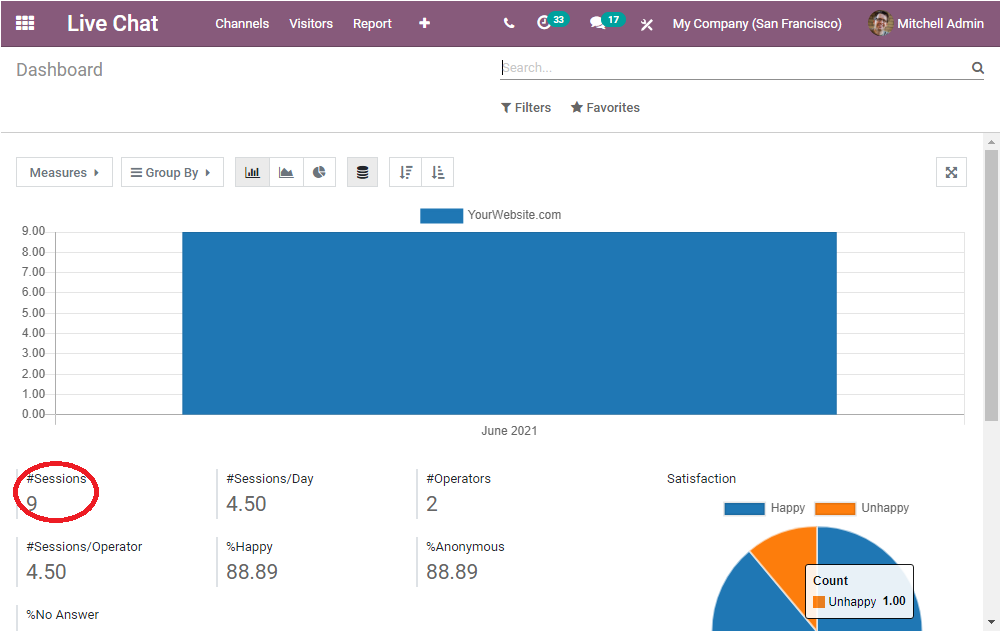
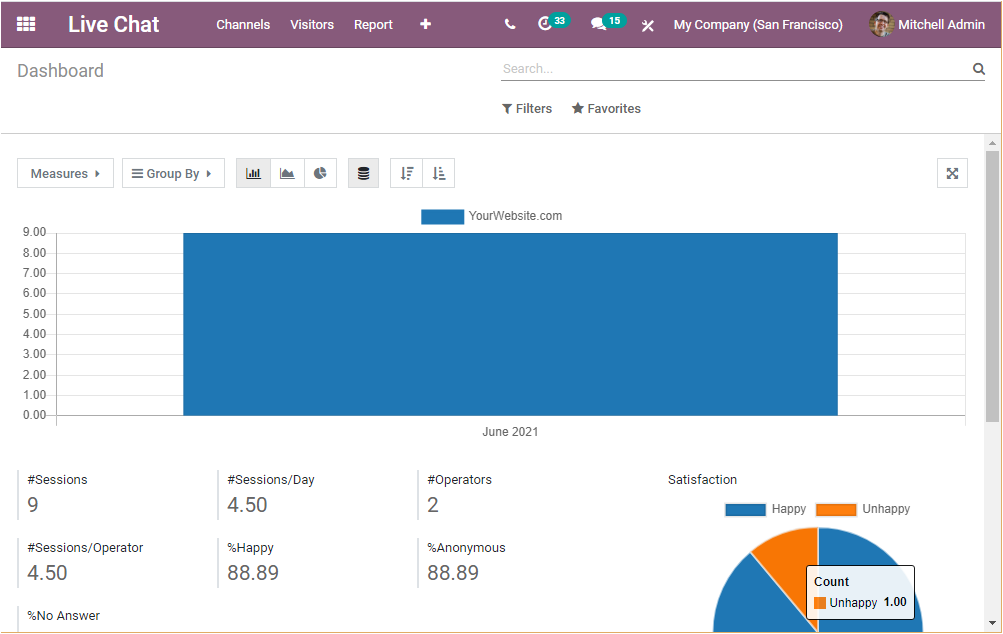
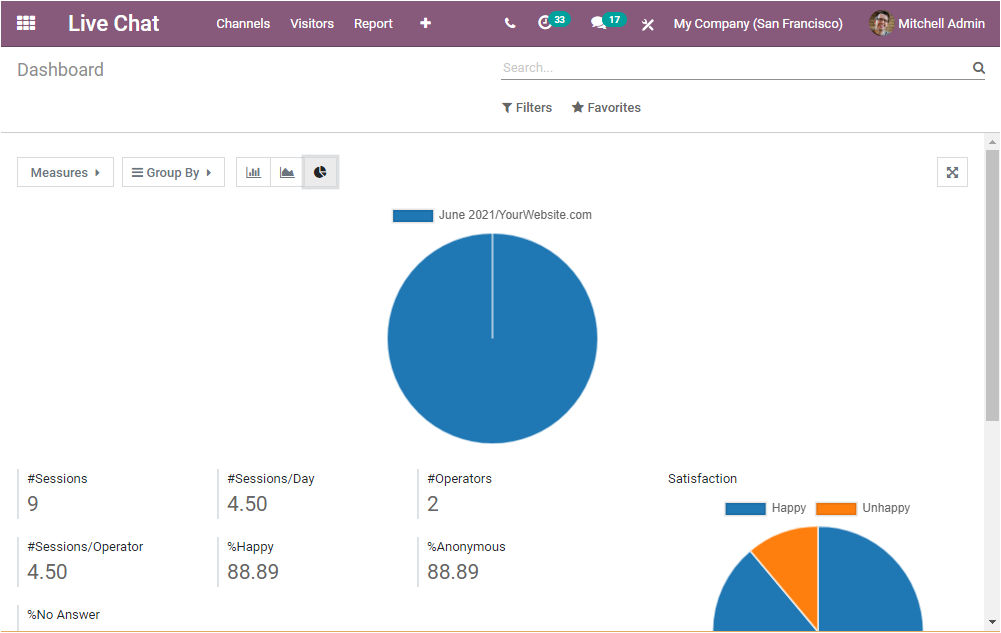
In the Dashboard window, you can view the statistical data of your live chat channel and all the details about the visitors and the session. Here you have the provision to view how many sessions are attended on your website in graphical representation by clicking on the magnifying glass icon available under the session menu as shown in the below image.
Here in this report, you can view nine sessions attended. Then you can view how many sessions are there per day, and the number of operators. Similarly, the number of Sessions per operator, percentage of Happy customers, percent of Anonymous customers, and the percentage of No Answers. In addition, the satisfaction count represented in the window can be viewed in a Pie diagram.
The graphical representation of data can be viewed in different views such as Bar charts, Pie charts, and Line charts. We have already familiarized ourselves with the bar chart ( the image depicted above). The Pie chart representation of the data is displayed below.
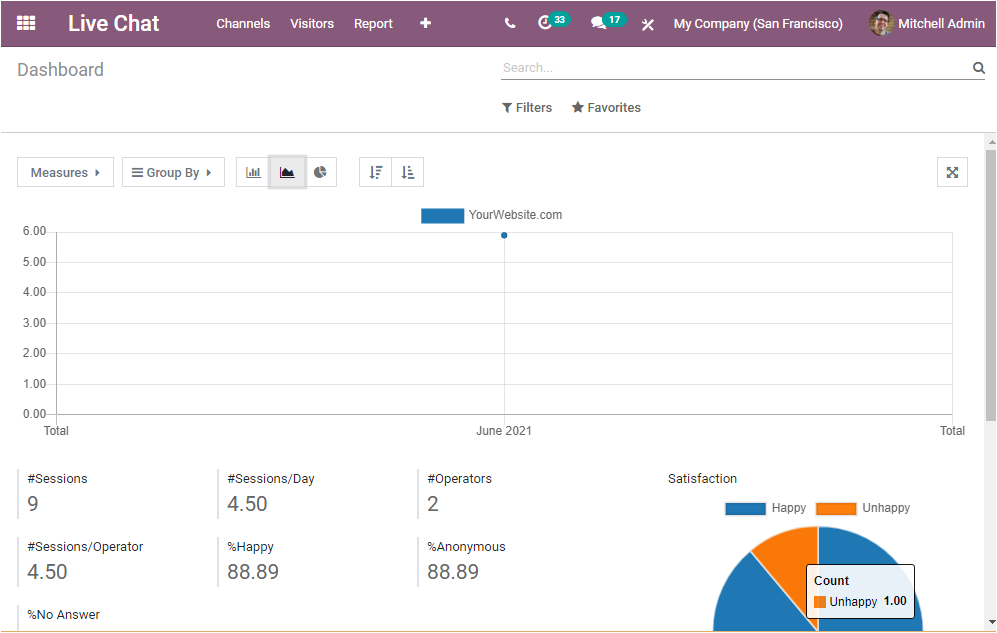
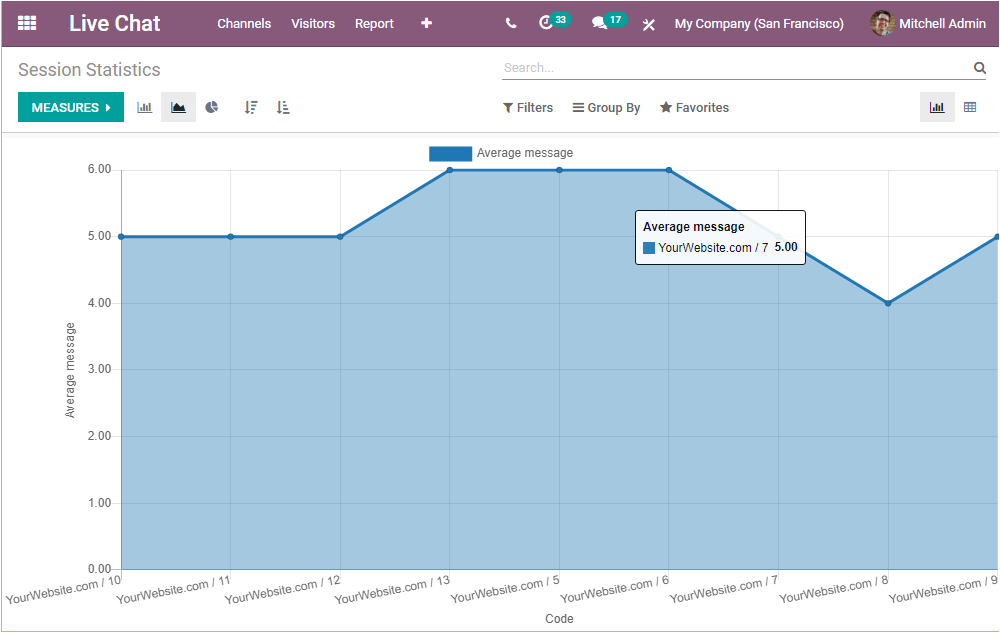
The LineChart representation of the data is shown below and it portrays data as a series of data points joined by straight line segments.
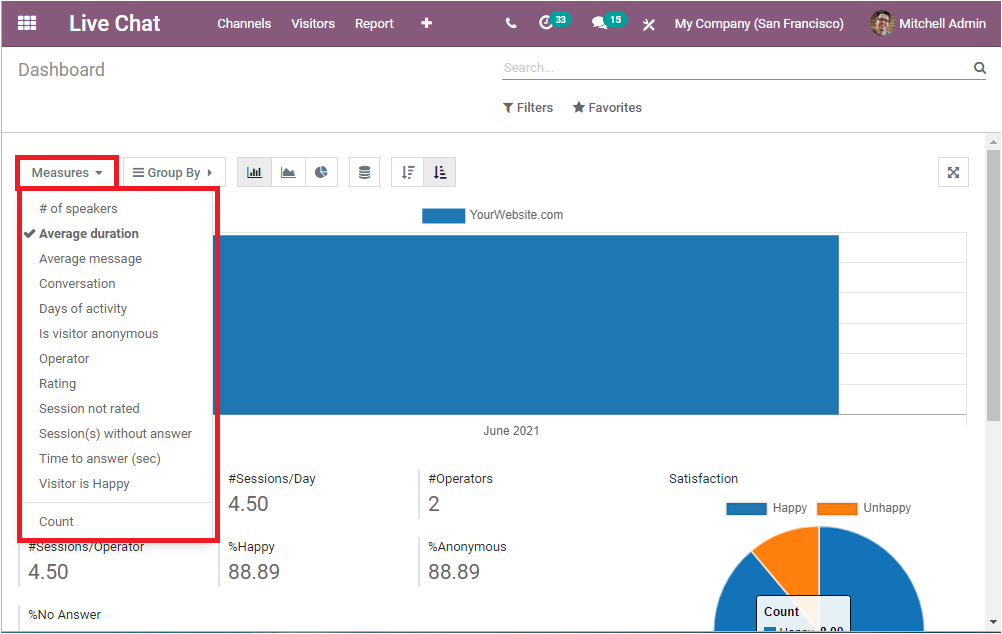
The X-axis of the graph will represent the month and year and here in the displayed figure, the Y-axis represents the Average duration. You can also see the data in various measures such as Average Duration, Average message, Conversation, Days of activity, Is visitor anonymous, Operator, Rating, Session not rated, Sessions without answer, Time to answer(sec), Visitor is Happy. These options can be viewed under the Measures tab available on the top left corner of the window. The image of the tab is depicted in the below image.
Moreover, the data can be viewed in both ascending and descending order by clicking on the respective icon available, and the graph view can be viewed in full screen by selecting the cross icon available on the top right corner of the window. The menus are highlighted in the below image.
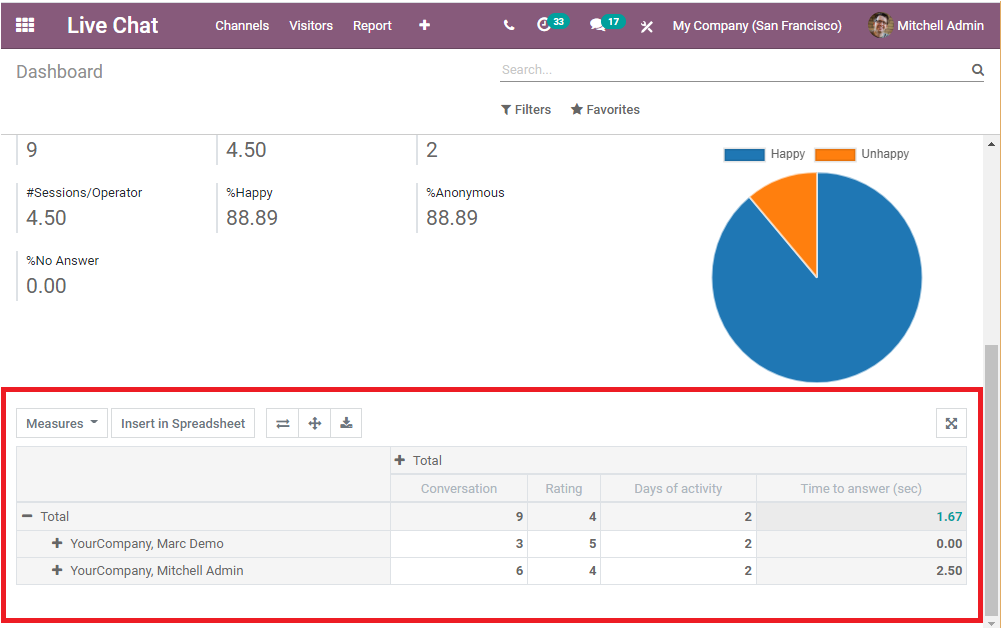
Now we can discuss the Pivot view of the Dashboard analysis and this can be viewed at the bottom of the Dashboard window.
In the Pivot view, you can view the data in a tabular format. In the image depicted above, you can view the total operators in the first column and the total number of Conversations, Day of activity, Time to answer(sec), Is visitor anonymous. In addition, you can add more data by clicking on the + icon available as highlighted in the below image.
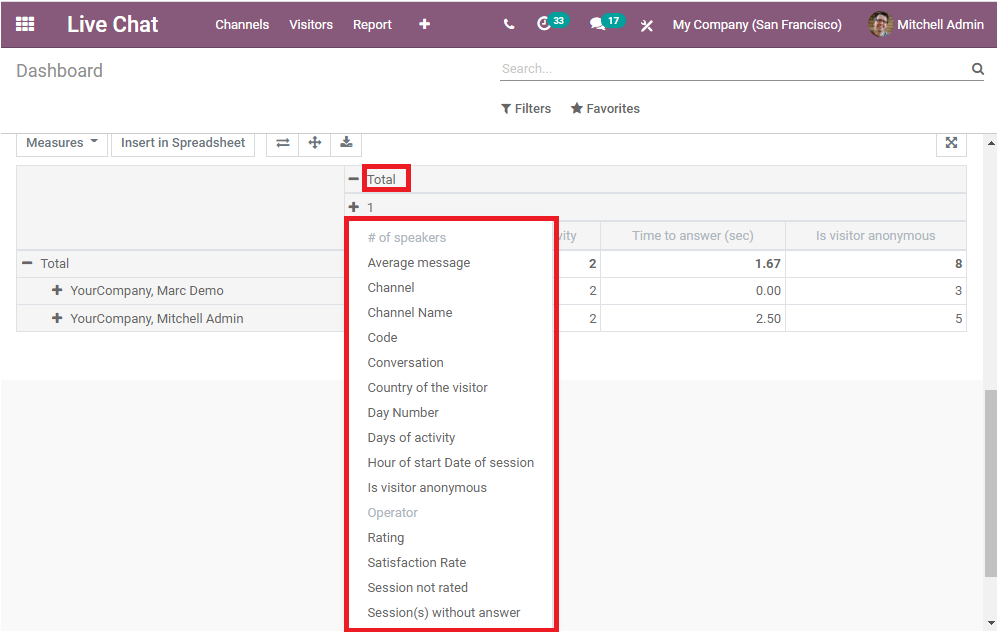
The various measures can be added to the table by selecting the measures. It is also possible to re-arrange or summarise selected columns and rows of the tabular data in a spreadsheet by clicking on the Insert in Spreadsheet option available for getting the desired report. Also, you can view other menus like Flip axis, Expand all, Download xlsx, and the Full-Screen View menu. You can make use of these options to configure multidimensional tables for representing your data.
As we are clear on the Dashboard window of the module and now we can discuss the next window Sessions History available under the report tab of the Odoo Live Chat module.
Sessions History
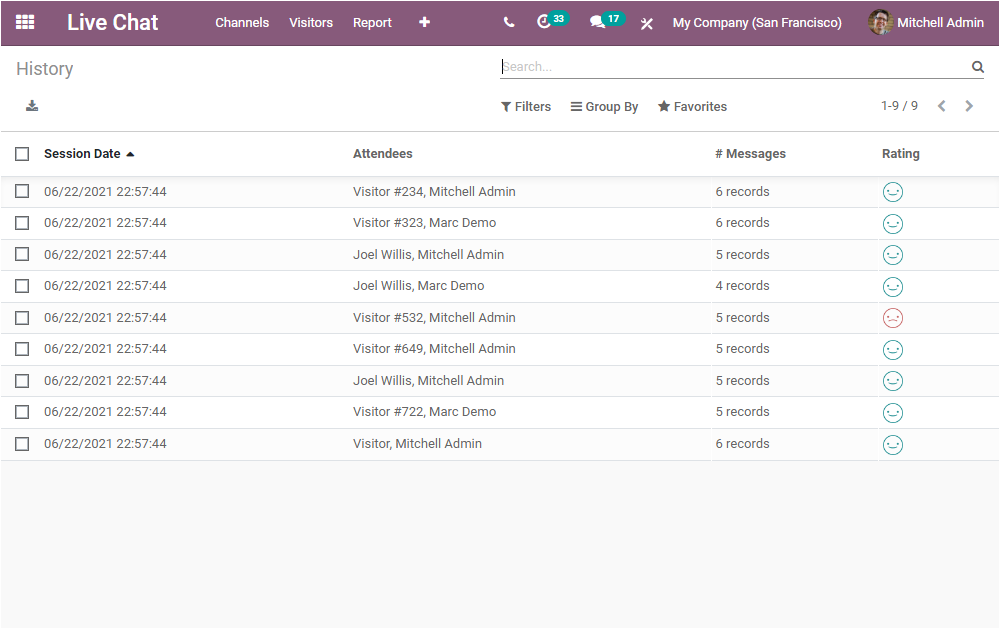
The Session History window will allow you to view all the session history reports at a glance. The Session Date, attendees of the respective sessions, Messages to create records along with the Rating of that session are displayed in the Session History window.
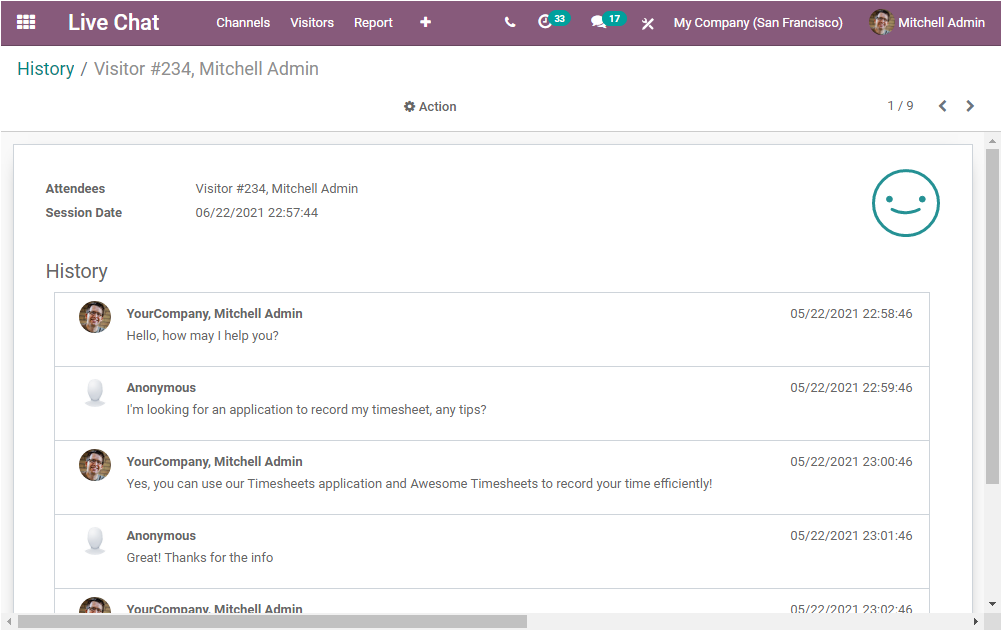
This window also provides all the customizable and default options such as Filters, Group By, Favourite Search. Moreover, You can export all the data to the excel file by choosing the export icon available on the top left corner of the window. Additionally, you can view the complete history of the session by selecting the respective session. For example, we can select the first session which was attended by Mitchell Admin, now you will be directed to the new window where you will be able to view all the session talks between the Attendee (internal operator) and the visitor (anonymous). The Attendee name, Session date and time, history, and Rating can be viewed in a well-arranged manner.
Now we can take a look at the Session Statistics window available.
Session Statistics
The Live Chat support channel session statistics window will enable you to easily check and analyze your organization's live chat session performances in different measures. It helps to gather information about the missed session, the duration of a session, the audience, and many more aspects.
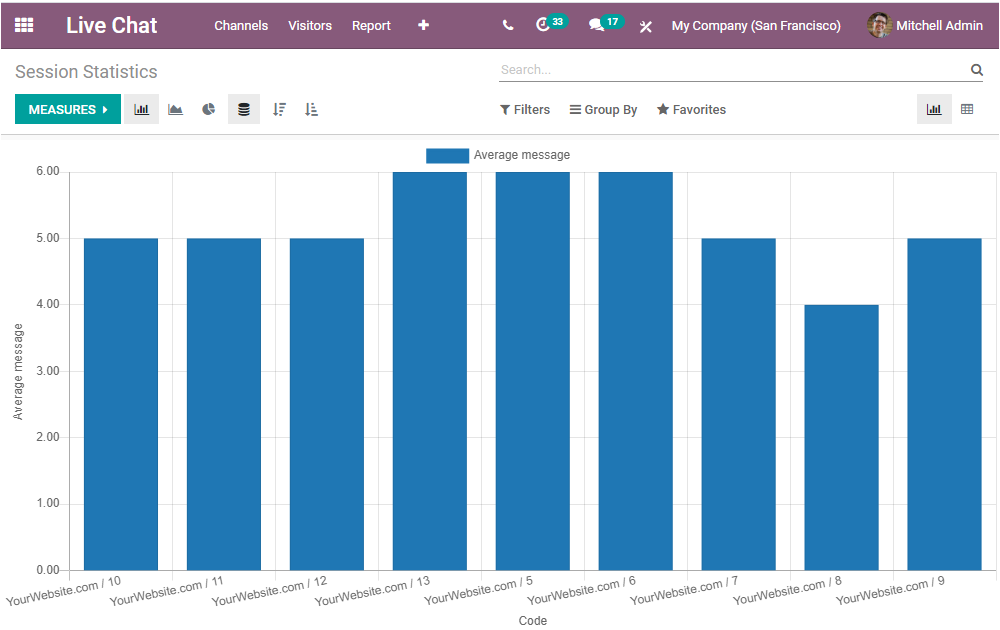
The Session Statistics window available on the Live Chat window will help you to view the reports of the Average messages.
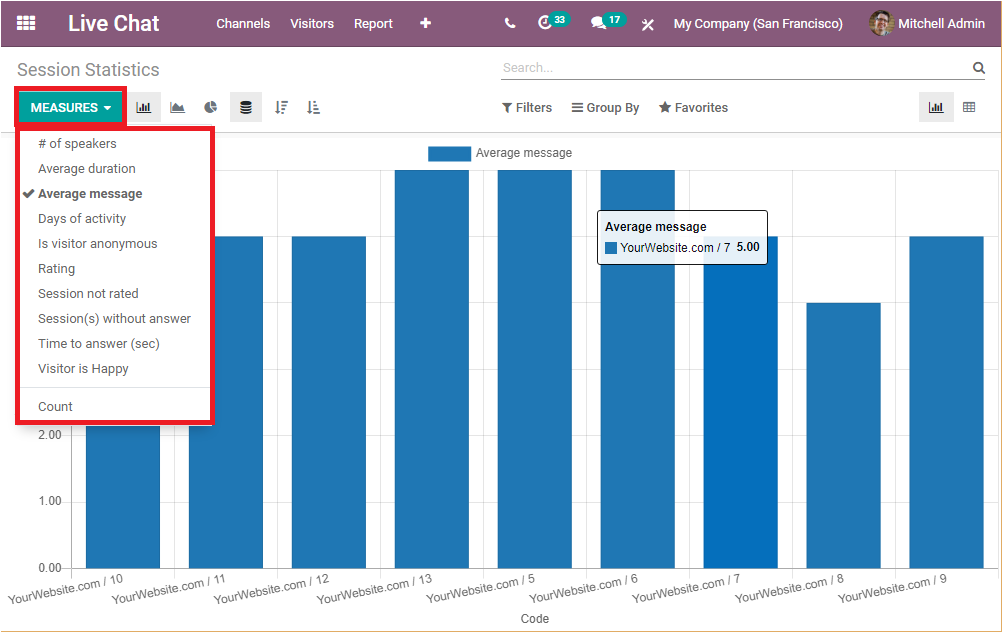
In the above image, the X-axis of the graph will display the Code of the website and the Y-axis describe the average message. This is the Bar Chart view of the window. You can also view the details of the window in the Line Chart and Pie Chart. The Line Chart representation of the window is depicted below.
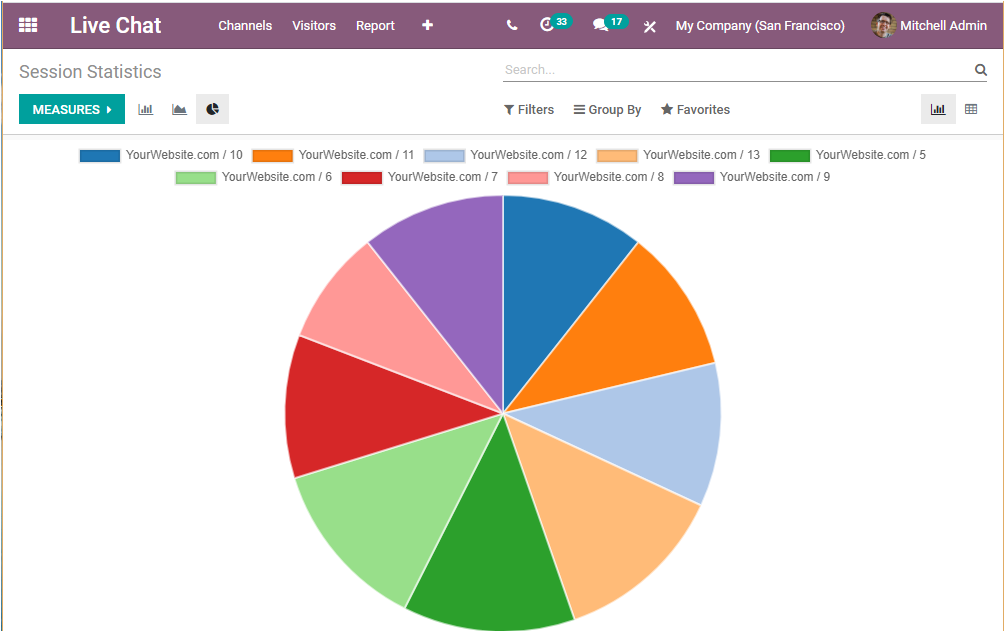
Similarly, we can take a look at the Pie chart representation of the session statistics window.
Apart from these features, Odoo gives you more possibilities. As you can view the session statistics reports in various measures such as Average duration, Average message, of speakers, Days of Activity, Is visitor anonymous, Rating, Session not rated, Sessions without answer, Time to answer, Visitor is Happy and Count as depicted in the below image.
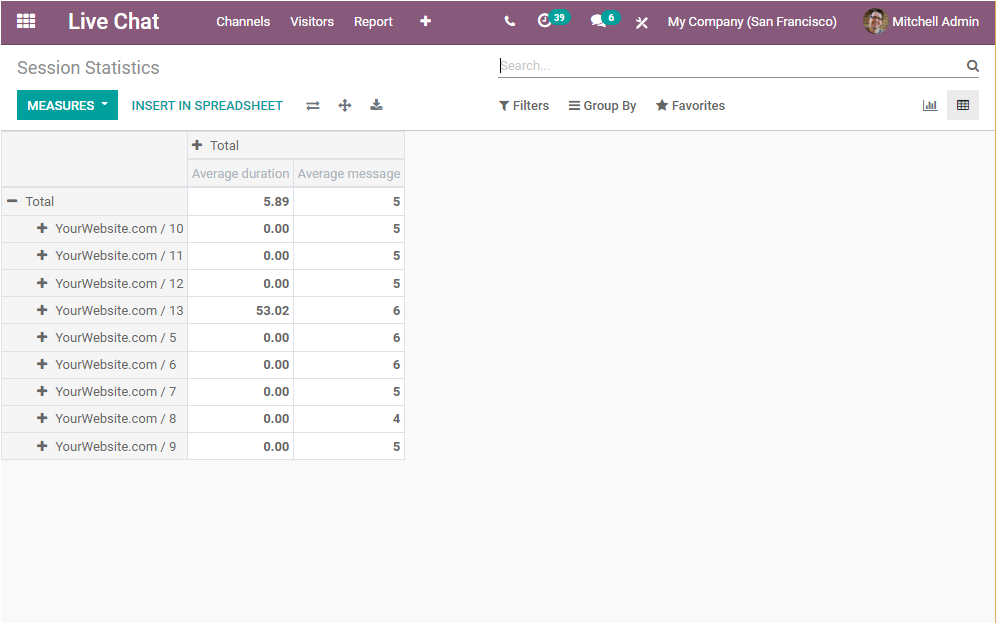
In addition, the Session statistics reports can be viewed in the Pivot table. This can be done by selecting the Pivot view button available on the right top corner of the window. The image of the window in pivot view is depicted below.
You can customize the information in the table with your requirements. As we clear on the Session Statistics window available and now let us take a close look at the Operator Analysis window available.
Operator Analysis
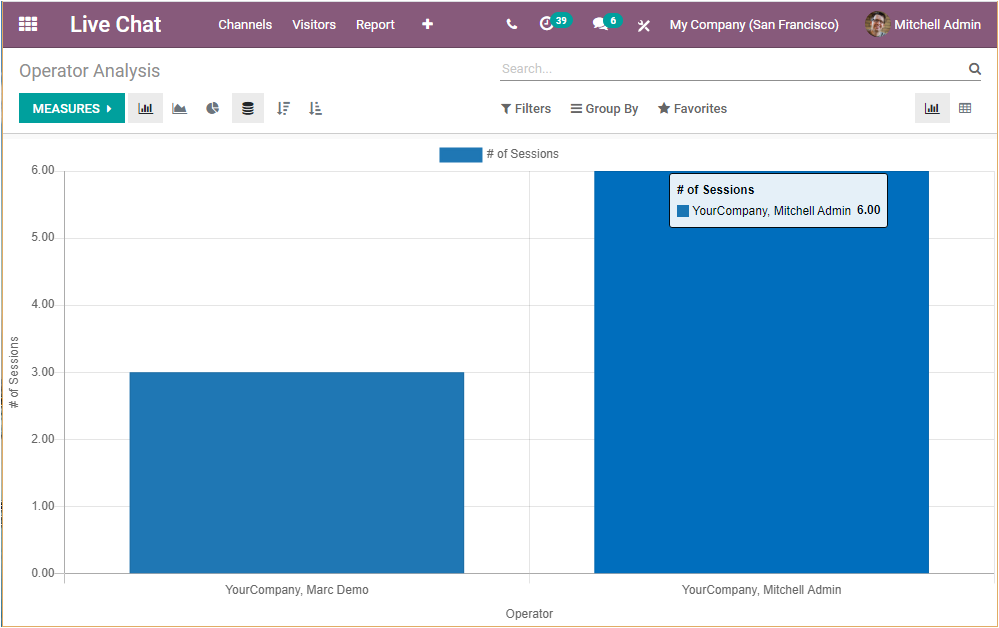
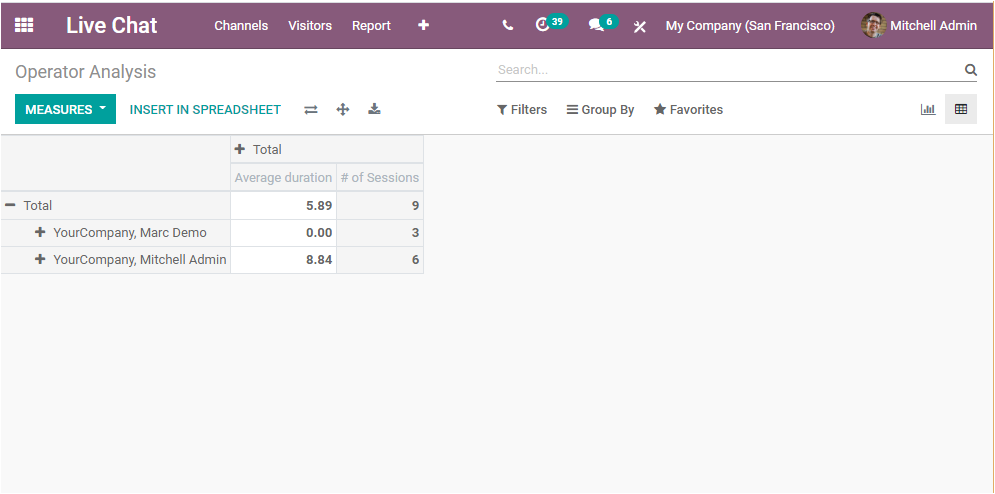
The Operator Analysis window available in the Odoo Live Chat module will give you a glimpse of the operators and their attended sessions. The Operator analysis reports can be viewed in both Graph and Pivot view. In the graph view, you can view the details about the operator on the x-axis and the attendees’ session details on the Y-axis. Let us view an image of the details of the operator and their attended session below.
In this image, you can view two operators who attended the sessions on Your company website. They are Marc Demo and Mitchel Admin. In the Y-axis you can see the attended session counts also. That is Marc Demo attended 3 sessions and Mitchel Admin 6 sessions.
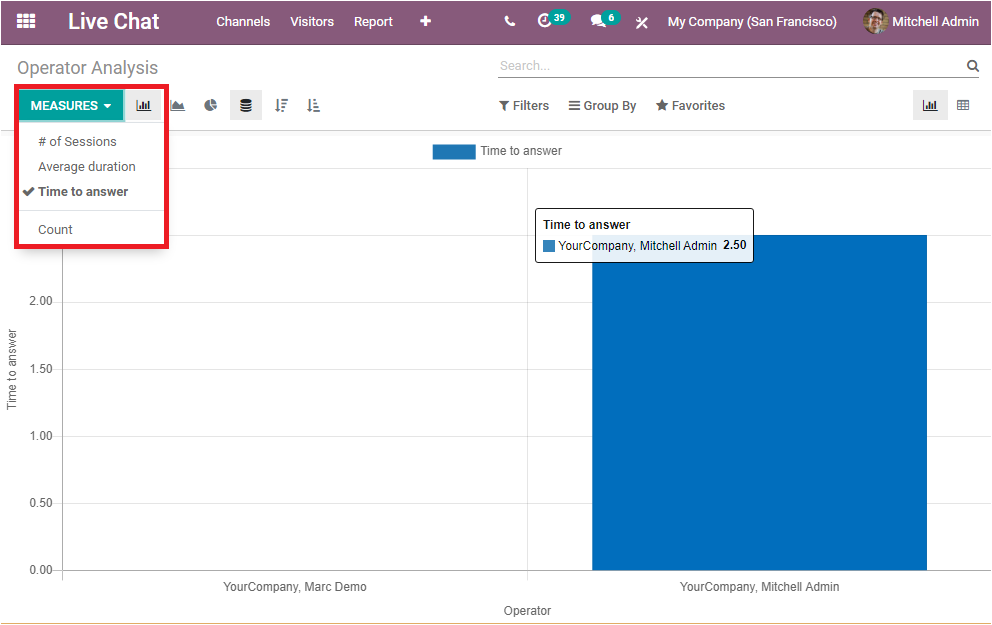
In addition, you can also view the graph on the basis of Average Duration and Time to answer by selecting the respective menu from the Measures tab available.
Similarly, the Data can also be viewed in Pivot view as shown in the below screenshot.
Now we can discuss the last section available under the report menu that is Custom Rating.
Customer Rating
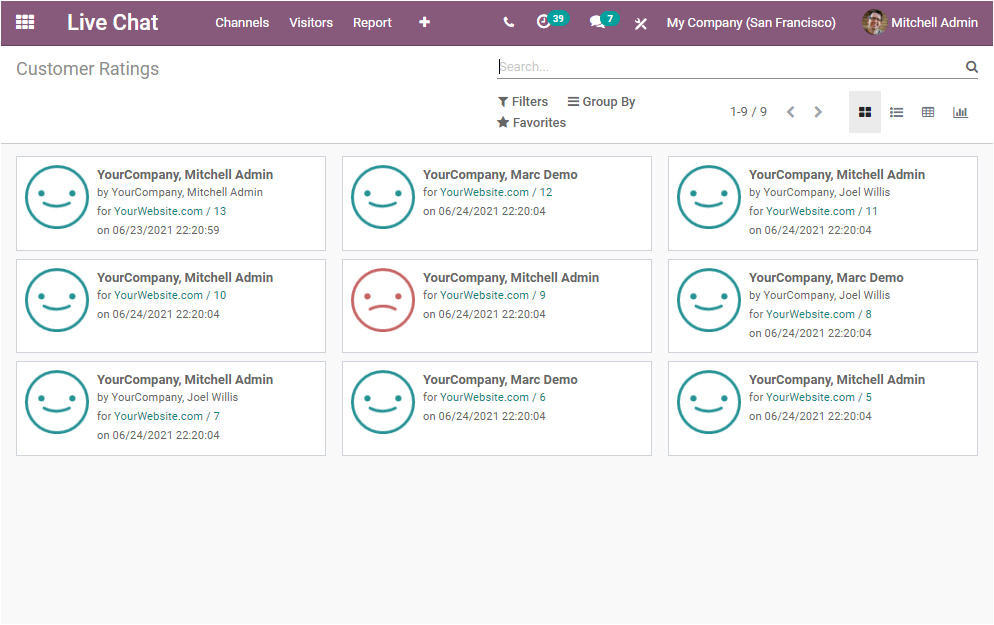
The Customer Rating window available under the Report tab of the Odoo Live Chat module will allow you to view all the customer satisfaction ratings recorded in your Live chat channel along with the details of the website such as attendee of that session, session conducted to date, and time. The platform allows you to view all the ratings and feedback marked by the visitors in one single window. So this window is very helpful for you to analyze the satisfaction rate of your visitors and take desirable actions and improvements if required.
This is the Kanban view of the Customer Rating window and you can also access the details in different views such as List, Pivot, and Graph view. So the Live Chat platform in Odoo provides you an exclusive reporting section to analyze each performance and operation conducted in your Live Chat support channel.