As Odoo applications grow, they tend to accumulate many modules and customizations. As a consequence, the database usage becomes more intensive, with lots of queries being executed. In many cases, the performance issues are caused by too much database load due to inefficient data access patterns. Odoo 19 has a built-in profiler that helps in diagnosing such issues by helping identify which parts of the business logic consume the most time. The tool allows analysis of the SQL queries executed and the code lines that caused them. The information collected by the profiler is used to generate different reports that help in understanding what went wrong. The main analysis types include detecting N+1 queries and separating the duration spent in SQL queries from the Python code. All that makes SQL query profiling one of the most useful debugging techniques in an Odoo 19 application.
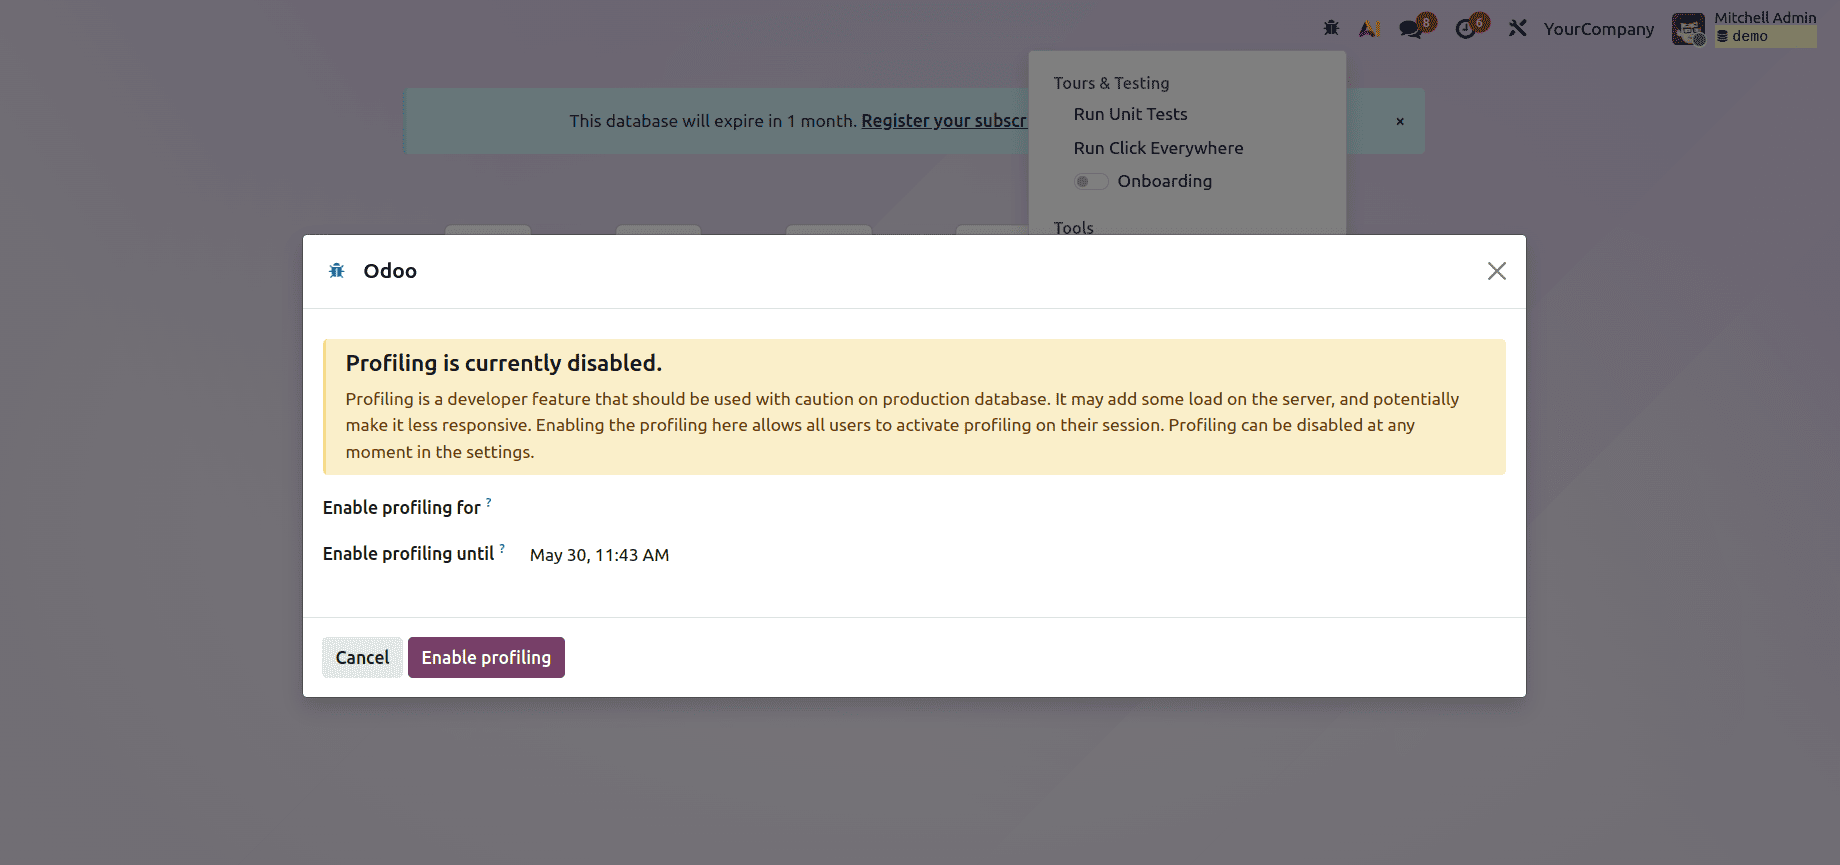
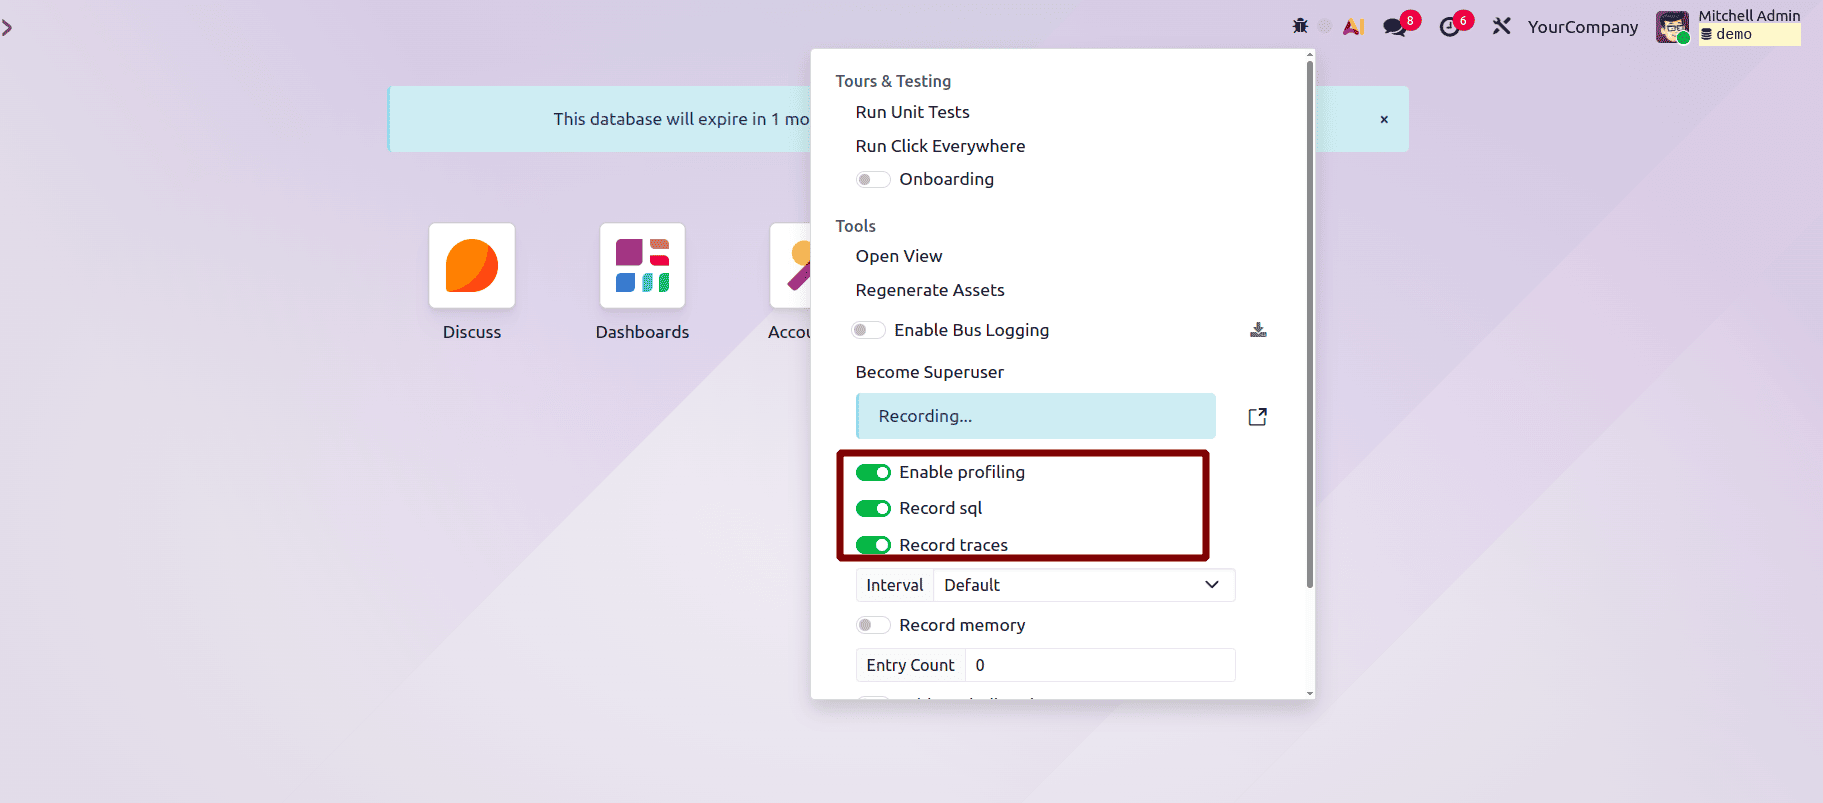
Via the UI (easiest):
First, enable Developer Mode > go to Settings > Developer Tools > Activate Developer Mode. A profiling toggle appears in the developer mode toolbar when it's enabled. Limited to web requests only.
Via Python code (more flexible):
from odoo.tools.profiler import Profiler
with Profiler(collectors=['sql'], description='my_method'):
    # your code here
    sale_orders = self.env['sale.order'].search([('state', '=', 'sale')])
    for order in sale_orders:
        order._compute_amount()
Also possible to pass a list of combining strings and collector objects:
from odoo.tools.profiler import Profiler, PeriodicCollector
with Profiler(collectors=['sql', PeriodicCollector(interval=0.10)]):
    # code to profile
1. Enabling the Profiler
Odoo comes with its own profiling tools, and paired with Speedscope for visualization, they form a powerful solution for performance analysis. The basic approach involves collecting performance data, identifying the operations that place the heaviest load on the database, optimizing the worst ones, and re-profiling the application to measure the improvements.
Some patterns appear again and again as reasons for excessive database load: queries inside loops that fail to utilize Odoo's prefetching mechanism or process large sets of data in Python when the database could do it more efficiently. Making use of ORM functions like mapped(), read_group() or batch writes helps to reduce the number of database calls and optimize performance.
One thing to keep in mind when you use the profiler is that it's a diagnostic tool, not part of your regular performance evaluation. Enable it when you're looking for a specific issue and disable it before recording your final performance measurements and comparing them to earlier results under similar conditions.
2. The Four Collectors
Odoo's profiler has four means for analyzing application performance. The SQL and Periodic collectors are enabled by default, while the required collectors can be selected separately in the developer tools or on the Python side.
- SQL Collector (SQL): tracks every database query along with the details of its execution.
- Periodic Collector (traces_async): takes snapshots of what the process is doing at regular intervals as it runs.
- Sync Collector (traces_sync): captures the execution flow every time a function is called.
- Memory Collector (memory): monitors the changes in memory usage during the execution.
The SQL collector appears to be the most common one for analyzing database activity: it logs every query the active thread performs along with its execution context, allowing you to identify queries that are redundant or run more often than necessary. It gets significantly enhanced if you analyze it together with the output of the Periodic collector in Speedscope, giving you more detailed information on execution time.
3. Speedscope Profiling Views
The profiling data displayed in Speedscope depends on the collectors enabled in the profiling session. From the top menu, there are several views to choose from:
- Combined: displays SQL activity and execution traces combined.
- Combined without Context: similar to the previous one but without the execution context captured earlier.
- SQL (No Gap): removes the Python execution that occurs between queries and displays the SQL operations one after another. It's useful when you're looking for database performance issues and don't want the Python execution to get in the way.
- SQL (Density): highlights the gaps between SQL operations, which can help to identify whether the slowdown is caused by the database or Python execution. It's also useful if you need to group several small queries that can be batched together.
- Frames: only the data captured by the Periodic collector.
4. N+1 Query Issues
These are some of the most common performance issues in Odoo: they arise when your code retrieves a set of records and then queries the database individually for each one. Instead of 1 or 2 queries, you end up with one query per record, the number of which scales along with your data. With a few records, you typically wouldn't see problems; with a few thousand, the queries will start to drag the performance down.
Bad pattern (this triggers N+1):
# 1 query to fetch sale orders + 1 query per order for partner = N+1
sale_orders = self.env['sale.order'].search([])
for order in sale_orders:
    print(order.partner_id.name)  # lazy loads each partner separately
Fix – prefetch in bulk instead:
sale_orders = self.env['sale.order'].search([])
sale_orders.mapped('partner_id')  # prefetches all partners in one query
for order in sale_orders:
    print(order.partner_id.name)  # now uses cache
Fix – or use read_group for aggregations:
# Instead of looping and summing in Python:
results = self.env['sale.order'].read_group(
    domain=[('state', '=', 'sale')],
    fields=['partner_id', 'amount_total:sum'],
    groupby=['partner_id']
)
5. Enabling SQL Logging
To quickly see all queries that are hitting the database, enable SQL logging using the config file or command line.
# odoo.conf
log_level = debug_sql
# or at startup
./odoo-bin --log-level=debug_sql -d mydb
Enable SQL logs for a short window to detect N+1 patterns when forms trigger dozens of queries. This is the fastest way to identify caching and prefetch opportunities.
6. Counting Queries in Code (Dev/Test)
If you're writing tests or just poking around debug mode, Odoo's cursor actually gives you a handy way to count queries directly in code:
# Check how many queries a block of code runs
start_count = self.env.cr.sql_log_count
# ... your code ...
end_count = self.env.cr.sql_log_count
print(f"Queries executed: {end_count - start_count}")
7. Exporting and Analyzing Results
Profiling reports can be exported as JSON or .profile files, so you don't have to analyze everything right away: load those in Speedscope or your favorite flamegraph tool instead. Cross-referencing it with your database logs can usually allow you to find the bottleneck much faster.
Loading a report in Speedscope is straightforward: just drag in the JSON file and look out for the bars that stretch further than the rest; those are your slow spots, a query that takes much longer than expected, or some other activity that's silently eating up your processing time.
8. Profiling Limitations and Performance Optimization
The SQL collector, in particular, can slow you down even further if your application is making many database queries, especially small ones that repeat frequently. The purpose of profiling is to identify performance issues, which means that when you've implemented the fix, make sure to disable the profiler before timing things again; otherwise, you won't be able to see the improvements.
Memory is another limitation to keep in mind: profiling something big or long can generate a lot of data, which can cause Odoo to reach or exceed its memory limit when trying to generate a visualization in Speedscope. If you're facing that, you can increase the hard memory limit when launching the server:
./odoo-bin --limit-memory-hard $((810243))
Odoo 19 offers a powerful set of tools to analyze database performance: querying it with the standard query monitor helps you observe individual queries, while the system profiler gives you a detailed look at execution traces from individual queries or all running processes. You can profile specific user requests or target specific parts of code and look at it in Speedscope or export as JSON for further processing elsewhere.
To read more about The Ultimate Guide to Data Model and Query Optimization in Odoo 19, refer to our blog The Ultimate Guide to Data Model and Query Optimization in Odoo 19.