In many cases, there seem to be issues with our Python codes, and it may be difficult to identify the lines of error. Here is the emerging use case of Debuggers. Debuggers are the programs that assist us in detecting and correcting errors in the programming codes. PDB is a Python debugger used to detect and correct errors in Python code that comes built-in to the Python standard library.
In this blog, we are going to discuss the use cases and workflow for detecting and correcting errors in Python code.
The PDB debugger has many commands or functions to set breakpoints, step through the codes, view traces, and code listings. Some of them are, set_trace(), which is used to set a break point. In Python 3.7 and later versions, breakpoint() is a built-in function that works the same as set_trace() to set a breakpoint. We can discuss the other commands in the flow.
Let’s first check how the PDB debugger works with normal Python code.
Following is a simple example of printing the sum of two numbers.
 def multiply(a, b):
                answer = a * b
                return answer
            x = int(input("Enter first number : "))
            y = int(input("Enter second number : "))
            sum = multiply(x, y)
            print(sum)
Now let's add some breakpoints to break and check the code flow line by line. For using the PDB debugger, we have to import the package using:
Import pdb
After we set a breakpoint where we need to break the flow, the code will stop its execution, and we can check the code flow line by line.
import pdb
def multiply(a, b):
    		answer = a * b
    		return answer
pdb.set_trace()
x = input("Enter first number : ")
y = input("Enter second number : ")
sum = multiply(x, y)
print(sum)
In the above code, there will be a type error as multiplication is not possible on strings because we haven’t converted the entered numbers to integers.
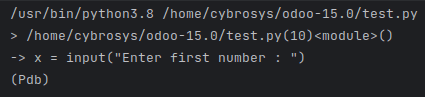
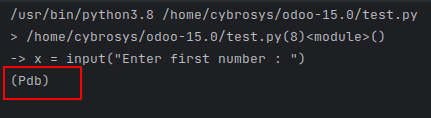
As we run the code sample, the first line will be the path to the executing file. After, on the second line, we can see the line where we have a line break along with the line number as we added a set_trace(). The next lines show where the interpreter has been stopped by the breakpoint. In the last line, there is an indicator (Pdb) which specifies that we are in debug mode. Now it's time to debug the codes.
The next command is used to execute the next lines from the code. So if we type next, the line immediately after the breakpoint will execute and we can find the erroring line.
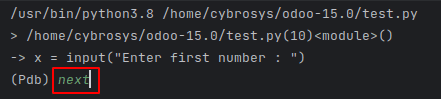
Here in the above image, first, the execution stopped at the breakpoint, and I typed next. On clicking enter, the next line will be executed as follows.
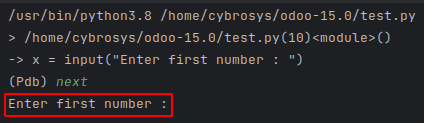
After each line's execution, type next to continue on to the next line.
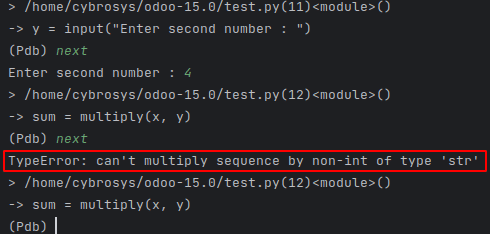
Like in the above image, we can find the error line easily by stepping through each line of code.
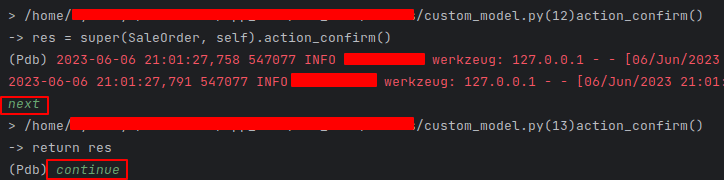
The continue command is used to continue without line-by-line tracing, and at first, on the breakpoint, only the execution stops. The continued execution will not stop until the next breakpoint.
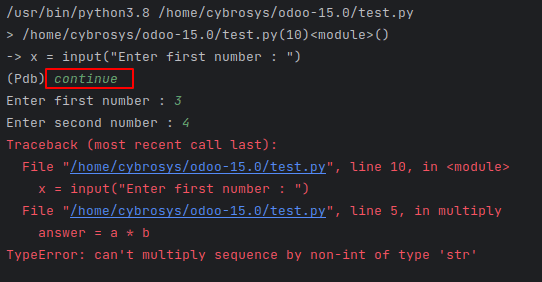
Thus, with ‘continue,’ we will not have line-by-line tracing for error causing lines.
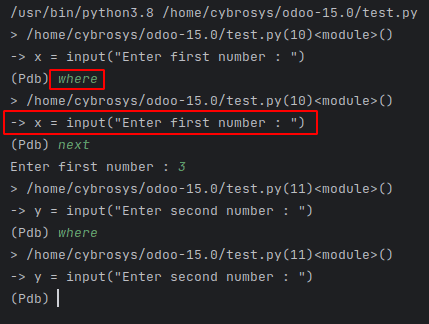
Next, where the command will show the stack trace and the number of the current lines after the breakpoint.
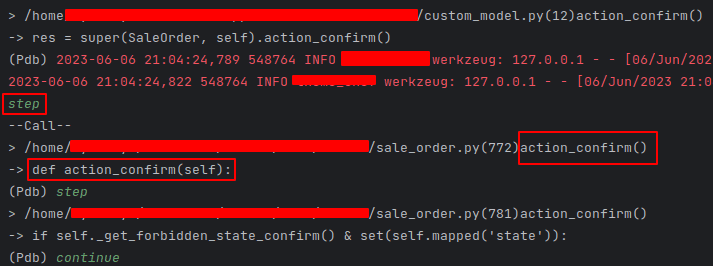
step command will step into the function at the current line, and we can trace each line on the called function.
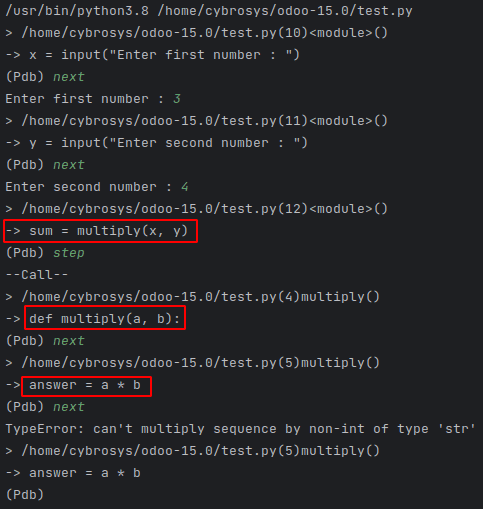
In the above image, at the breakpoints, we type next command, and each line is executed. And at the breaking point before the function call, we typed the step command, so the execution stepped into the function, and each line of the function is executed line by line. Thus, by using the step command, we can trace the lines of called functions also.
While executing Python codes, it's very important to keep track of the type of the variables during different operations. In several cases, based on the null values the types of variables may change. Using the PDB debugger, while tracing the lines, we can also check the type of the variable using the whatis command.
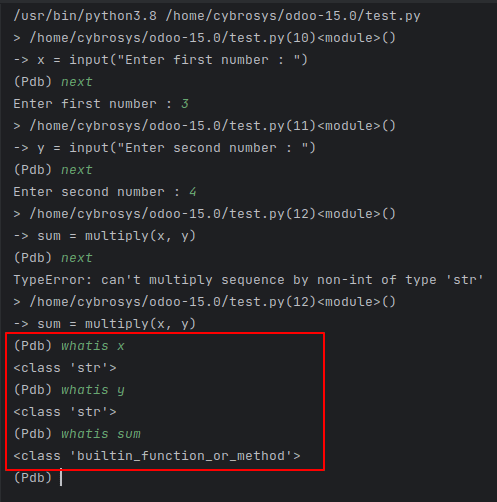
In the above image, as the TypeError shows, we can check the type of the x and y variables. And it is a string. This is why we got the type error, as string values cannot be multiplied. We have to convert it to an integer.
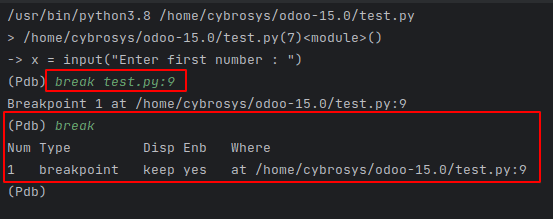
Next, we can check on the break command, which is used to add breakpoints on the execution itself. While executing large codes, we might know the error lines, and there we need to add some breakpoints. In these cases, the break command will be useful. The syntax to add new breakpoints is as follows,
break filename: lineno, condition
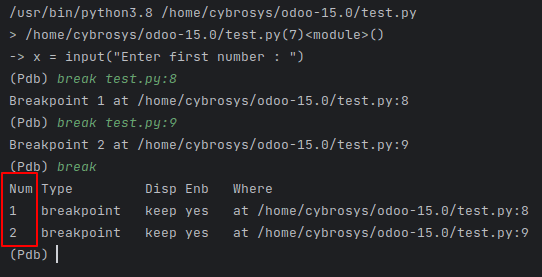
Also, we can use the break command to list all the existing breakpoints.
We can also enable or disable the breakpoints based on the breakpoint numbers. Let’s move on to check how we can disable and enable the breakpoints.
As we use the break command, the breakpoint number can also be viewed.
We can use the following command to invoke and run scripts from the command line.
python -m pdb test.py
Where test.py will be the file name to be executed.
When using the above command to run the above-explained Python code, as the multiplication is not possible on strings, the output will be as follows.
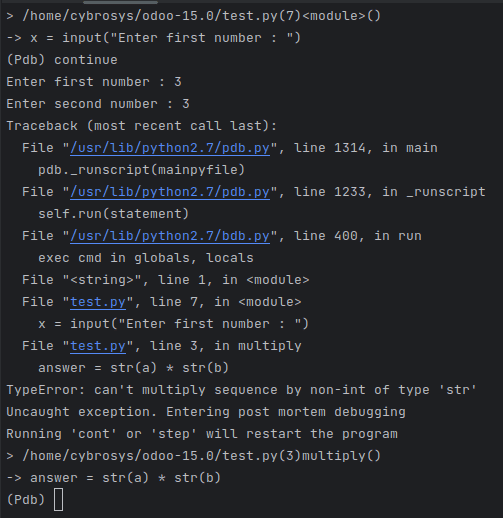
On using the cont or step commands, the program will be restarted to be executed.
Moreover, we have different other commands with different functionalities to be used by the PDB debugger to debug the code lines. To get all of them, we can type the help command.
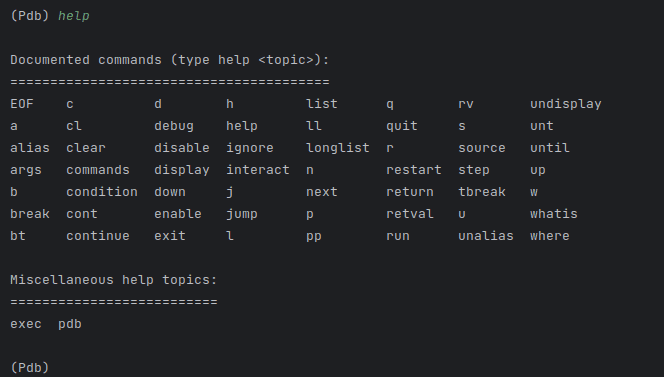
We can find all the use cases of these commands in PDB Debugger.
Also, using the breakpoint() command, without importing the PDB, we can use the breakpoint flows in our Python codes in 3.7 and later versions.
     def multiply(a, b):
    answer = a * b
    return answer
breakpoint()
x = input("Enter first number : ")
y = input("Enter second number : ")
sum = multiply(x, y)
print(sum)
After adding the breakpoint, the same flow as we used set_trace will be executed.
Now let's move on to how this PDB debugger can be used with Odoo.
import pdb
from odoo import models
class SaleOrder(models.Model):
    _inherit = 'sale.order'

    def action_confirm(self):
        pdb.set_trace()
        res = super(SaleOrder, self).action_confirm()
        return res
Here in the above code, we have inherited the Sale order model and superseded the confirm method. And added a trace. With this, we can use different commands of PDB for debugging cases. Currently, while clicking the confirm from a Sale order, the function will not be fully executed as we have added a trace. So, we can debug each line and check for errors.

The set_trace() function will break the flow, and we can use the continue or next or step command to execute the full code.
On the first next command, the next line will be executed. And on continue command, the rest of the code will be executed till any other breakpoints.
While using step commands, each line on the called function within the confirm method will be invoked and executed line by line based on the next command and will be executed till the next breakpoint based on the continue command.
Next, we can have a look at how the new breakpoints can be created, enabled, and disabled.
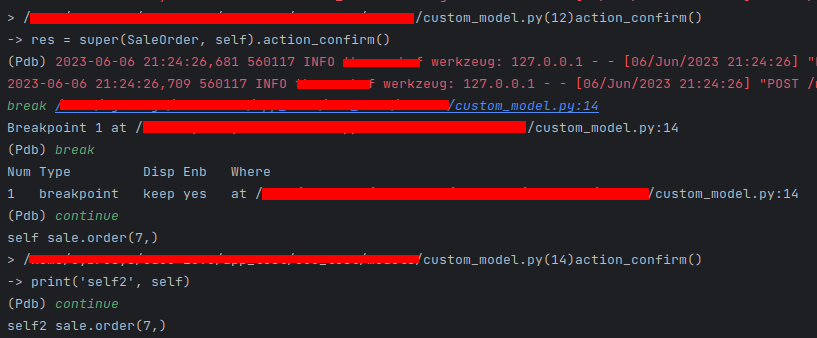
Like in the above image, we can use break command to create new breakpoints on large codes. Also, even if we use continue or c command, the execution will be stopped at the next breakpoint.
Let’s update the code like follows,
	import pdb
from odoo import models

class SaleOrder(models.Model):
    _inherit = 'sale.order'
   def action_confirm(self):
        pdb.set_trace()
        res = super(SaleOrder, self).action_confirm()
        print('self', self)
        print('self2', self)
        return res
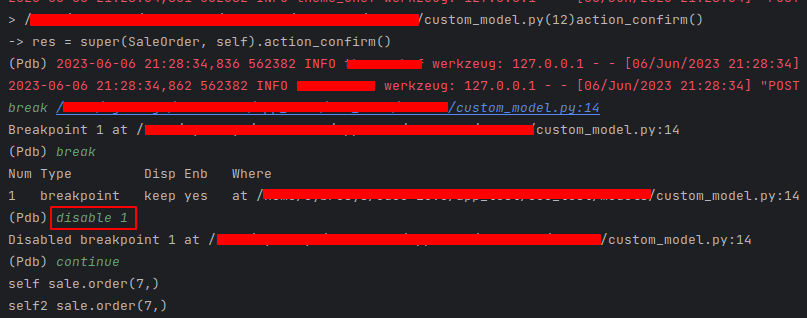
In the above image, as we created and disabled the added breakpoint using disable command, and using the continue command, the execution will not be stopped. In this way, we can also use enable command to enable the disabled breakpoint.
Moreover, we can also use the other commands to set up different use cases of PDB in Odoo. And that’s how we use the PDB debugger to debug in Odoo.