Odoo provides several ways to display and manage your business data. One of these is the Graph view, which is mainly used for analyzing data with graphs. This allows you to compare values between records, run performance checks, and discover trends.
The graph view is used to analyse your business data in a lot of the default modules such as Sales, CRM, Accounting, and Inventory. This can be used to compare sales made by salesperson, see how much revenue is generated each month, and more.
Graph views are created using XML in Odoo 20. There are lots of attributes that can be used to adjust how the graph is displayed. These include type, stacked, order, disable_linking, and sample. The fields within the graph will determine how the records are grouped and what calculations are made.
In this blog, we will look at these graph view attributes and understand their purpose.
A Graph view is a reporting view that displays aggregated records in the form of charts. It helps users understand large amounts of data without having to examine each record individually.
Odoo supports three main chart types in the Graph view:
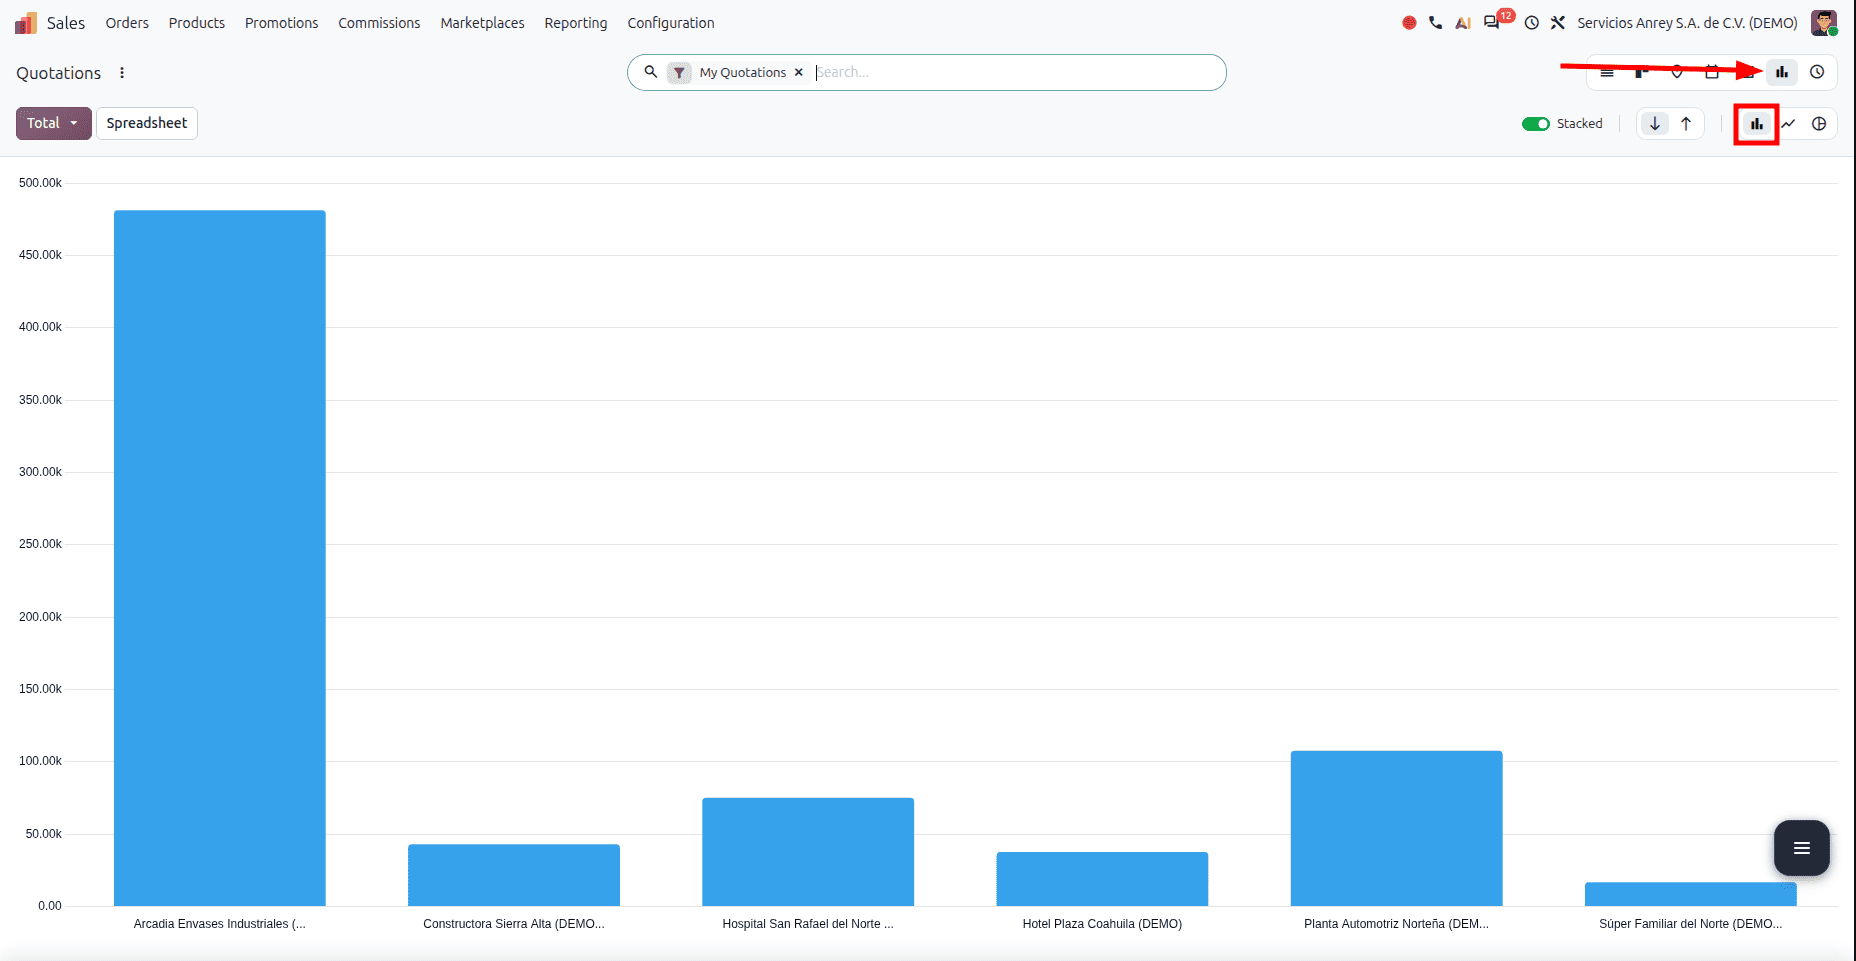
- Bar chart: Used to compare values across categories, such as total sales by salesperson.
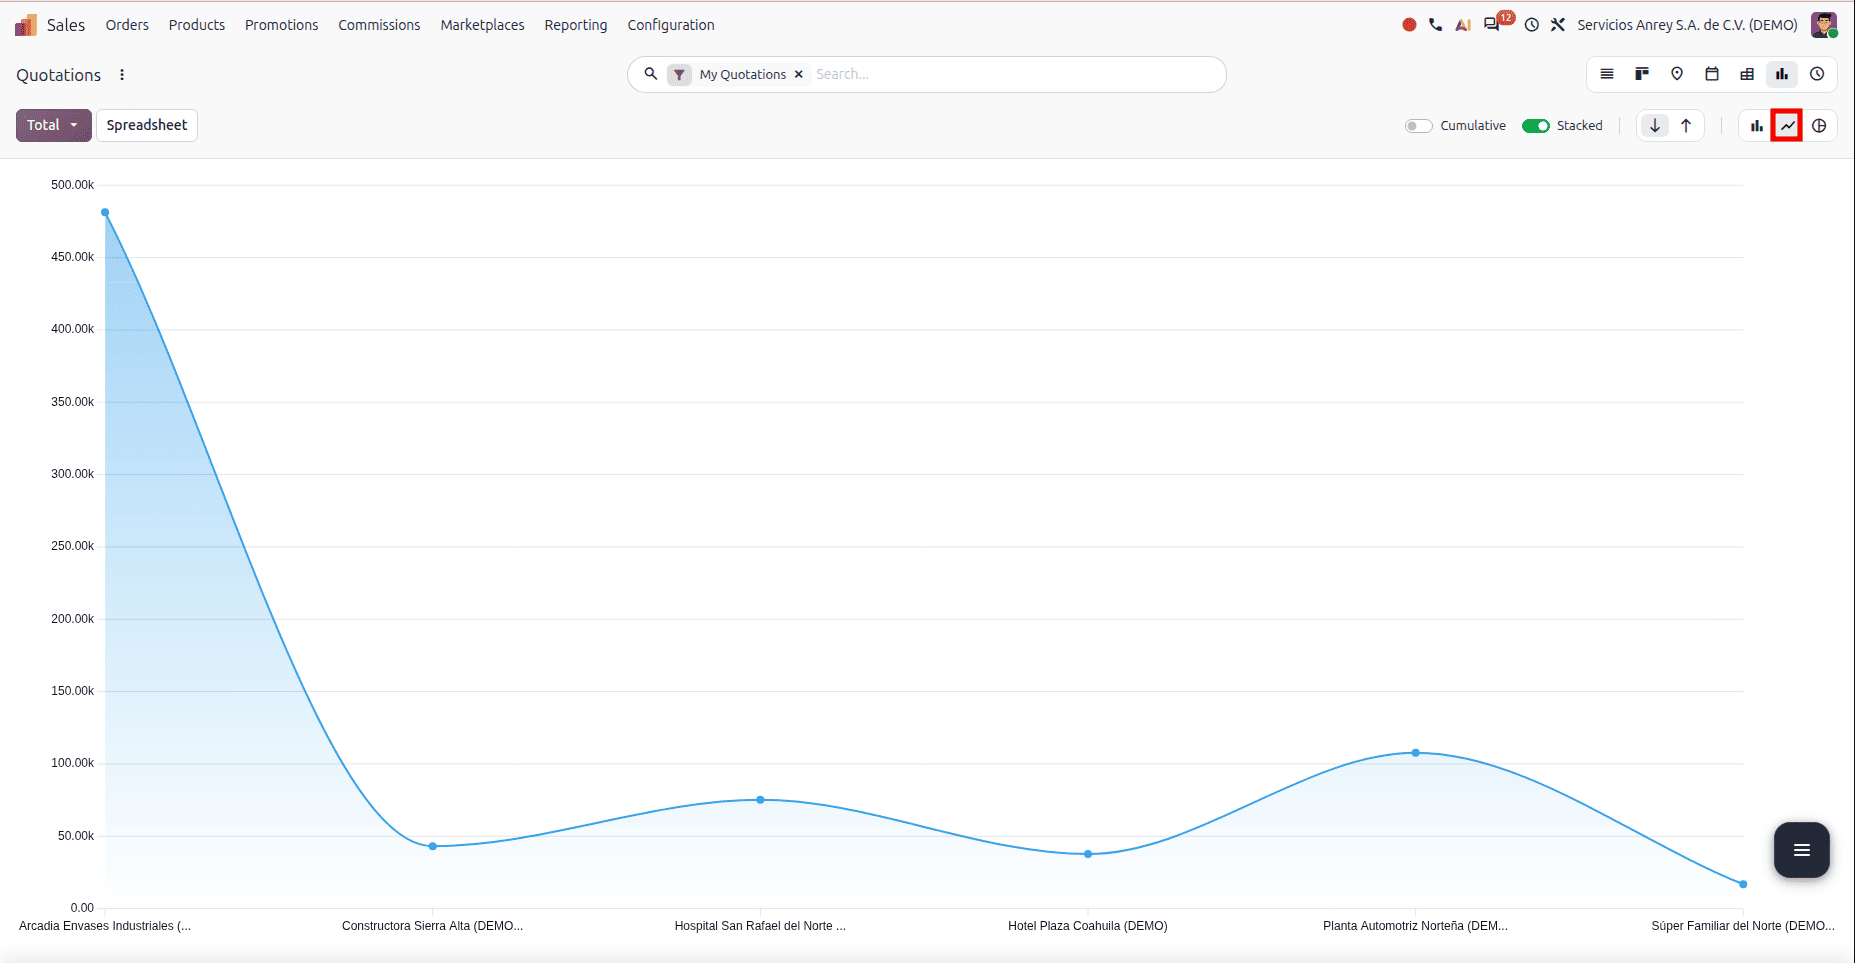
- Line chart: Used to identify changes and trends over time, such as monthly revenue.
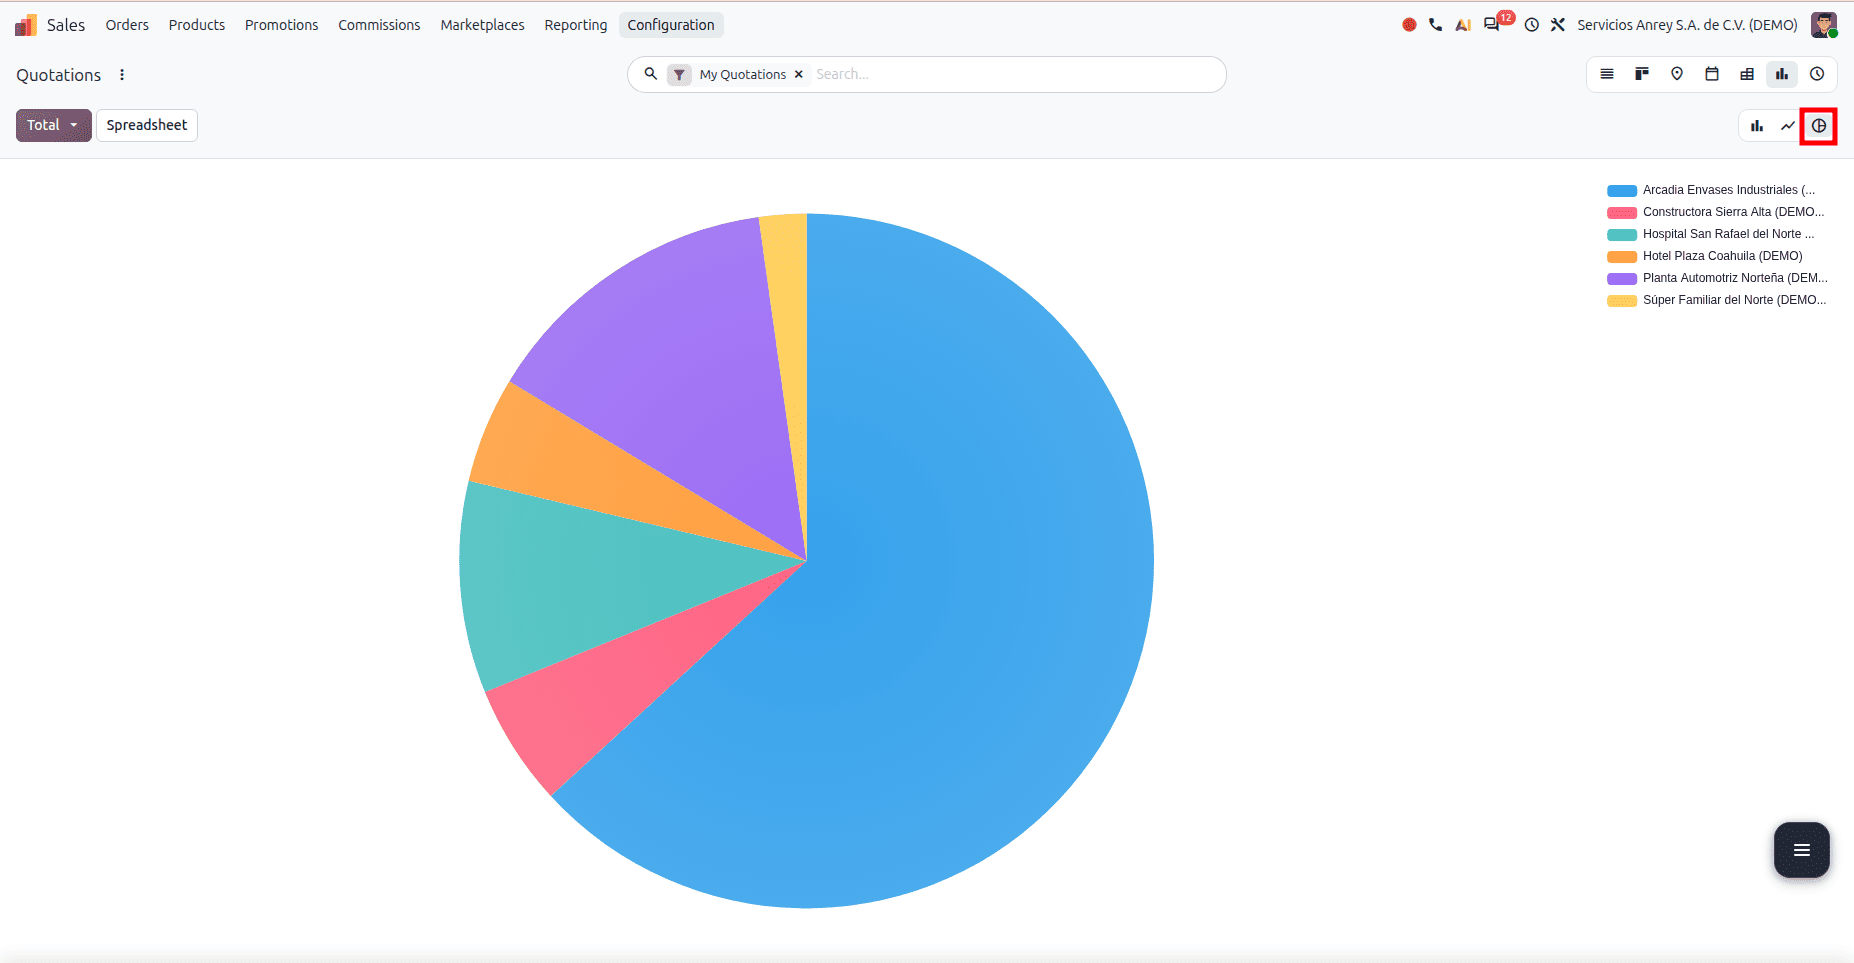
- Pie chart: Used to understand the distribution of values among categories, such as the share of sales contributed by different product categories.
This view uses fields from your model to produce aggregated data. You can specify which fields to group by, and which measures to use in your chart using XML.
Graph View Attributes
The graph view has a number of attributes to determine what type of chart to create, what it looks like, how it is sorted and navigated, and what sample data to show. Below are some of the most common attributes that can be used.
1. type
The type attribute determines which chart type Odoo uses to display the aggregated data.
The commonly supported graph types are:
Eg:
<graph string="Sales Analysis" type="bar" order="desc">
   <field name="product_id" type="row"/>
   <field name="margin" type="measure"/>
</graph>
Depending on your data, you can create different types of charts. Bar charts can be used to compare values, line charts can be used to show trends, and pie charts can be used to show proportions.
2. stacked
Stacked charts help to compare the totals of each series but also show how much each series contributes. If you want to compare individual values, then an unstacked chart could be more appropriate.
<graph string="Time off Summary" sample="1" stacked="1" js_class="hr_holidays_graph">
   <field name="employee_id" type="row"/>
   <field name="leave_type" type="col"/>
   <field name="number_of_days" string="Duration (Days)" type="measure"/>
   <field name="number_of_hours" string="Duration (Hours)"/>
</graph>
The value 1 enables stacking where supported. Setting stacked="0" disables stacking.
Stacked charts can be used to compare total values. They also show what contribution each part of the series makes towards the total. If you want to compare values, then you may want to use an unstacked chart.
3. disable_linking
The graph can be clicked on to see the underlying data. This allows you to see what the actual data is behind the aggregated values.
The disable_linking attribute disables this graph-to-record navigation.
<graph js_class="skills_graph" type="line" stacked="0" disable_linking="1">
   <field name="date" interval="day" type="row"/>
   <field name="skill_id" type="row"/>
   <field name="level_progress" type="measure"/>
</graph>
Enabling this attribute helps users to view the graph without accessing the underlying data records by clicking on the points. This is useful if you want to display a summary graph, such as in dashboard views.
It does not affect the access rights/rules for the record.
4. Order
Orders are used to determine the order of the categories in your supported charts by their measures.
The commonly used values are:
- asc: Ascending order, from lower to higher values.
- desc: Descending order, from higher to lower values.
<graph string="Sales Analysis" type="bar" order="desc">
   <field name="product_id" type="row"/>
   <field name="margin" type="measure"/>
</graph>
This can help you easily see which categories have higher values.
5. String
The string attribute defines a human-readable label for the graph view.
<graph string="Sales Analysis" type="bar" order="desc">
   <field name="product_id" type="row"/>
   <field name="margin" type="measure"/>
</graph>
In this example, Teacher Salary Analysis describes the purpose of the chart.
6. sample
The sample allows Odoo to show sample data if there are no records to display in your view. This will give you an idea of what your graph will look like.
<graph string="Planning Analysis" sample="1" order="desc" js_class="planning_slot_analysis_graph">
   <field name="start_datetime" interval="month"/>
   <field name="resource_ids"/>
   <field name="allocated_hours" type="measure" widget="float_time"/>
   <field name="allocated_percentage" invisible="1"/>
</graph>
This is useful when building up modules or to demonstrate the graph in action without having any real records. These are just examples and are not real business data. When you have real records, the graph will use them.
Fields Inside a Graph View
The attributes control how the graph behaves. They are the elements within the graph tag that determine how the data is grouped and measured.
Measures
A measure is a value calculated by Odoo. You can choose to show the amount of sales, quantity of products, number of working hours, or salary, for example.
In a graph view, you can specify that a field should be a measure by adding type="measure" as follows:
<field name="salary" type="measure"/>
It will be calculated according to the method of aggregation you have selected for that field. Most numeric fields will use SUM, as this will sum all the values.
Example: Group by subject, and Odoo will calculate the total salary for each subject.
Use aggregable fields for your measure. Normally, you won’t be able to use non-stored computed fields, as they can’t be aggregated in the database without the appropriate reporting system in place.
Dimensions
Dimensions allow you to group your data based on different attributes. For example, you could group your data by subject, salesperson, customer, product category, or date.
Interval
Date or datetime fields can be grouped by day, week, month, quarter, or year, depending on the field type and graph.
For example, a sales analysis graph can group revenue by month:
<graph string="Monthly Sales Analysis" type="line">
    <field name="date_order" interval="month"/>
    <field name="amount_total" type="measure"/>
</graph>
Graph views allow users to analyse data in Odoo 20. Developers can configure how the data is displayed by choosing which type of chart, which fields to group by, and what to measure.
When creating a graph view, you should select what type of chart you would like to use and what fields you want to group by. Choosing the correct measurement will also allow users to see comparisons between values.
Understanding the different attributes will allow developers to create graph views for a variety of reporting needs within their custom Odoo modules. It is important to test your graph view in Odoo 20 to ensure everything is working as intended.
To read more about Overview of Graph View Attributes in Odoo19, refer to our blog Overview of Graph View Attributes in Odoo19.