In Odoo 19, Graph Views continue to play a crucial role in helping users understand business data visually, making trends, comparisons, and performance indicators easy to grasp at a glance.
Whether you are analyzing sales performance, tracking inventory movements, or monitoring CRM pipelines, Graph views transform raw records into meaningful charts directly inside the Odoo interface. In this blog, we’ll walk through Graph View attributes in Odoo 19, explaining what they do and how they help you design effective visual reports.
What Is a Graph View in Odoo?
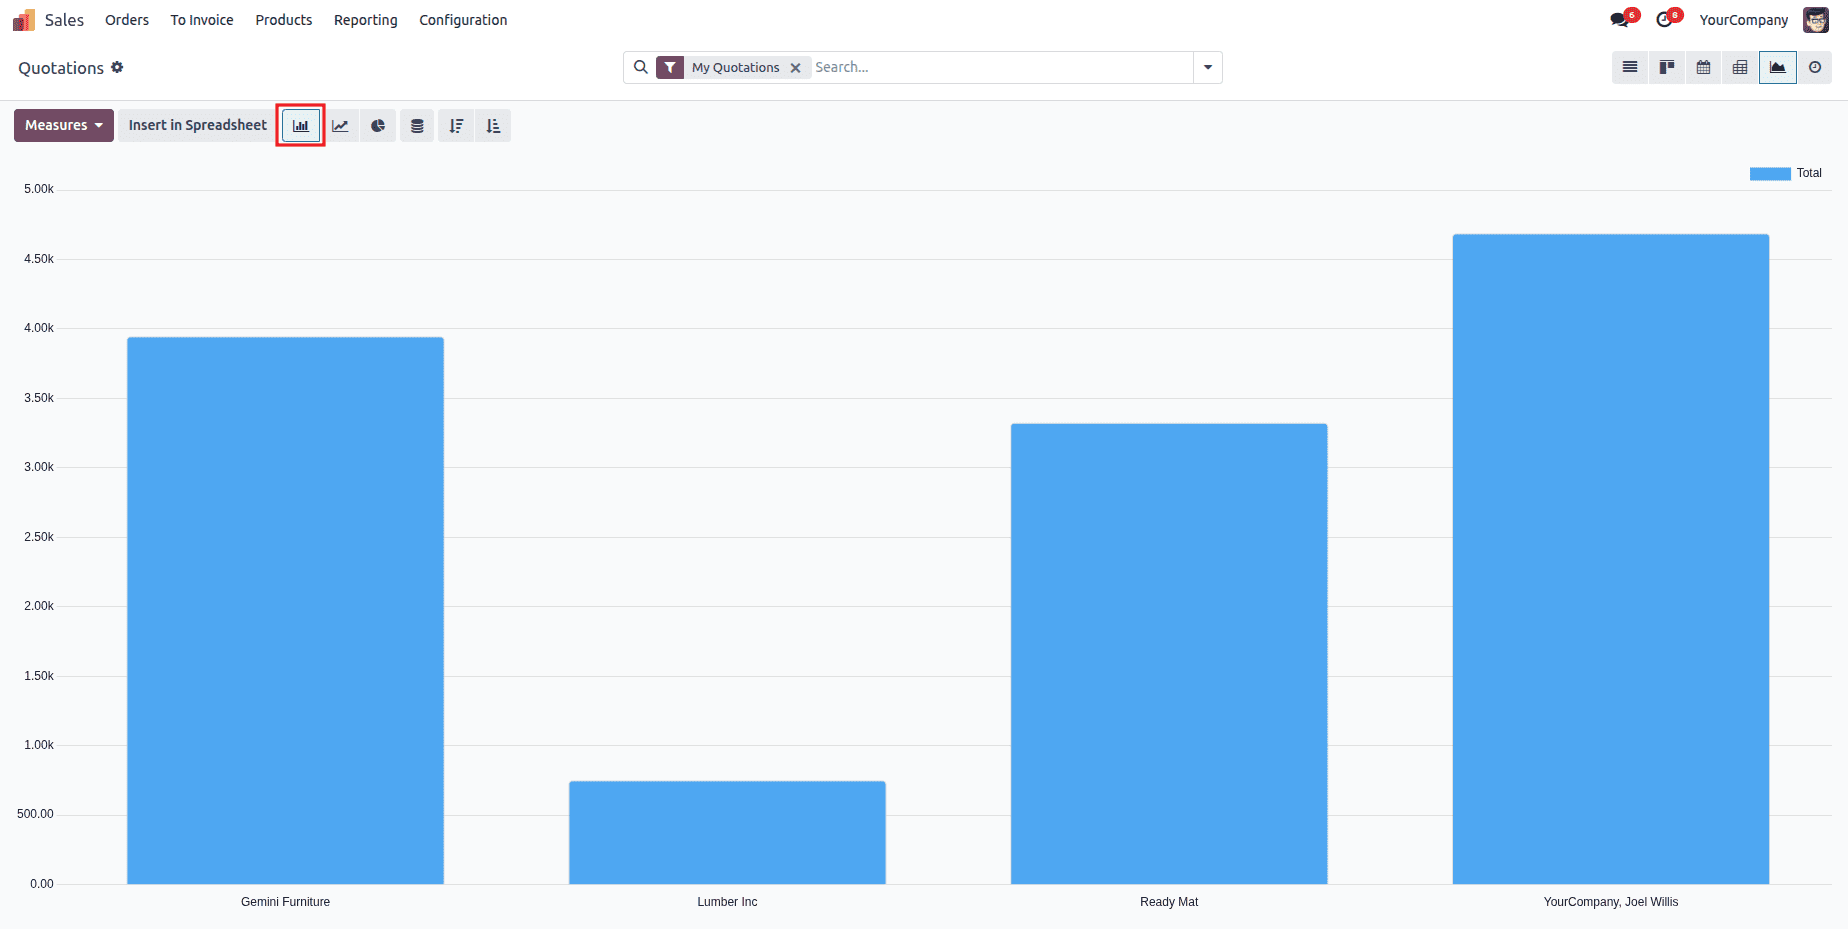
A Graph view in Odoo is a reporting view that displays aggregated data using visual charts such as bar charts, line charts, and pie charts. Unlike list views or form views, graph views focus on summarization and comparison rather than individual records.
Graph views are widely used across various modules, including Sales, Accounting, Inventory, and CRM.
Odoo 19 builds on this foundation with smoother interactions and improved configuration options.
Core Graph View Attributes in Odoo 19
Graph views are defined using XML, and their behavior is controlled through attributes. Let’s look at the most commonly used ones.
1. type (optional)
Defines the type of chart used to display the data.
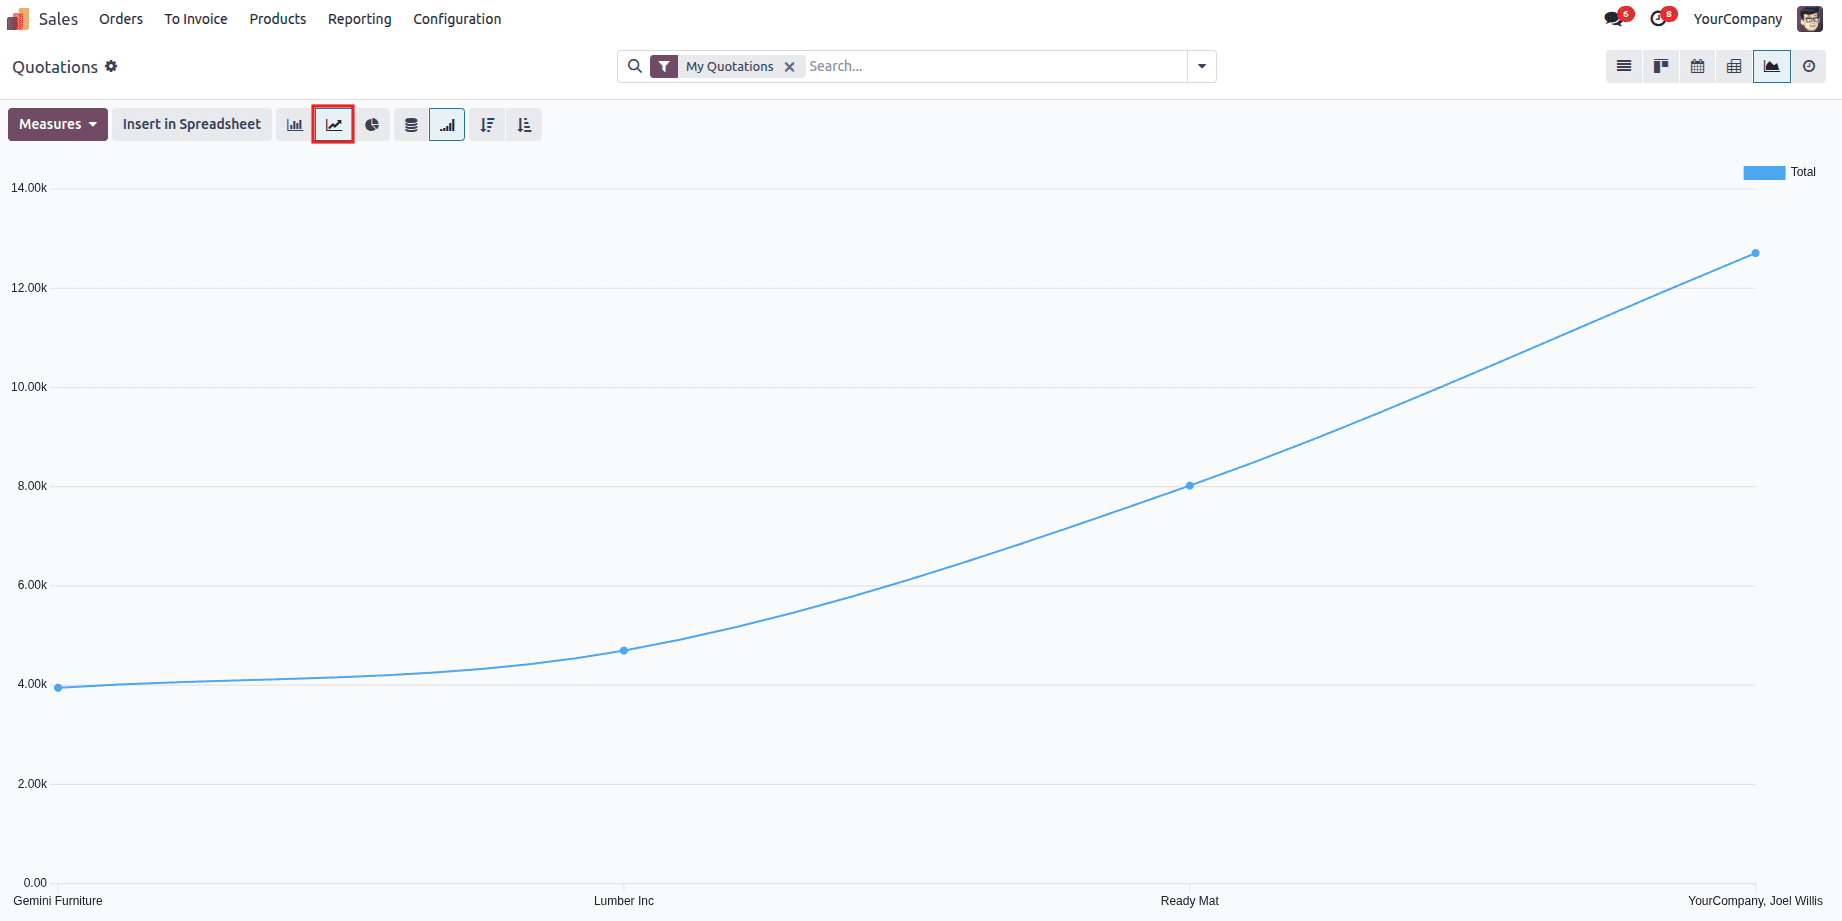
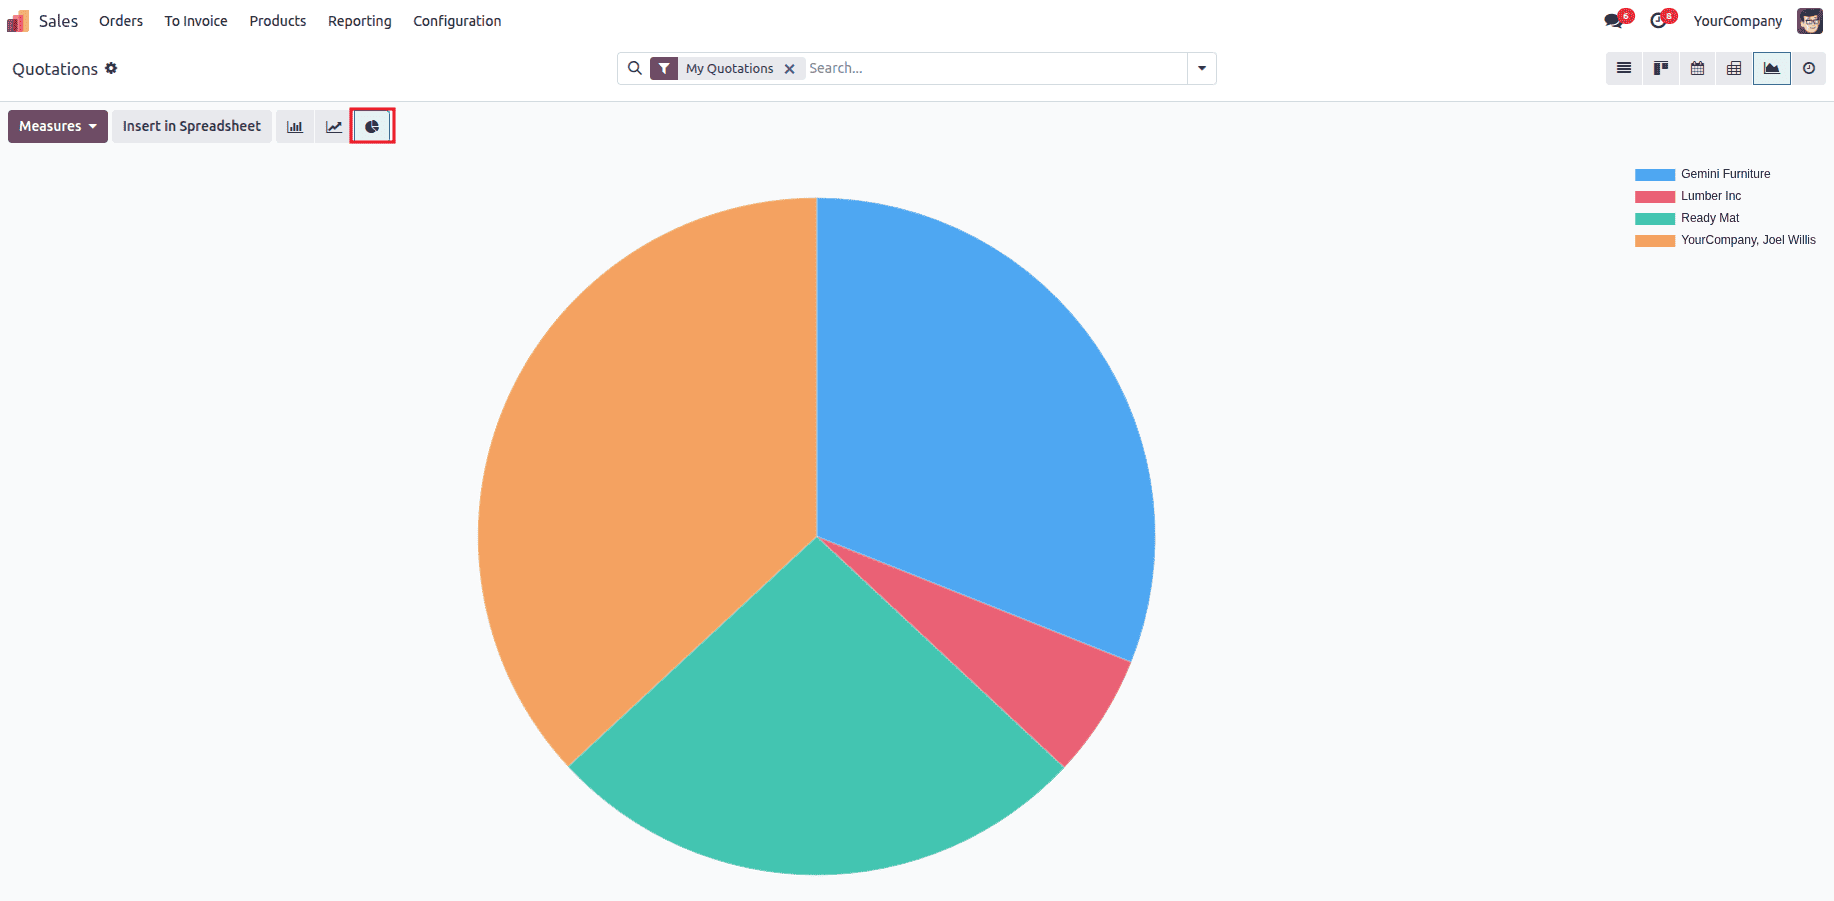
Available options:
- Line charts for trends over time
- Pie charts for proportional distribution
2. stacked (optional)
Applicable only to bar and line charts.
- 1 > bars within a group are stacked
- 0 > bars are displayed side by side
<graph type="bar" stacked="0">
Stacked charts are useful when comparing totals while still showing category-level contributions.
3. disable_linking (optional)
By default, clicking on a graph element redirects the user to the corresponding list view. This attribute disables that behavior.
<graph disable_linking="1">
Commonly used for dashboards, KPIs, and read-only analytical views.
4. order (optional)
Controls how values on the X-axis are sorted based on their measure.
Accepted values:
5. string (optional)
Defines the label shown in the breadcrumbs when a user drills down from the graph to the list view.
<graph string="Sales Performance">
This improves navigation clarity during drill-down analysis.
6. sample (optional)
Determines whether the graph should display sample data when no real records exist.
<graph sample="1">
Key characteristics of sample data:
- Automatically generated using heuristics
- Uses realistic placeholder values (names, emails, etc.)
- Fully non-interactive
- Removed immediately when the user performs any action
Type: bool
Default: False
This feature is especially useful during view design, demos, and prototyping.
Field Elements in Graph Views
The only allowed child element inside a <graph> view is <field>. Fields define measures and dimensions.
1. Measures (Aggregated Values)
Measures specify what is calculated, such as totals or counts. Only numeric fields (Float, Integer, Monetary) can be used.
<field name="amount_total" type="measure"/>
By default, Odoo aggregates measures using sum.
Measures are automatically generated from stored model fields and sorted alphabetically.
Non-stored computed fields cannot be used in graph views.
2. Dimensions (Grouping Fields)
Dimensions define how data is grouped.
- type="row" is typically used for the X-axis
- Additional fields create secondary groupings
<field name="date_order" type="row"/>
<field name="state"/>
This allows analysis across time, categories, statuses, or other business dimensions.
Key Characteristics
- Automatically generated using heuristics
- Uses realistic placeholder values (names, emails, etc.)
- Fully non-interactive
- Removed immediately when the user performs any action
Type: bool
Default: False
Sample Graph View Definition (Odoo 19)
Here’s a simple example of a graph view for sales analysis:
<record id="view_sale_order_graph" model="ir.ui.view">
  <field name="name">sale.order.graph</field>
  <field name="model">sale.order</field>
  <field name="arch" type="xml">
      <graph string="Sales Overview" type="bar" stacked="1">
          <field name="date_order" type="row"/>
          <field name="amount_total" type="measure"/>
      </graph>
  </field>
</record>
This creates a stacked bar chart showing total sales grouped by order date.
Best Practices for Using Graph Views
- Keep graphs simple and focused
- Use meaningful titles and grouping fields
- Avoid excessive dimensions that reduce clarity
- Choose chart types based on the story you want to tell
- Use stacked views only when comparisons matter
Graph views in Odoo 19 continue to be a powerful reporting tool, allowing businesses to visualize performance and trends directly within their workflows. By understanding graph view attributes and using them thoughtfully, you can create dashboards and reports that are not only informative but also easy to interpret.
Whether you are a developer building custom modules or a functional user configuring reports, mastering graph views helps you turn data into actionable insights.
To read more about Overview of Graph View Attributes in Odoo 18, refer to our blog Overview of Graph View Attributes in Odoo 18.