Dashboards are an essential feature in Odoo, offering a clear and interactive way to visualize important business data. They help organizations track key metrics, monitor performance, and make faster, data-driven decisions. With the release of Odoo 19, building dashboards has become more intuitive, thanks to upgraded tools and an improved user interface.
Odoo, as a robust and flexible ERP system, provides multiple options for displaying and interacting with data. In Odoo 19, views play a central role in shaping how users access and manage records across different modules. These views ensure that information is presented in an organized, user-friendly, and visually appealing manner.
In this blog, we’ll walk through the steps of creating a custom dashboard in Odoo 19—starting from the basic setup and moving toward more advanced customizations. Whether you’re a developer aiming to extend functionality or a business user looking for actionable insights, this guide will help you design dynamic dashboards tailored to your unique requirements.
In Odoo 19, dashboards are rendered using client actions. These actions are generally triggered through menu items, giving users quick access to interactive and real-time dashboard views.
Defining the Client Action
In Odoo 19, client actions are the mechanism that allows dashboards to be displayed inside the interface. They serve as a link between the backend setup and the frontend view, enabling interactive elements such as KPIs, charts, and widgets.
To build a custom dashboard, you create a client action in the ir.actions.client model. This record connects the dashboard to a specific JavaScript component using a tag, which tells Odoo how the dashboard should be rendered.
<?xml version="1.0" encoding="UTF-8" ?>
<odoo>
    <record id="crm_dashboard_action" model="ir.actions.client">
        <field name="name">CRM Dashboard</field>
        <field name="tag">crm_dashboard_tag</field>
    </record>
    <menuitem name="Dashboard" id="crm_dashboard" sequence="0"
              action="crm_dashboard_action" parent="crm.crm_menu_root"/>
</odoo>
- name field: Specifies the title that will appear for the dashboard inside Odoo.
- tag field: Establishes the connection between the client action and its corresponding JavaScript component.
When a user clicks the "Dashboard" menu item, the system triggers the crm_dashboard_action. This action is tied to the JavaScript file through the defined tag (for example, crm_dashboard_tag), ensuring the dashboard is rendered properly.
The client action is usually defined in XML and then associated with a menu item, making the dashboard easily accessible to users. Once configured, it provides the structure needed for pulling in business data and presenting it in a clear, user-friendly format.
Creating the OWL Component
The next step is to build an OWL component that takes care of rendering the dashboard interface. For this, you’ll need to create a new JavaScript file inside your module, typically at:
static/src/js/dashboard.js
This file will define the logic and structure of the dashboard, including how data is fetched, processed, and displayed to the user.
/** @odoo-module **/
import { registry } from "@web/core/registry";
import { Component } from "@odoo/owl";
const actionRegistry = registry.category("actions");
class CrmDashboard extends Component {}
CrmDashboard.template = "my_module.CrmDashboard";
// Register the component with the action tag
actionRegistry.add("crm_dashboard_tag", CrmDashboard);
Here’s what happens in the code:
- The OWL framework is imported to create the dashboard component.
- The actionRegistry.add() method connects the component to the tag (crm_dashboard_tag), so it runs whenever the corresponding action is triggered.
- The XML template linked to the component defines how the dashboard’s layout will look.
At this point, the dashboard view will load, but it will be empty until we add content.
Creating the Dashboard Template
To show content inside the dashboard, we need to build an XML template. This template defines the structure and layout of what the user sees.
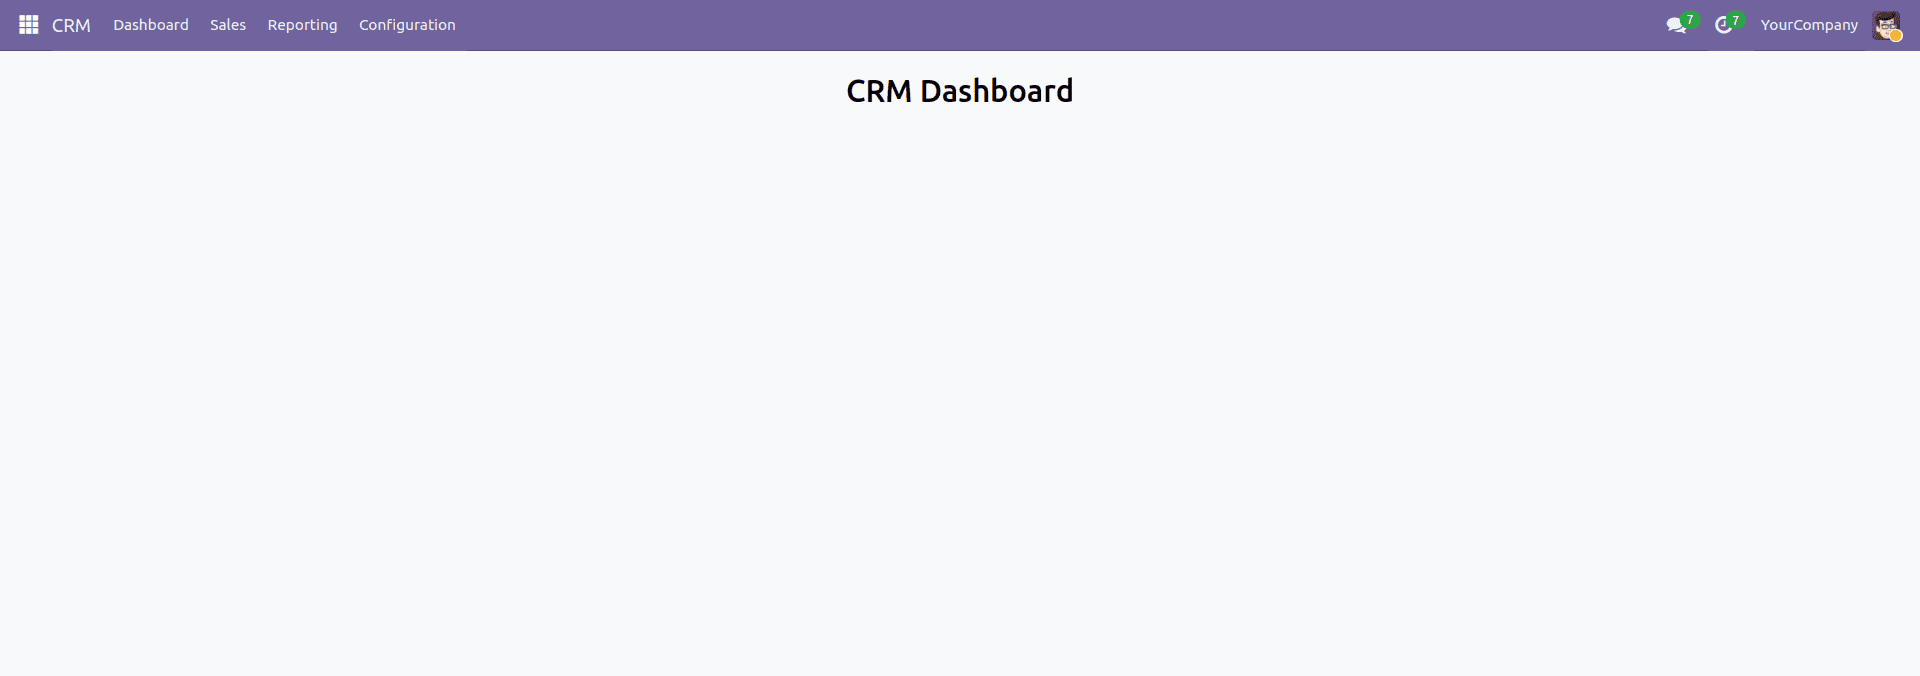
In the example below, we add a simple heading titled “CRM Dashboard” and center it on the page:
<?xml version="1.0" encoding="UTF-8" ?>
<templates>
   <t t-name="my_module.CrmDashboard">
       <div>
           <div>
               <center>
                   <h1 style="margin:20px;">CRM Dashboard</h1>
               </center>
           </div>
       </div>
   </t>
</templates>
- The template creates a centered heading labeled CRM Dashboard.
- It is connected to the JavaScript component through the t-name="my_module.CrmDashboard" attribute.
Adding Files to the Manifest
To make sure the JavaScript and XML files are loaded into Odoo, they need to be added to the module’s __manifest__.py file:
'assets': {
   'web.assets_backend': [
       'my_module/static/src/js/dashboard.js',
       'my_module/static/src/xml/dashboard.xml',
   ],
},
Including these files in the manifest guarantees that the dashboard assets are available in the backend.
Once this setup is done, you’ll have a working blank dashboard integrated into Odoo 19. From here, you can extend it further by adding widgets, charts, KPIs, or other interactive features to improve its functionality.
Creating Tiles in the Dashboard
In this step, we will build dashboard tiles and retrieve live data by making ORM calls through JavaScript.
HTML Structure for Tiles:
Include the given HTML code in the XML template
<div class="row main-section" style="margin-left: 120px;">
   <!-- Lead Tile-->
   <div id="leads" class="col-md-4 col-sm-6 tot_tasks oh-payslip"
        style=" overflow: hidden; padding-top: 30px;">
       <div class="oh-card" style="box-shadow:2px 4px 8px 2px rgba(0,0,0.3,0.2);
       display: flex; justify-content: center;" role="button">
           <div class="oh-card-body"
                style="padding: 5px 5px; float: left; width: 100%;
                 height: auto; box-sizing: border-box; margin: 0;">
               <div class="stat-widget-one">
                   <div class="stat-icon bg-mauve-light d-flex justify-content-left align-items-left">
                       <div style="background:#ff4d94; width:65px; text-align: center;">
                           <i class="fa fa-tasks text-mauve"
                              style="font-size:50px;"/>
                       </div>
                       <div class="stat_content" style="
                         text-align: center; font-weight: bold;
                         padding-top: 20px; padding-left: 80px;">
                           <div class="stat_count_lead"
                                style="font-size: 17px;">
                               <span id="templates">
                                    <div id="my_lead"/>
                               </span>
                           </div>
                           <div class="stat-head"
                                style="font-size: 14px;">My Leads
                           </div>
                       </div>
                   </div>
               </div>
           </div>
       </div>
   </div>
   <!-- Opportunity Tile-->
   <div id="opportunity" class="col-md-4 col-sm-6 tot_tasks oh-payslip"
        style=" overflow: hidden; padding-top: 30px;">
       <div class="oh-card" style="box-shadow:2px 4px 8px 2px rgba(0,0,0.3,0.2);
       display: flex; justify-content: center;" role="button">
           <div class="oh-card-body"
                style="padding: 5px 5px; float: left; width: 100%;
                 height: auto; box-sizing: border-box; margin: 0;">
               <div class="stat-widget-one">
                   <div class="stat-icon bg-mauve-light d-flex justify-content-left align-items-left">
                       <div style="background:yellow; width:65px; text-align: center;">
                           <i class="fa fa-trophy  text-mauve"
                              style="font-size:50px;"/>
                       </div>
                       <div class="stat-content" style="
                         text-align: center; font-weight: bold;
                         padding-top: 20px; padding-left: 80px;">
                           <div class="stat_count_opp"
                                style="font-size: 17px;">
                               <span id="templates">
                                    <div id="my_opportunity"/>
                               </span>
                           </div>
                           <div class="stat-head"
                                style="font-size: 14px;">My Opportunity
                           </div>
                       </div>
                   </div>
               </div>
           </div>
       </div>
   </div>
   <!-- Expected Revenue -->
   <div id="expected_revenue"
        class="col-md-4 col-sm-6 tot_tasks oh-payslip"
        style=" overflow: hidden; padding-top: 30px;">
       <div class="oh-card" style="box-shadow:2px 4px 8px 2px rgba(0,0,0.3,0.2);
       display: flex; justify-content: center;" role="button">
           <div class="oh-card-body"
                style="padding: 5px 5px; float: left; width: 100%;
                 height: auto; box-sizing: border-box; margin: 0;">
               <div class="stat-widget-one">
                   <div class="stat-icon bg-mauve-light d-flex justify-content-left align-items-left">
                       <div style="background:#bf80ff;; width:65px; text-align: center;">
                           <i class="fa fa-usd  text-mauve"
                              style="font-size:50px;"/>
                       </div>
                       <div class="stat-content" style="
                         text-align: center; font-weight: bold;
                         padding-top: 20px; padding-left: 80px;">
                           <div class="stat_count_ex_rev"
                                style="font-size: 17px;">
                               <span id="templates">
                                    <div id="revenue"/>
                               </span>
                           </div>
                           <div class="stat-head"
                                style="font-size: 14px;">Expected
                               revenue
                           </div>
                       </div>
                   </div>
               </div>
           </div>
       </div>
   </div>
</div>
Fetching Data using JavaScript ORM Call:
/** @odoo-module **/
import { registry } from "@web/core/registry";
import { useService } from "@web/core/utils/hooks";
import { Component } from  "@odoo/owl";
const actionRegistry = registry.category("actions");
class CrmDashboard extends Component {
  setup() {
        super.setup();
        this.orm = useService('orm');
        this._fetch_data();
  }
  async _fetch_data(){
     let result = await this.orm.call("crm.lead", "get_tiles_data", [], {});
     document.getElementById('my_lead').innerHTML = `<span>${result.total_leads}</span>`;
     document.getElementById('my_opportunity').innerHTML = `<span>${result.total_opportunity}</span>`;
     document.getElementById('revenue').innerHTML = `<span>${result.currency}${result.expected_revenue}</span>`;
  }
}
CrmDashboard.template = "my_module.CrmDashboard";
actionRegistry.add("crm_dashboard_tag", CrmDashboard);
Fetching Data from the Model (crm.lead):
from odoo import models, api
class CrmLead(models.Model):
   _inherit = 'crm.lead'
   @api.model
   def get_tiles_data(self):
       company_id = self.env.company
       leads = self.search([('company_id', '=', company_id.id),
                            ('user_id', '=', self.env.user.id)])
       my_leads = leads.filtered(lambda r: r.type == 'lead')
       my_opportunity = leads.filtered(lambda r: r.type == 'opportunity')
       currency = company_id.currency_id.symbol
       expected_revenue = sum(my_opportunity.mapped('expected_revenue'))
       return {
           'total_leads': len(my_leads),
           'total_opportunity': len(my_opportunity),
           'expected_revenue': expected_revenue,
           'currency': currency,
       }
The get_tiles_data() function collects information from the crm.lead model, including the count of leads, the count of opportunities, and the total expected revenue for the currently logged-in user within their company.
The resulting dashboard will present tiles that highlight key CRM statistics such as total leads, opportunities, and aggregated expected revenue.
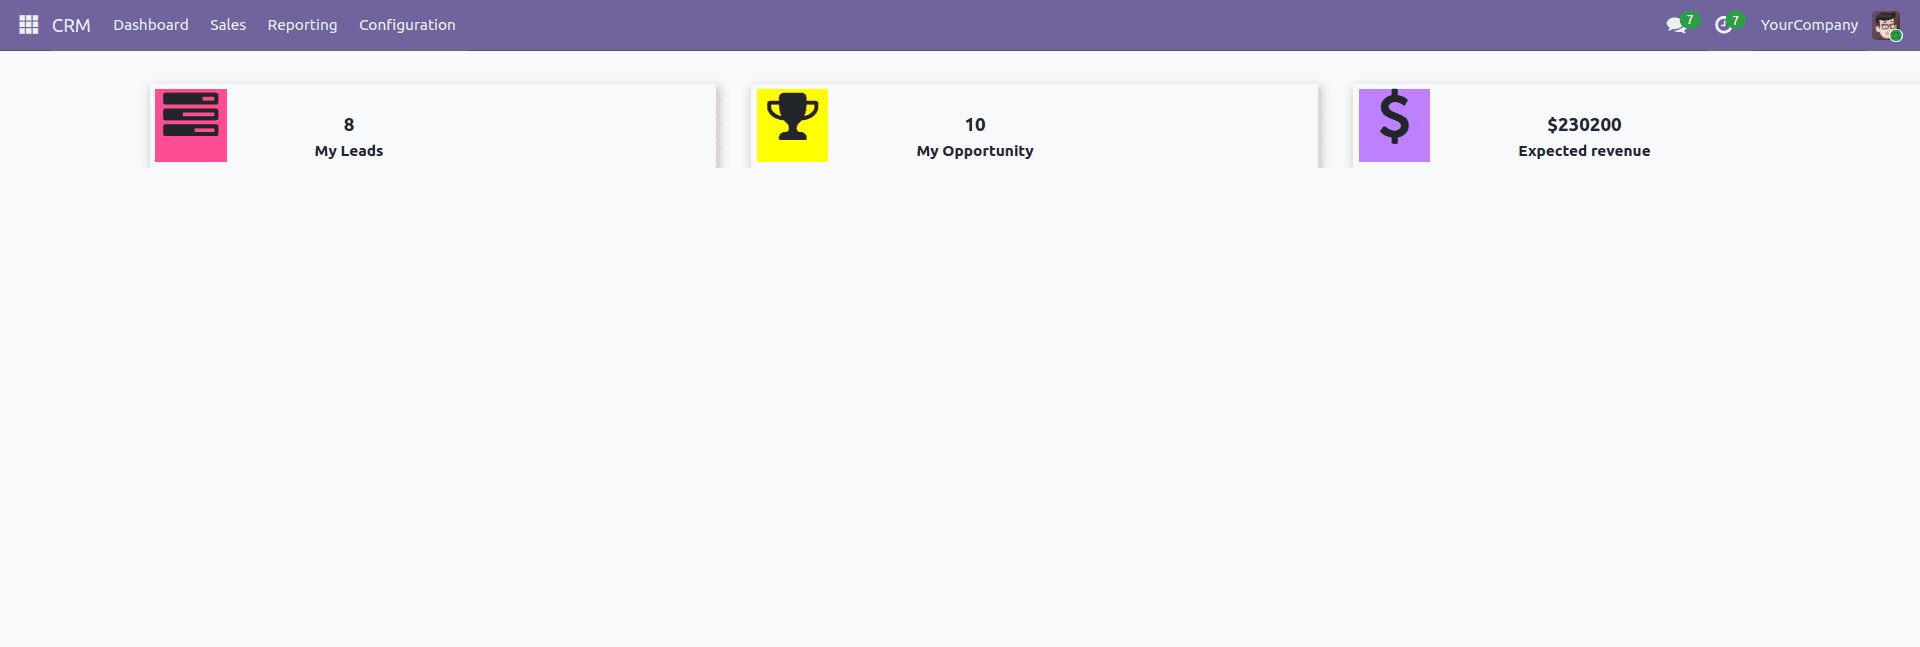
This dashboard offers a straightforward way to present essential CRM insights using dynamically updated tiles. Each tile reflects real-time data, allowing users to quickly track performance indicators such as leads, opportunities, and revenue.
You can extend this setup by adding interactive charts, graphs, or filters to visualize trends over time, compare metrics between teams, or drill down into specific data points — making the dashboard more insightful and tailored to your business needs.
To read more about How to Create Dashboard in Odoo 18, refer to our blog How to Create Dashboard in Odoo 18.