Performance analysis is one of the most important tasks when working with PostgreSQL internals. While query plans and logs provide useful information, they often do not show what is happening deep inside the PostgreSQL execution engine.
FlameGraph is a powerful profiling visualization tool that helps developers understand execution flow inside applications. It is widely used for Linux kernel analysis, database profiling, and low-level system optimization.
The complete setup and execution process shown in this guide was tested on Ubuntu with PostgreSQL 18.
What is FlameGraph?
A FlameGraph is a visualization of sampled stack traces collected during program execution.
It helps developers identify:
- CPU-intensive functions
- Internal execution paths
- Function call hierarchy
- Query execution bottlenecks
- Expensive PostgreSQL operations
Instead of reading complex profiling data manually, FlameGraph converts the information into an interactive SVG image where each block represents a function call.
The wider the block, the more CPU time the function consumes.
Why Use FlameGraph for PostgreSQL?
PostgreSQL internally executes hundreds of functions during query execution. Understanding these functions manually from source code can be difficult.
FlameGraph helps visualize:
- Heap insert operations
- Executor workflow
- WAL writing activity
- Buffer management
- Tuple processing
This makes FlameGraph extremely useful for:
- PostgreSQL source code exploration
- Performance optimization
- Database research
- Learning PostgreSQL internals
- Identifying bottlenecks in custom PostgreSQL modifications
The following environment was used:
- Ubuntu 22.04
- PostgreSQL 18.4
- Linux perf tool
- FlameGraph toolkit
Step 1: Verify perf Tool Installation
First, verify that the Linux perf tool is available.
perf --version
Example output:
perf version 6.8.12
If perf is not installed, install the required Linux tools.
sudo apt install linux-tools-common linux-tools-generic
The perf tool is responsible for collecting CPU stack samples during PostgreSQL execution.
Step 2: Clone the FlameGraph Repository
Next, download the FlameGraph toolkit from GitHub.
git clone https://github.com/brendangregg/FlameGraph.git
This repository contains scripts used to convert perf output into interactive flamegraphs.
Now check the files that actually exist inside the Flamegraph folder.
ls FlameGraph/
Result
aix-perf.pl                example-perf-stacks.txt.gz  postgres.svg                     stackcollapse-elfutils.pl         stackcollapse-jstack.pl       stackcollapse-sample.awk   test
demos                      example-perf.svg            range-perf.pl                    stackcollapse-faulthandler.pl     stackcollapse-ljp.awk         stackcollapse-stap.pl      test.sh
dev                        files.pl                    README.md                        stackcollapse-gdb.pl              stackcollapse-perf.pl         stackcollapse-vsprof.pl
difffolded.pl              flamegraph.pl               record-test.sh                   stackcollapse-go.pl               stackcollapse-perf-sched.awk  stackcollapse-vtune-mc.pl
docs                       jmaps                       stackcollapse-aix.pl             stackcollapse-ibmjava.pl          stackcollapse.pl              stackcollapse-vtune.pl
example-dtrace-stacks.txt  out.folded                  stackcollapse-bpftrace.pl        stackcollapse-instruments.pl      stackcollapse-pmc.pl          stackcollapse-wcp.pl
example-dtrace.svg         pkgsplit-perf.pl            stackcollapse-chrome-tracing.py  stackcollapse-java-exceptions.pl  stackcollapse-recursive.pl    stackcollapse-xdebug.php
Step 3: Identify PostgreSQL Process ID
PostgreSQL must be running before profiling.
Use the following command to identify the PostgreSQL backend process listening on port 5432.
sudo lsof -i :5432
Example output:
COMMAND   PID     USER   FD   TYPE DEVICE SIZE/OFF NODE NAME
postgres 1633 postgres    6u  IPv4    879      0t0  TCP localhost:postgresql (LISTEN)
Here:
This PID will be used by perf to monitor PostgreSQL execution.
Step 4: Start Profiling PostgreSQL
Now start CPU profiling using perf by the following command.
sudo perf record -F 99 -p <pid> -g -- sleep 30
Now replace the with the actual process id of postgres like this
sudo perf record -F 99 -p 1633 -g -- sleep 30
Explanation of parameters:
- F 99 - Collect 99 samples per second
- p 1633 - Attach profiling to PostgreSQL PID
- g - Capture call graphs
- sleep 30 - Record profiling data for 30 seconds
During these 30 seconds, execute PostgreSQL queries.
[ perf record: Woken up 1 times to write data ]
[ perf record: Captured and wrote 0.095 MB perf.data (241 samples) ]
The profiling data will be stored in a file named:
perf.data
Step 5: Execute PostgreSQL Queries During Profiling
While perf recording is active, open PostgreSQL and execute workload queries.
Switch to the postgres user:
sudo su postgres
Open PostgreSQL shell:
psql
Example workload:
CREATE TABLE test(id int, age int);
INSERT INTO test
SELECT generate_series(1,1000000);
INSERT INTO test
SELECT generate_series(1,10000000);
INSERT INTO test
SELECT generate_series(1,100000000);
These large insert operations force PostgreSQL to execute many internal functions related to:
- Heap insertion
- WAL writing
- Memory allocation
- Buffer management
- Executor processing
This produces meaningful profiling data for FlameGraph analysis.
Step 6: Generate perf Script Output
After recording is completed, convert the binary perf data into readable stack traces.
sudo perf script > out.perf
This generates:
out.perf
The file contains raw stack traces collected during PostgreSQL execution.
Step 7: Convert Stack Traces into Folded Format
Navigate into the FlameGraph directory.
cd FlameGraph/
Now collapse the stack traces into folded format.
./stackcollapse-perf.pl ~/out.perf > out.folded
This converts large stack traces into a compact format suitable for flamegraph generation.
Step 8: Generate the FlameGraph
Generate the final FlameGraph SVG image.
./flamegraph.pl out.folded > postgres.svg
Verify the generated file:
ls -lh postgres.svg
Example output:
-rw-rw-r-- 1 cybrosys cybrosys 91K Jun 3 12:56 postgres.svg
The generated SVG file contains the complete interactive FlameGraph.
Step 9: Open the FlameGraph
Open the SVG file in Firefox or any modern browser.
firefox postgres.svg
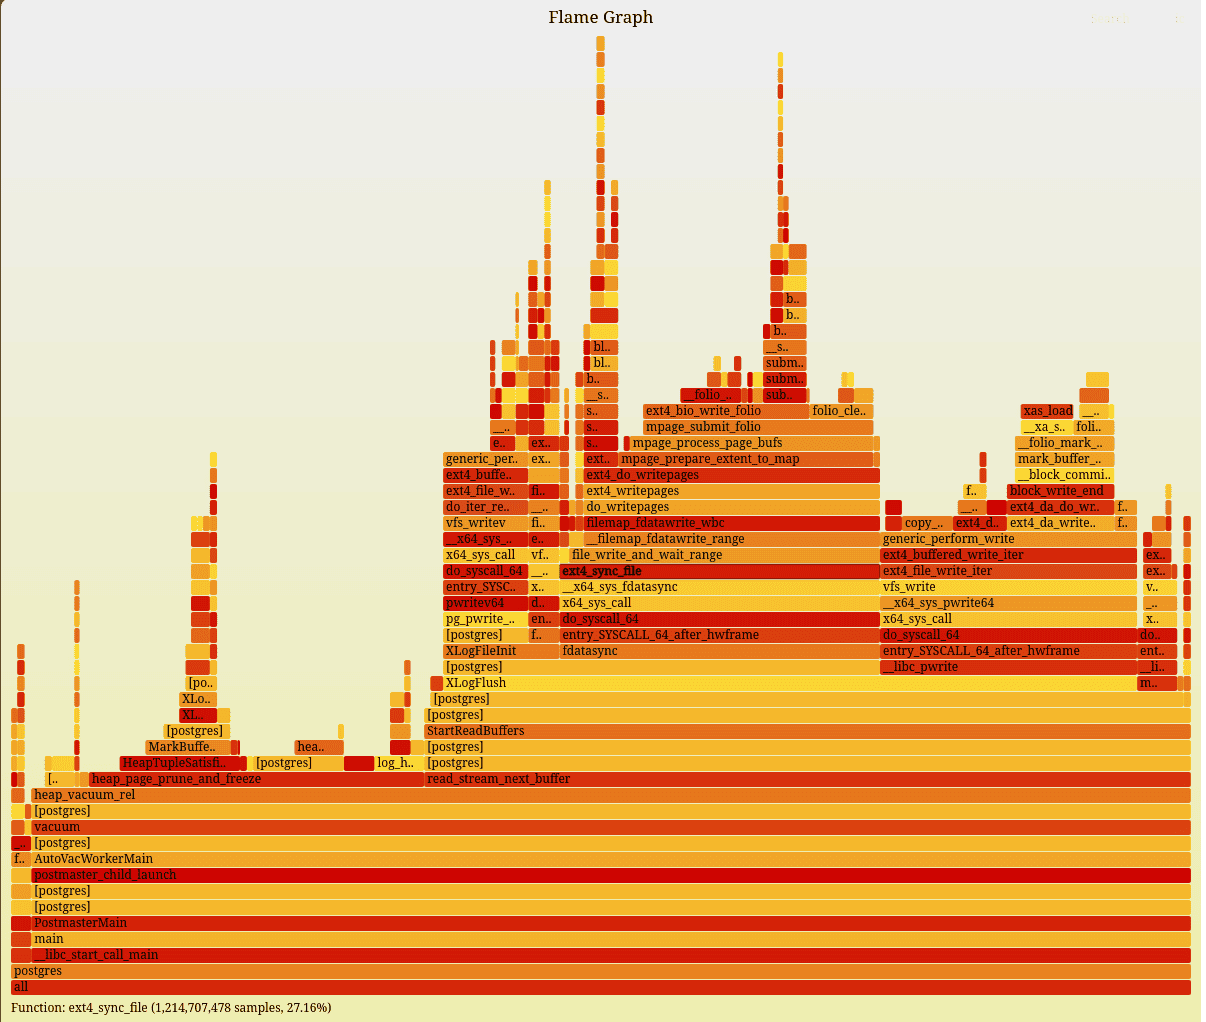
The FlameGraph visualization will now appear.
Example :
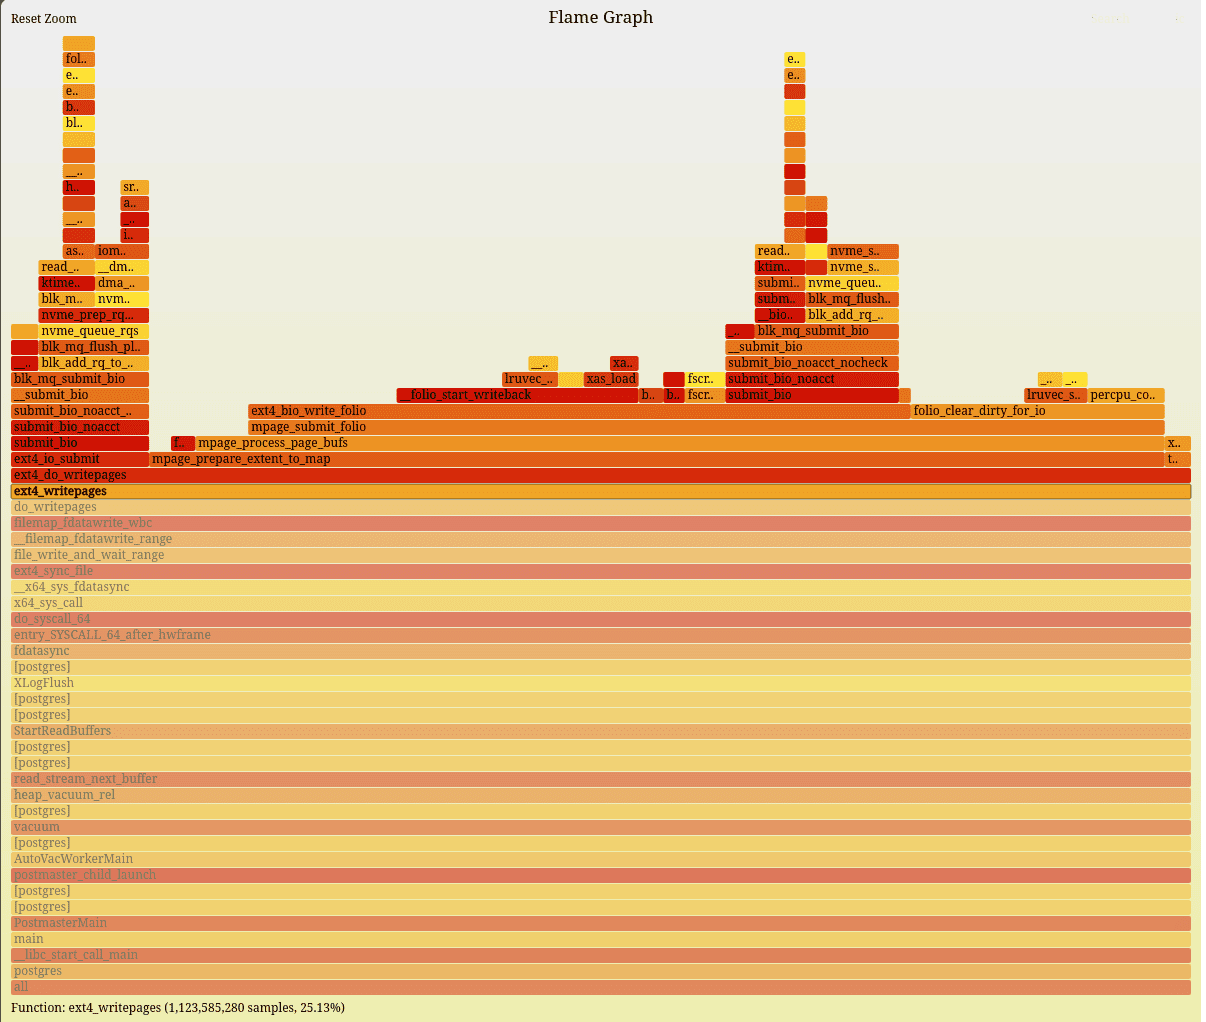
When we click on the functions, we get a more detailed image like this
Understanding the FlameGraph
Each rectangle in the FlameGraph represents a function call.
Important concepts:
- Width of block - CPU time consumed
- Vertical stack - Function call hierarchy
- Bottom functions - Parent callers
- Top functions - Leaf functions
- Wide functions - Performance-heavy operations
When clicking on a function, the browser zooms into that execution path.
This helps analyze PostgreSQL internals more deeply.
Example Analysis
During profiling, functions related to PostgreSQL storage and write operations become visible.
For example:
- heap_insert
- ExecInsert
- standard_ExecutorRun
- XLogInsert
- BufTableLookup
- smgrwrite
- dowrite
If the dowrite function appears large in the FlameGraph, it may indicate intensive disk write activity.
By zooming into the function hierarchy, developers can understand:
- Which PostgreSQL subsystem consumed CPU
- Which internal functions were heavily executed
- Which execution path led to storage operations
This is extremely useful while exploring PostgreSQL source code.
Why This is Useful for PostgreSQL Developers
FlameGraph becomes highly valuable when:
- Modifying PostgreSQL source code
- Exploring executor internals
- Working on table access methods
- Optimizing insert operations
- Investigating bottlenecks
Instead of reading thousands of lines of source code blindly, FlameGraph provides a visual execution map of PostgreSQL internals.
Advantages of Using FlameGraph
1. Visual Performance Analysis
Provides a graphical understanding of PostgreSQL execution flow.
2. Detect CPU Hotspots
Identifies expensive functions quickly.
3. Understand PostgreSQL Internals
Helps developers learn PostgreSQL architecture practically.
4. Useful for Source Code Optimization
Very useful when modifying PostgreSQL internals.
5. Interactive Exploration
Allows zooming into detailed execution paths.
FlameGraph is one of the most powerful tools for understanding PostgreSQL internals and analyzing performance behavior visually.
By combining:
- Linux perf
- PostgreSQL workload execution
- FlameGraph visualization
developers can deeply inspect PostgreSQL execution paths and identify performance bottlenecks effectively.
For PostgreSQL source code learners and performance engineers, FlameGraph provides a practical method to connect SQL execution with actual internal function calls.