pgNow is a lightweight PostgreSQL monitoring tool from Redgate that helps developers and DBAs understand what’s happening inside their database in real time. It provides clear visibility into active workloads, sessions, and query execution, making it easier to spot slow queries and performance bottlenecks.
With pgNow, you can track running sessions, analyze query behavior, review index usage, and view vacuum-related activity from a simple graphical interface. The tool also offers practical recommendations to improve database health, such as identifying unused indexes or highlighting queries that need optimization. Overall, pgNow is designed to simplify day-to-day PostgreSQL performance monitoring and help you make faster, data-driven tuning decisions
Installation
First, download the pgNow installer from the official website.
https://www.red-gate.com/products/redgate-pgnow/installer/
After extracting the downloaded package, open a terminal and move into the pgNow directory:
cd pgNowLinuxX64/
Next, give execution permission to the pgNow binary:
chmod +x pgNow
Now launch the application
./pgNow
Then it goes to an email signup, and after these login procedures, you can see an interface like this
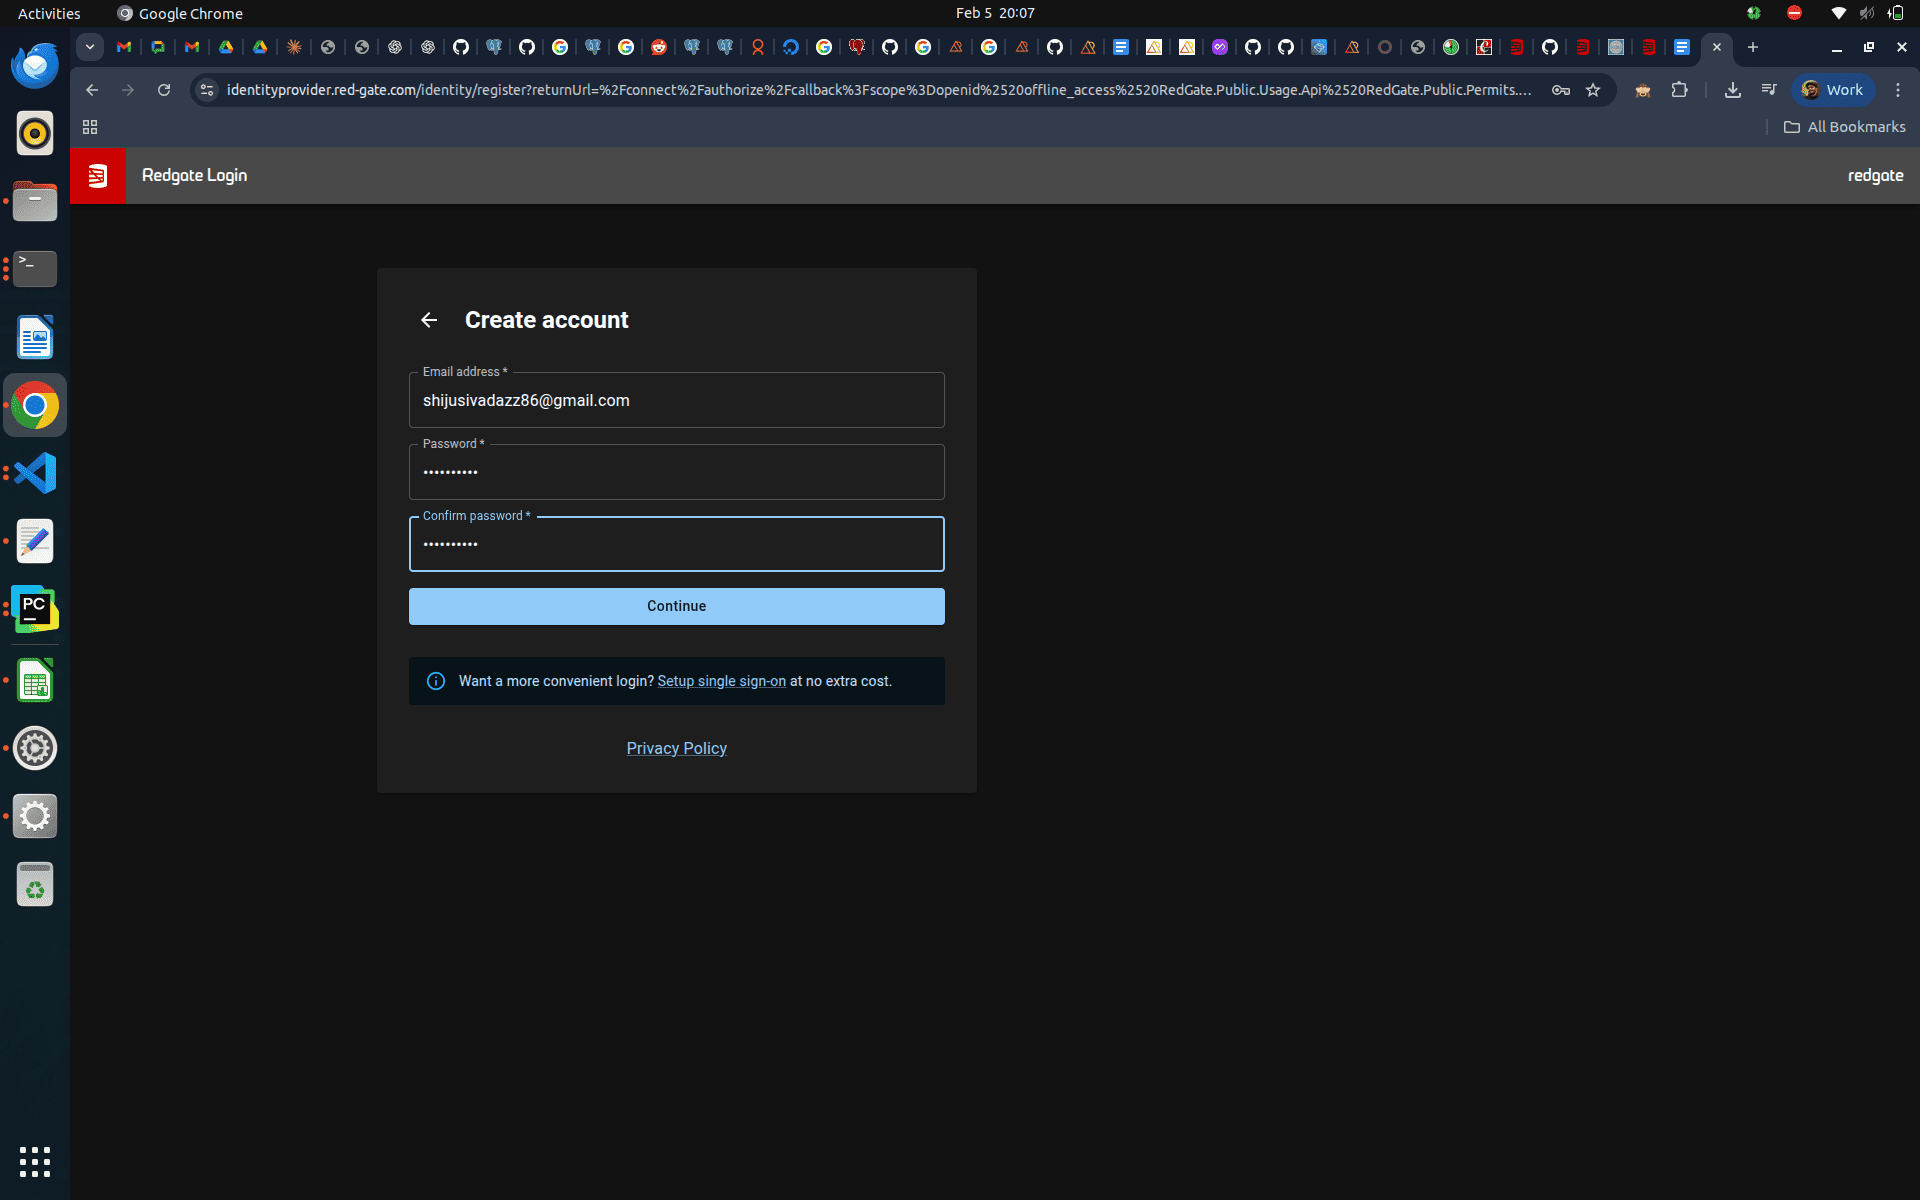
Agree to their policies and start using this monitoring tool.
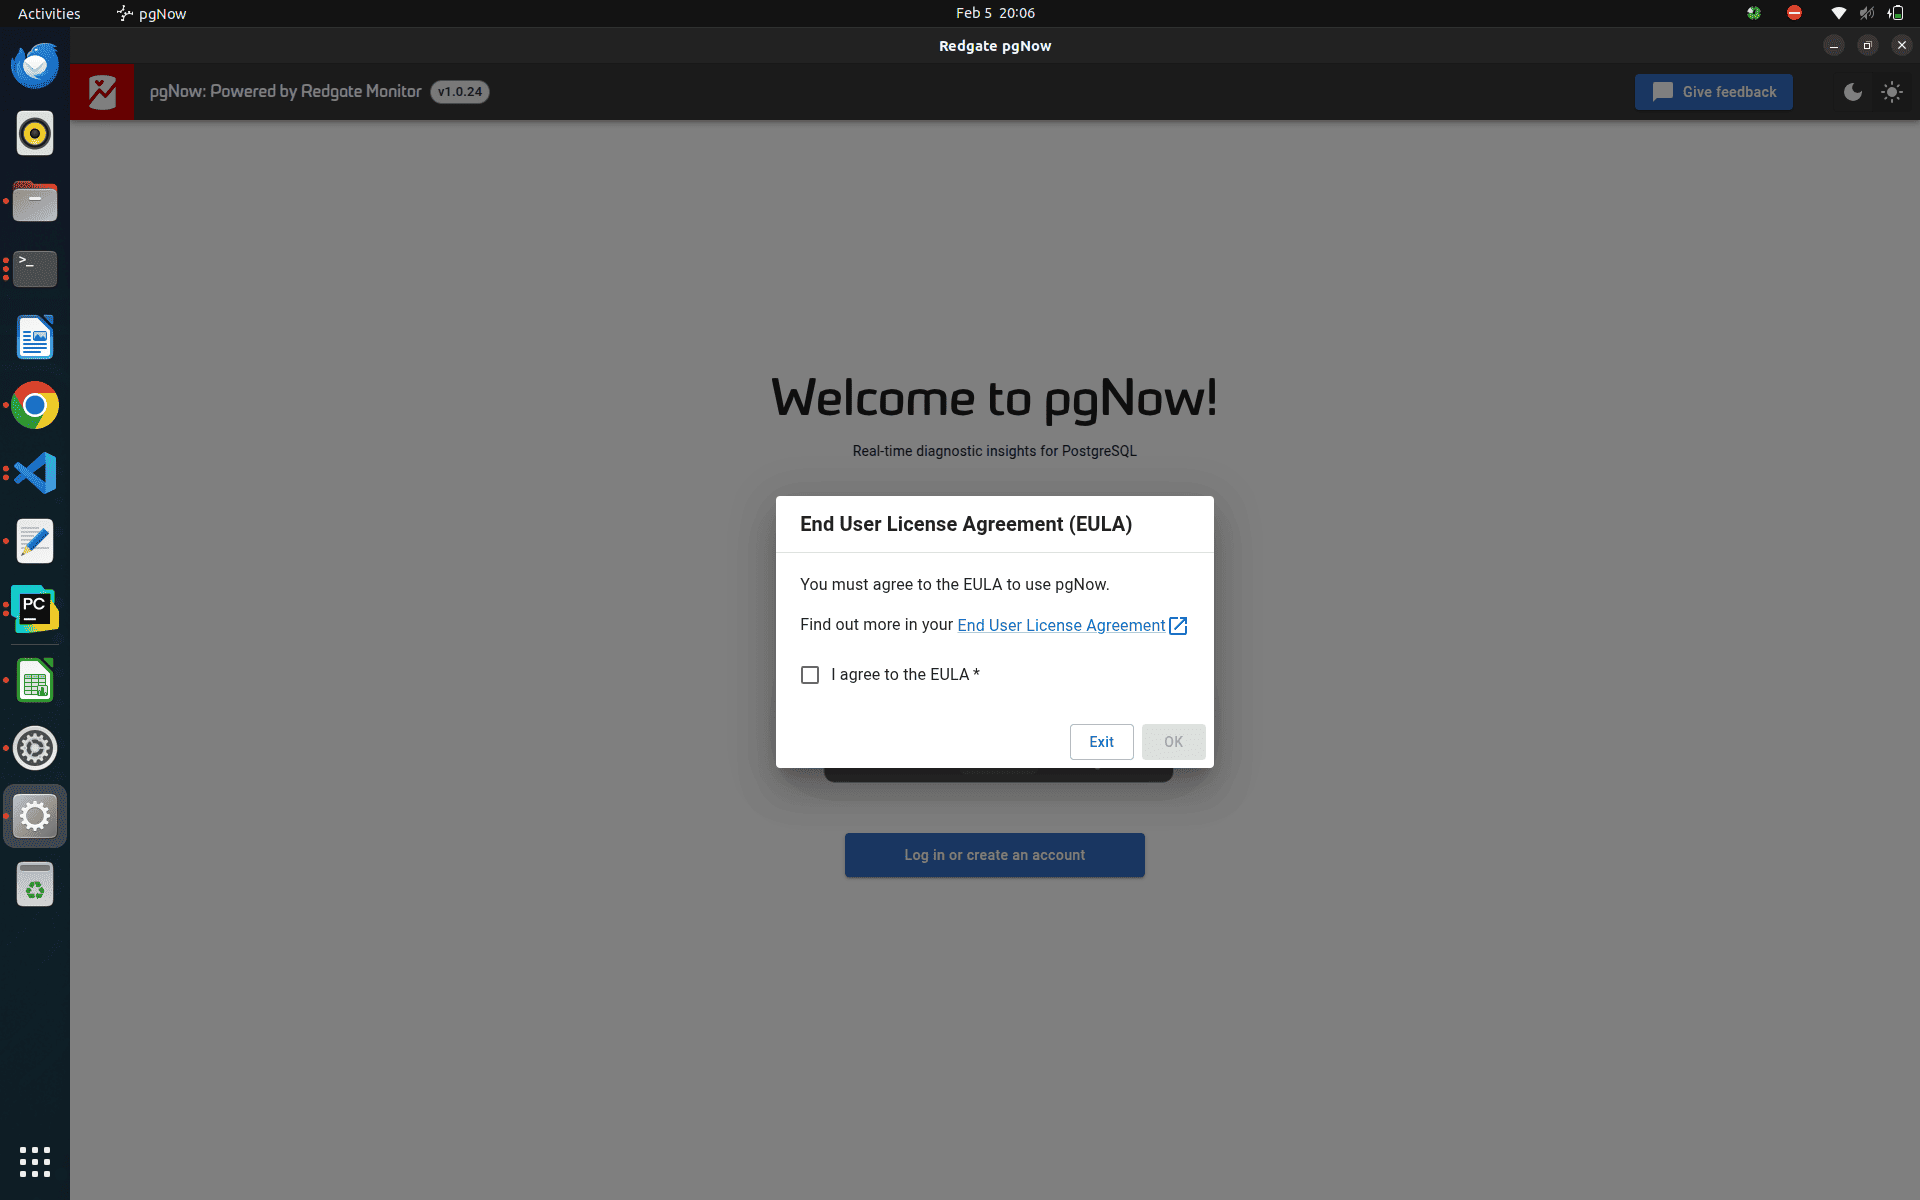
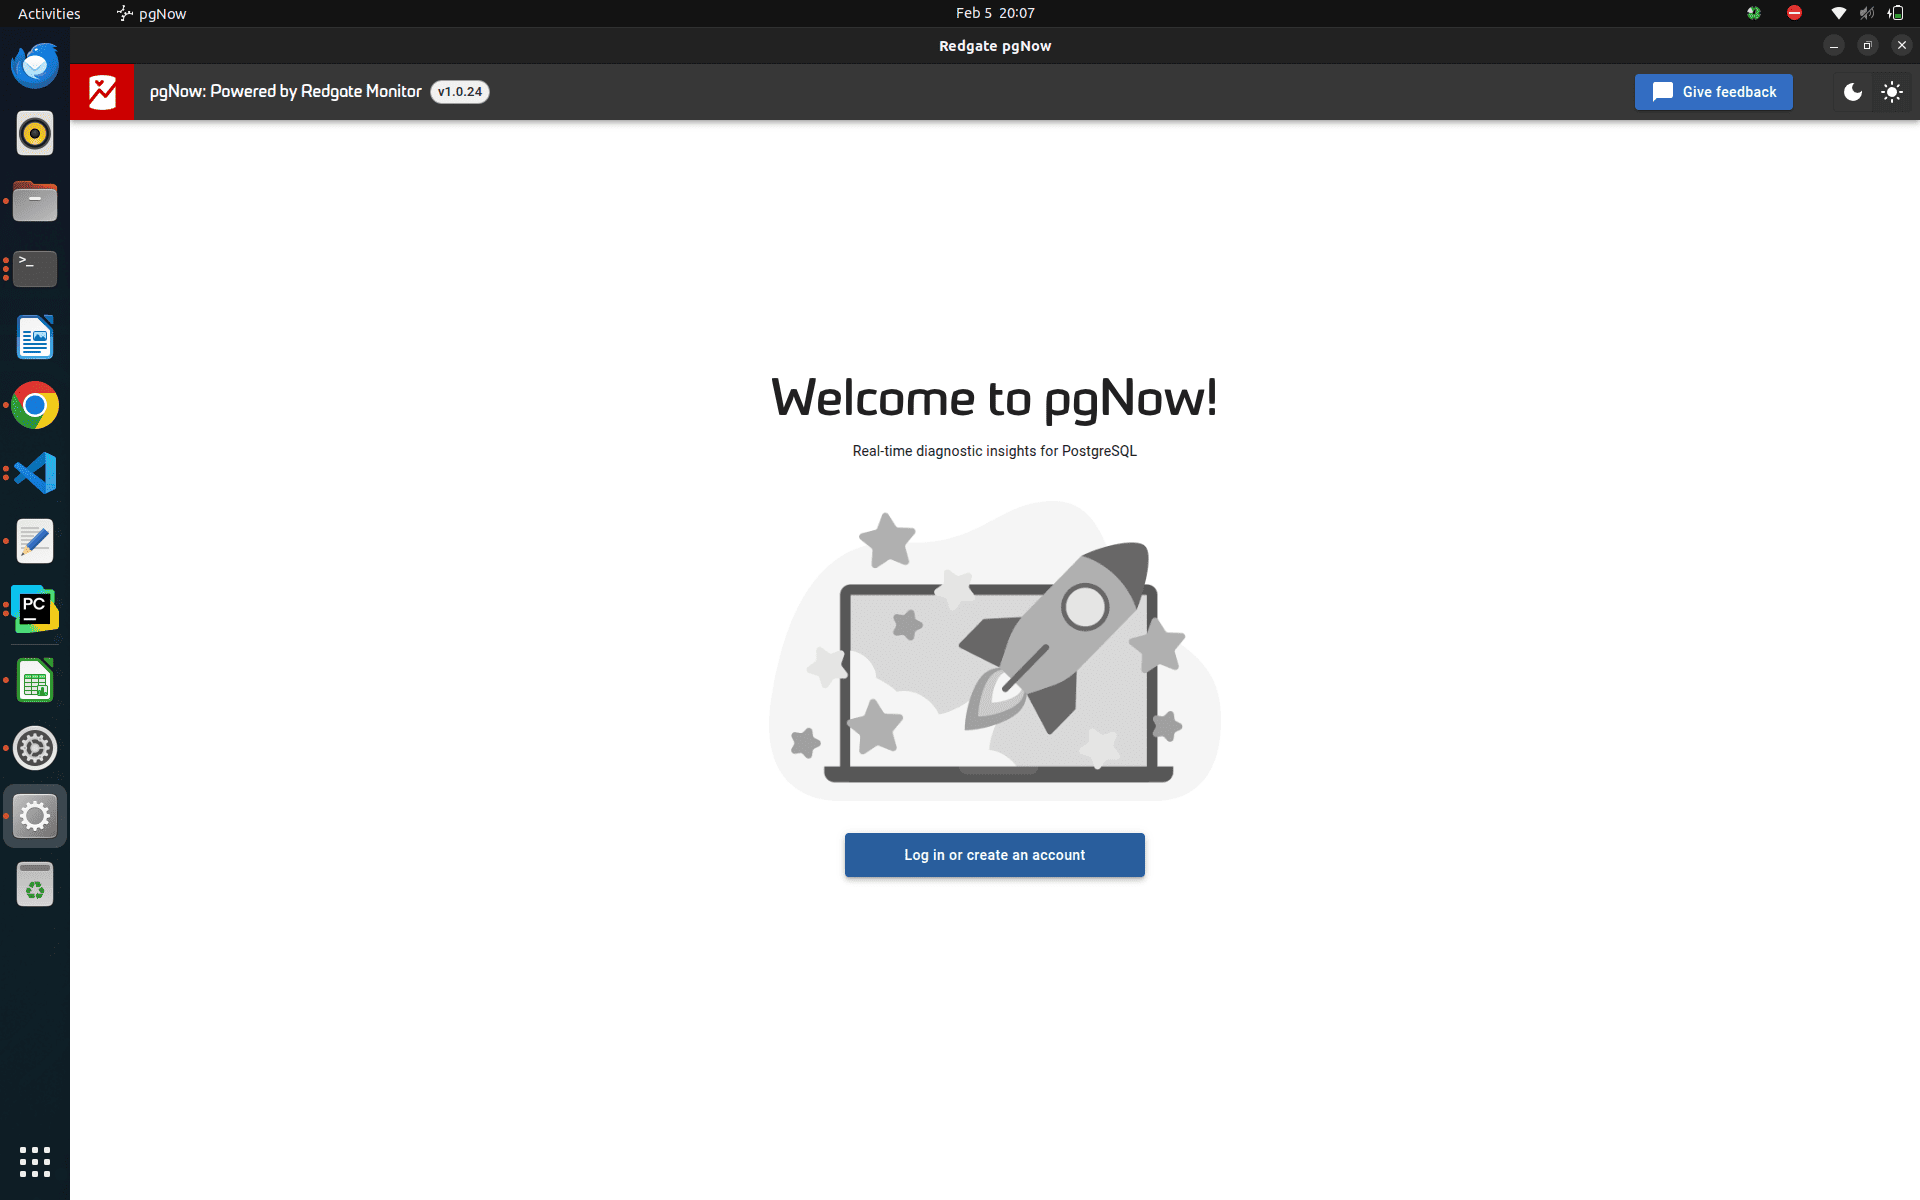
After the successful account validation, again try to log in and then use this monitoring tool.
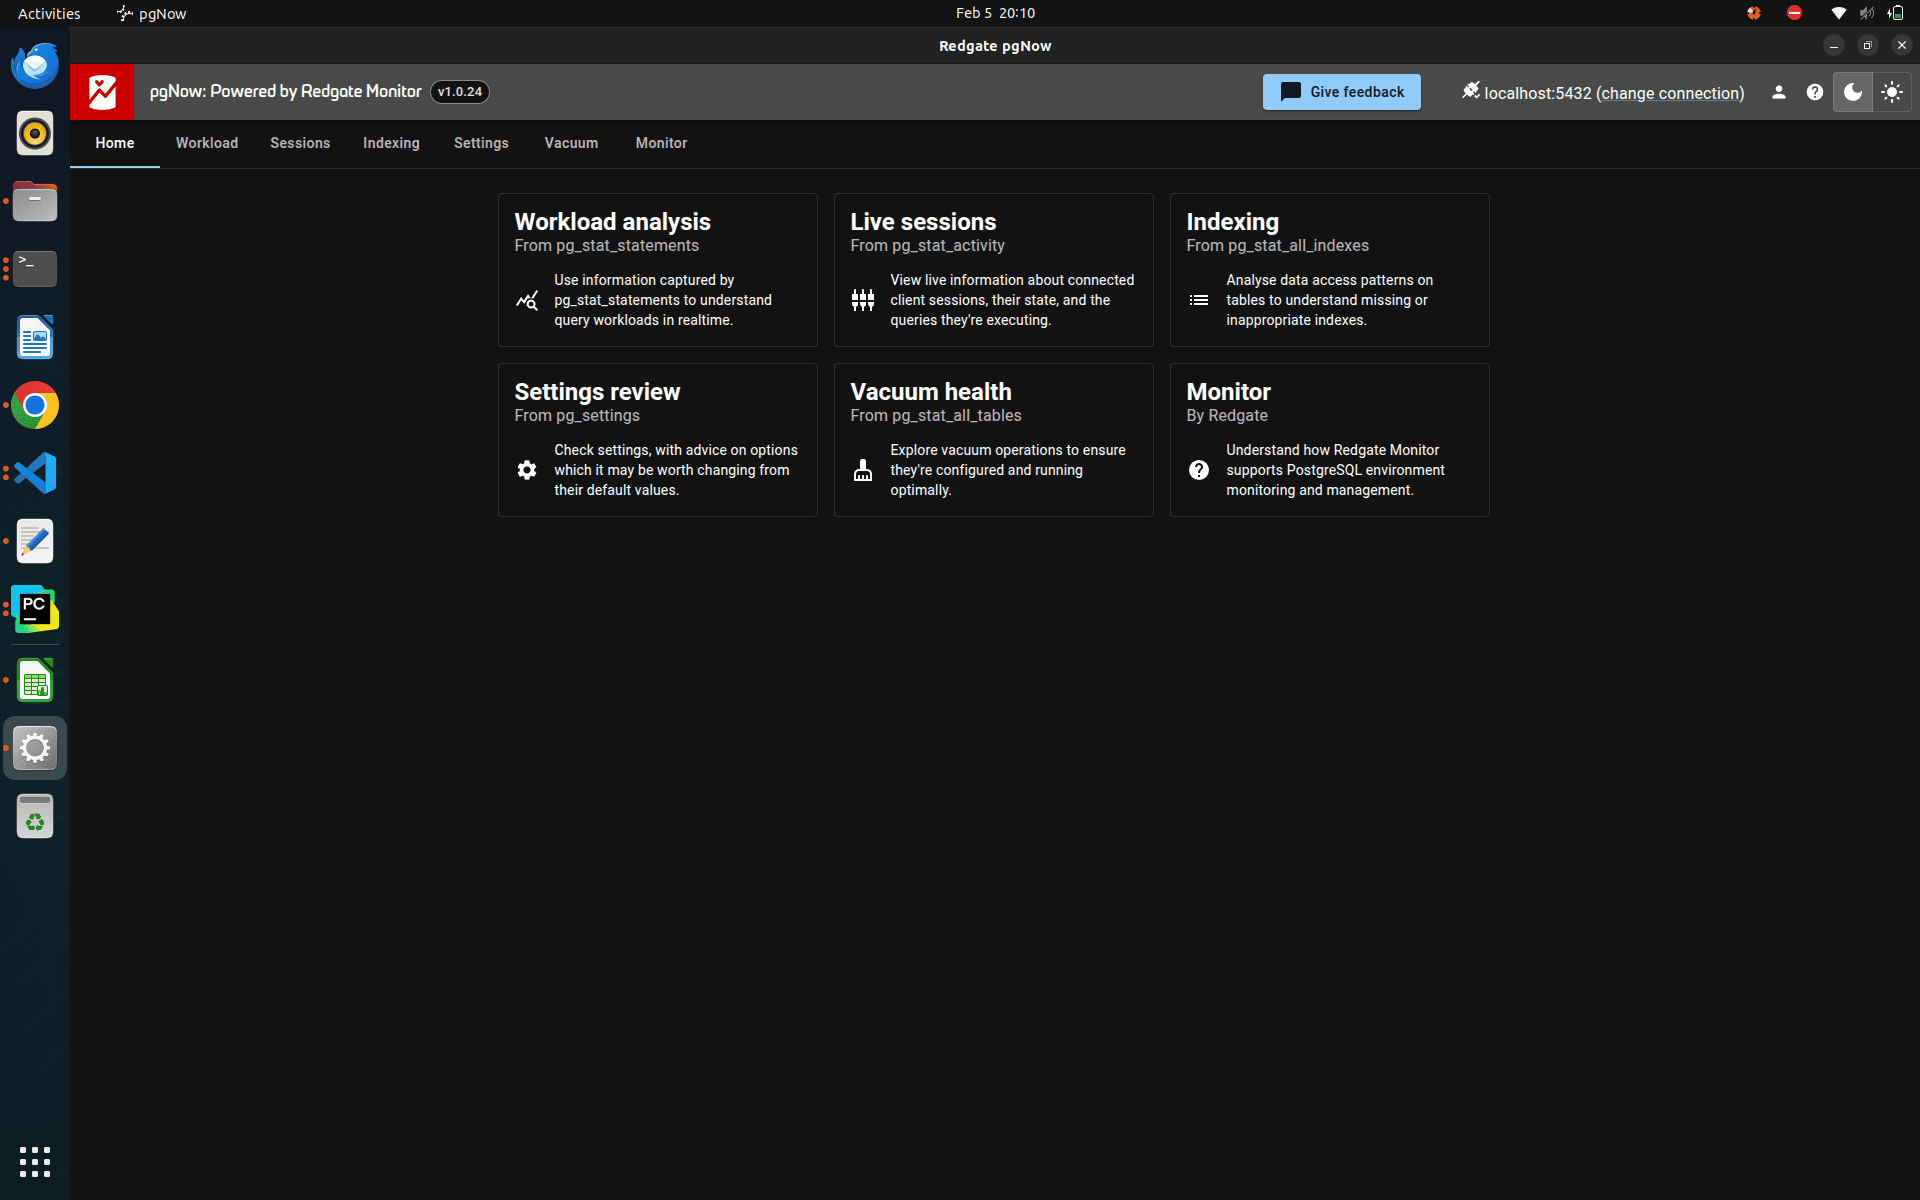
The user can enter their server ip address, username, password, database name, and port to connect to that database
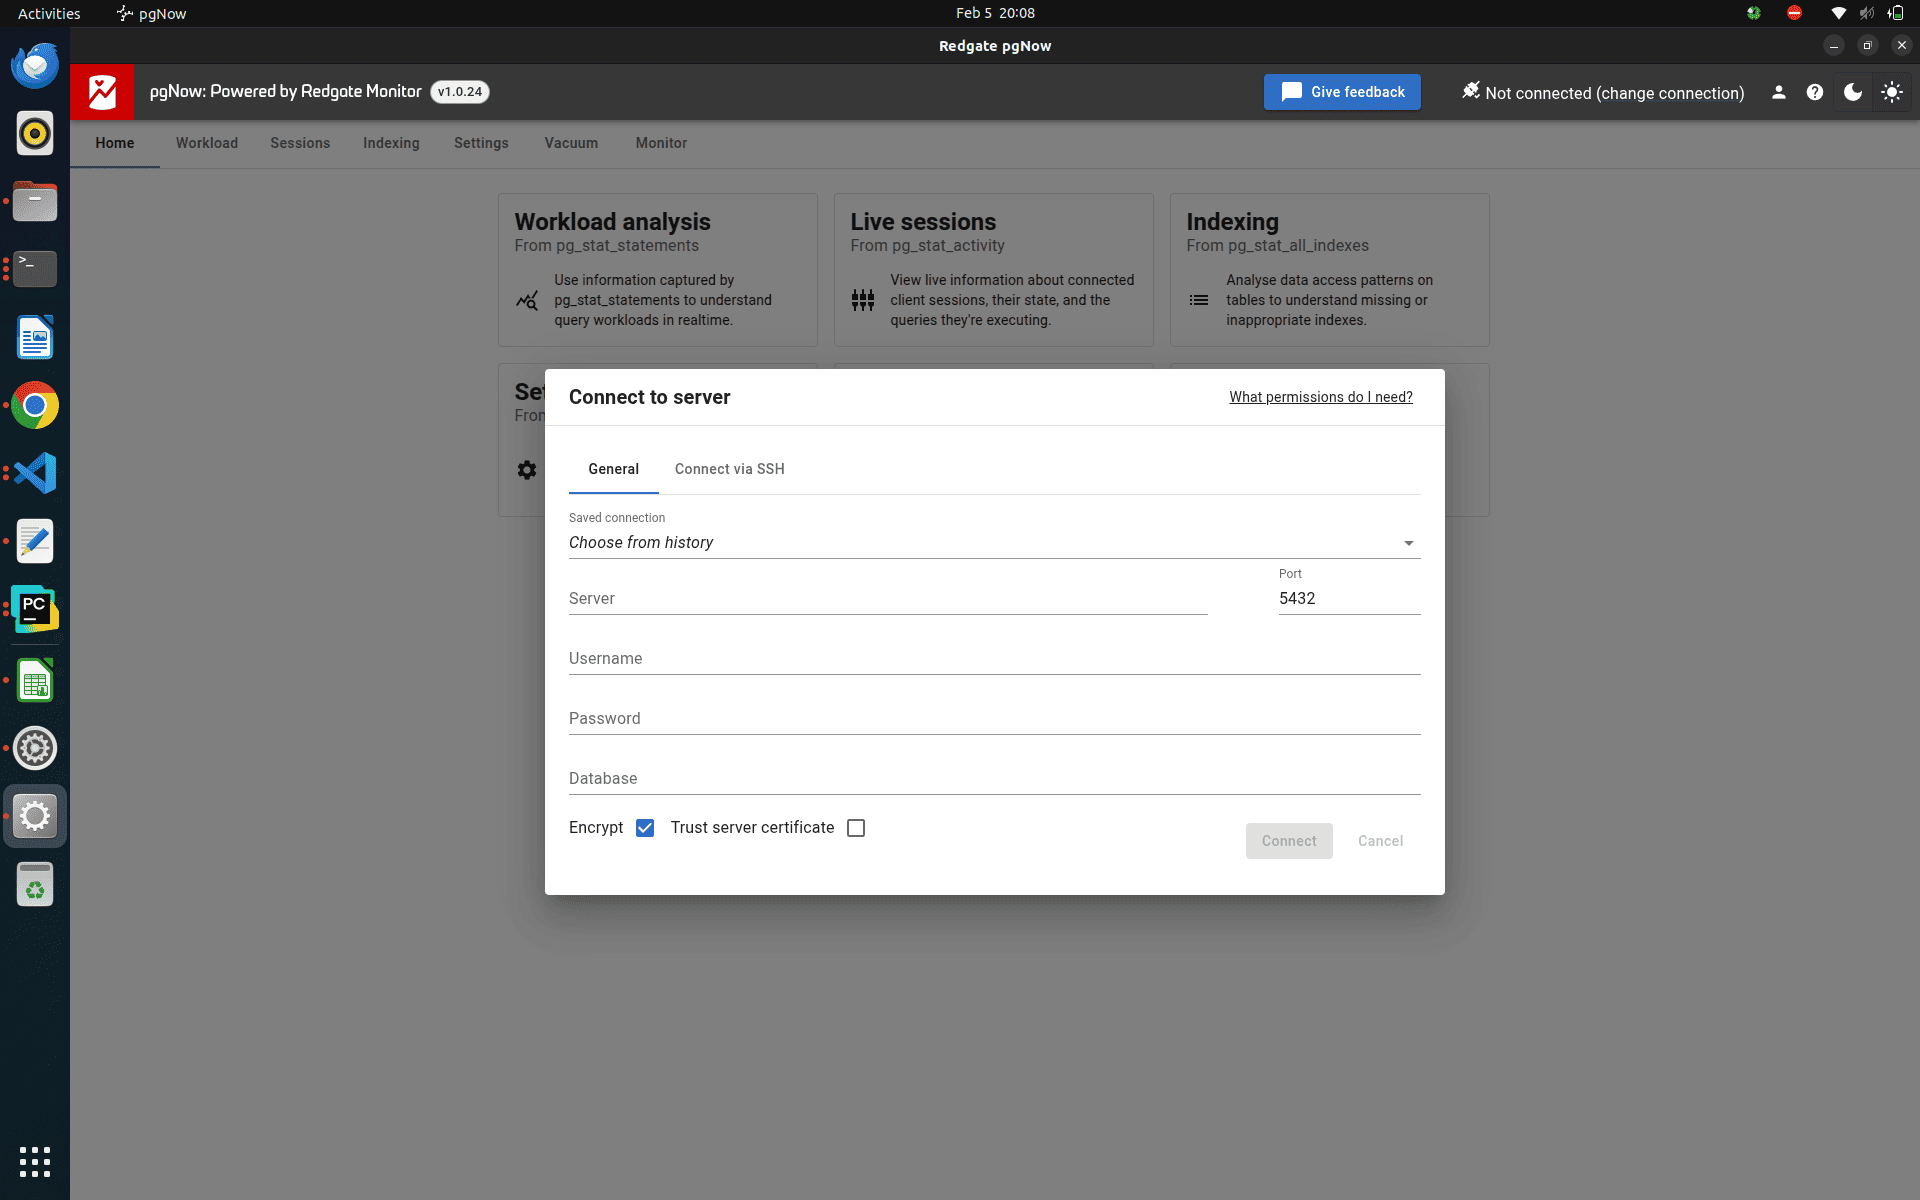
Users can switch between light mode and dark mode based on their preference. Through this interface, they can choose different options to monitor and analyze their PostgreSQL database.
The tool provides insights into workload performance, active sessions, index usage, and PostgreSQL configuration settings, along with their values, and vacuum-related activity. These features help users better understand database behavior and identify areas for optimization.
Before using pgNow, the pg_stat_statements extension must be installed on the PostgreSQL instance being monitored.
Additionally, the PostgreSQL parameter shared_preload_libraries must be set to pg_stat_statements to enable query statistics collection.
So, find the path of the Postgres configuration file
sudo su postgres
psql
show config_file;
You get a result like this
              config_file
-----------------------------------------
 /etc/postgresql/17/main/postgresql.conf
(1 row)
Edit this file
sudo nano /etc/postgresql/17/main/postgresql.conf
Search for the parameter named shared_preload_libraries and set the value of this parameter to pg_stat_statements
shared_preload_libraries = 'pg_stat_statements'
Then restart the PostgreSQL
sudo systemctl restart postgresql@18-main.service
Then again, check the value of shared_preload_libraries from the psql terminal
show shared_preload_libraries ;
You get results like this
     shared_preload_libraries
------------------------------------
     pg_stat_statements
(1 row)
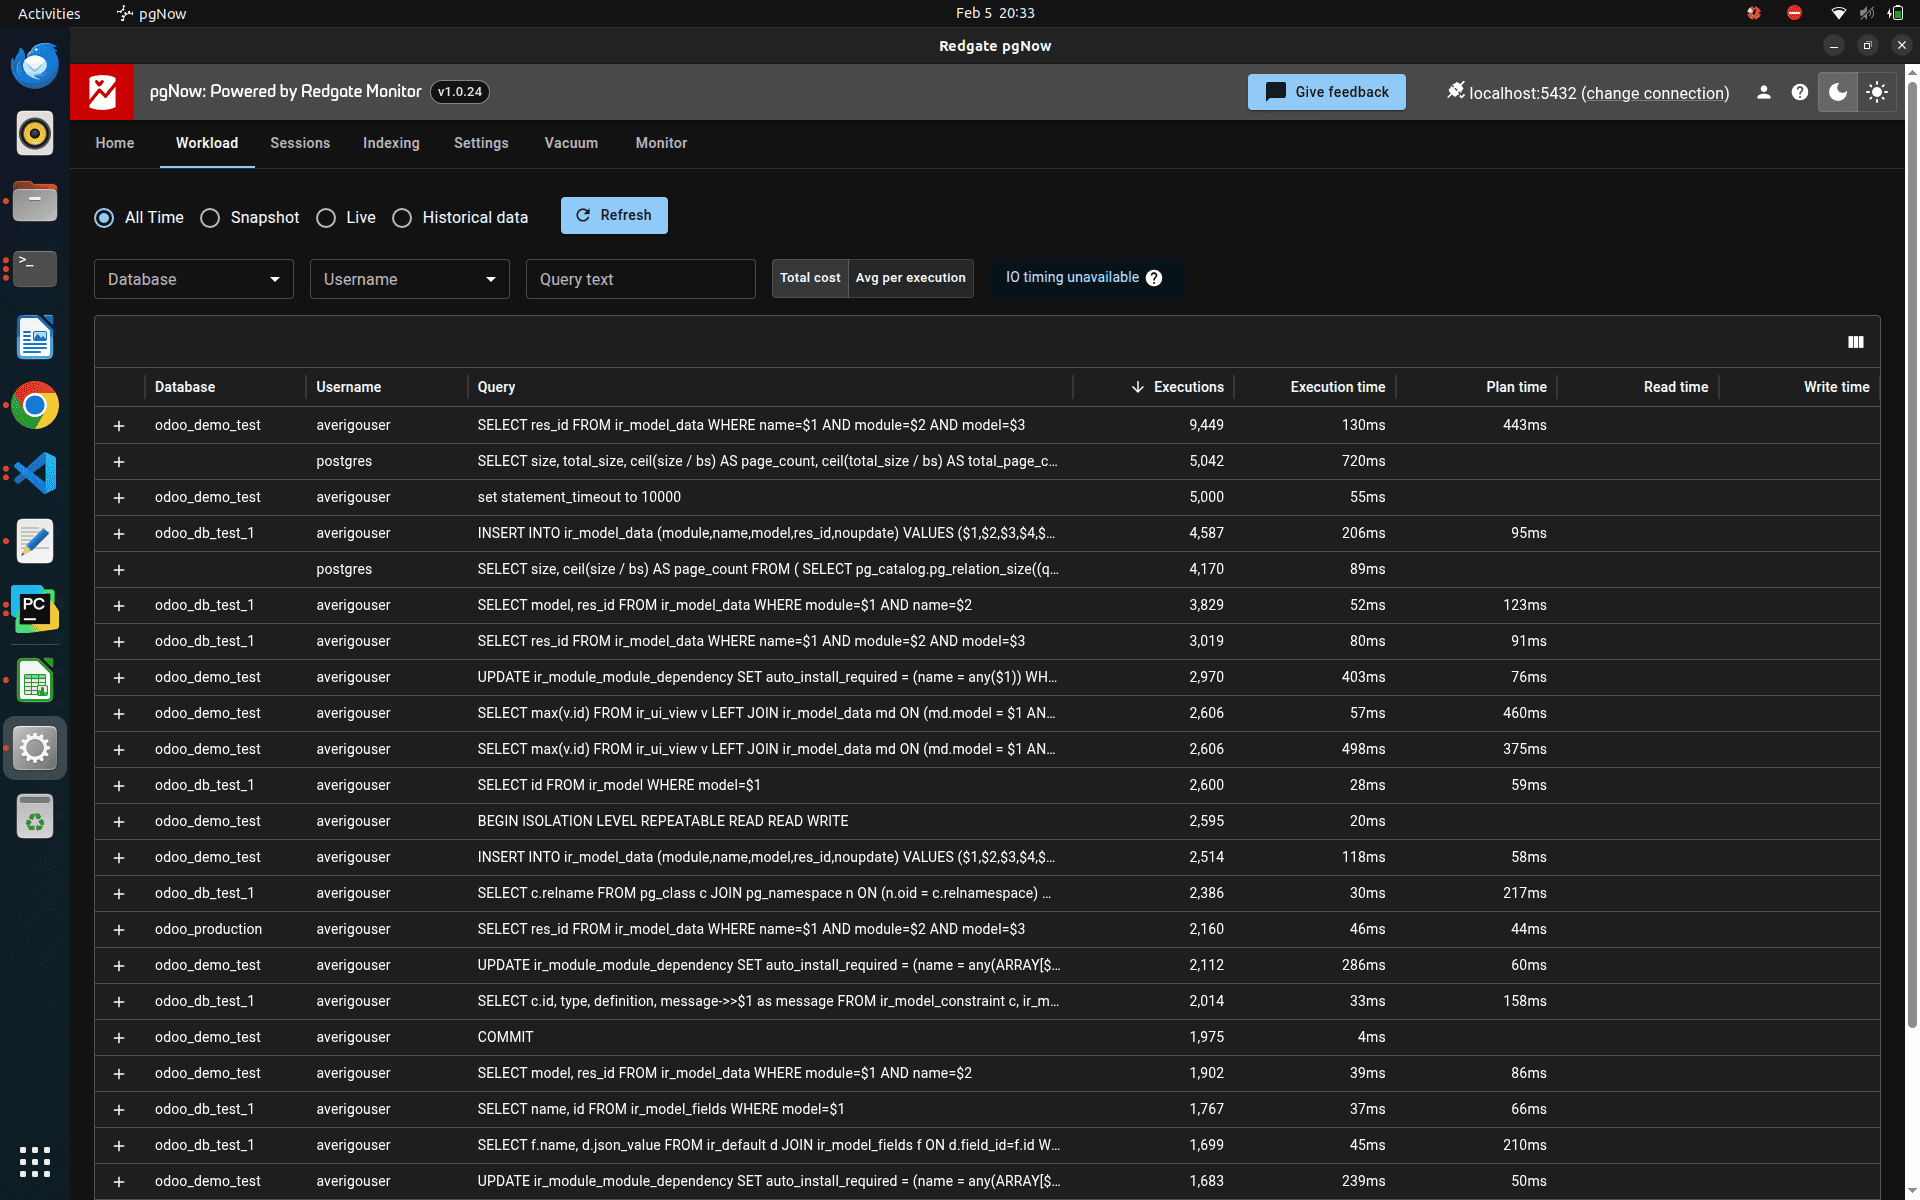
Once the extension is created on the database you want to monitor, the workload page will start displaying data. This section allows users to view details such as the database name, user name, executed queries, how many times each query has run, and their execution times.
All of this information is collected directly from the pg_stat_statements extension. The same data can also be accessed manually through psql by running:
select * from pg_stat_statements limit 1;
You get results like this
-[ RECORD 1 ]----------+---------------------------------------------------------------------------------------------------------------------------------------------------------------------------------------------------------------------------------------------------------------
userid                 | 16389
dbid                   | 5316704
toplevel               | t
queryid                | -4040117608144006478
query                  | UPDATE "ir_module_module"                                                                                                                                                                                                                                     +
                       |                     SET "latest_version" = "__tmp"."latest_version"::VARCHAR, "state" = "__tmp"."state"::VARCHAR, "views_by_module" = "__tmp"."views_by_module"::text, "write_date" = "__tmp"."write_date"::timestamp, "write_uid" = "__tmp"."write_uid"::int4+
                       |                     FROM (VALUES ($1, $2, $3, $4, $5, $6)) AS "__tmp"("id", "latest_version", "state", "views_by_module", "write_date", "write_uid")                                                                                                          +
                       |                     WHERE "ir_module_module"."id" = "__tmp"."id"
plans                  | 21
total_plan_time        | 1.016485
min_plan_time          | 0.027728
max_plan_time          | 0.075011
mean_plan_time         | 0.04840404761904762
stddev_plan_time       | 0.012988974799077322
calls                  | 21
total_exec_time        | 2.618666
min_exec_time          | 0.048261
max_exec_time          | 0.472971
mean_exec_time         | 0.12469838095238094
stddev_exec_time       | 0.12411301066538633
rows                   | 21
shared_blks_hit        | 698
shared_blks_read       | 0
shared_blks_dirtied    | 1
shared_blks_written    | 1
local_blks_hit         | 0
local_blks_read        | 0
local_blks_dirtied     | 0
local_blks_written     | 0
temp_blks_read         | 0
temp_blks_written      | 0
shared_blk_read_time   | 0
shared_blk_write_time  | 0
local_blk_read_time    | 0
local_blk_write_time   | 0
temp_blk_read_time     | 0
temp_blk_write_time    | 0
wal_records            | 114
wal_fpi                | 0
wal_bytes              | 22227
jit_functions          | 0
jit_generation_time    | 0
jit_inlining_count     | 0
jit_inlining_time      | 0
jit_optimization_count | 0
jit_optimization_time  | 0
jit_emission_count     | 0
jit_emission_time      | 0
jit_deform_count       | 0
jit_deform_time        | 0
stats_since            | 2026-02-05 12:31:28.987362+05:30
minmax_stats_since     | 2026-02-05 12:31:28.987362+05:30
You can get the query execution details like this.
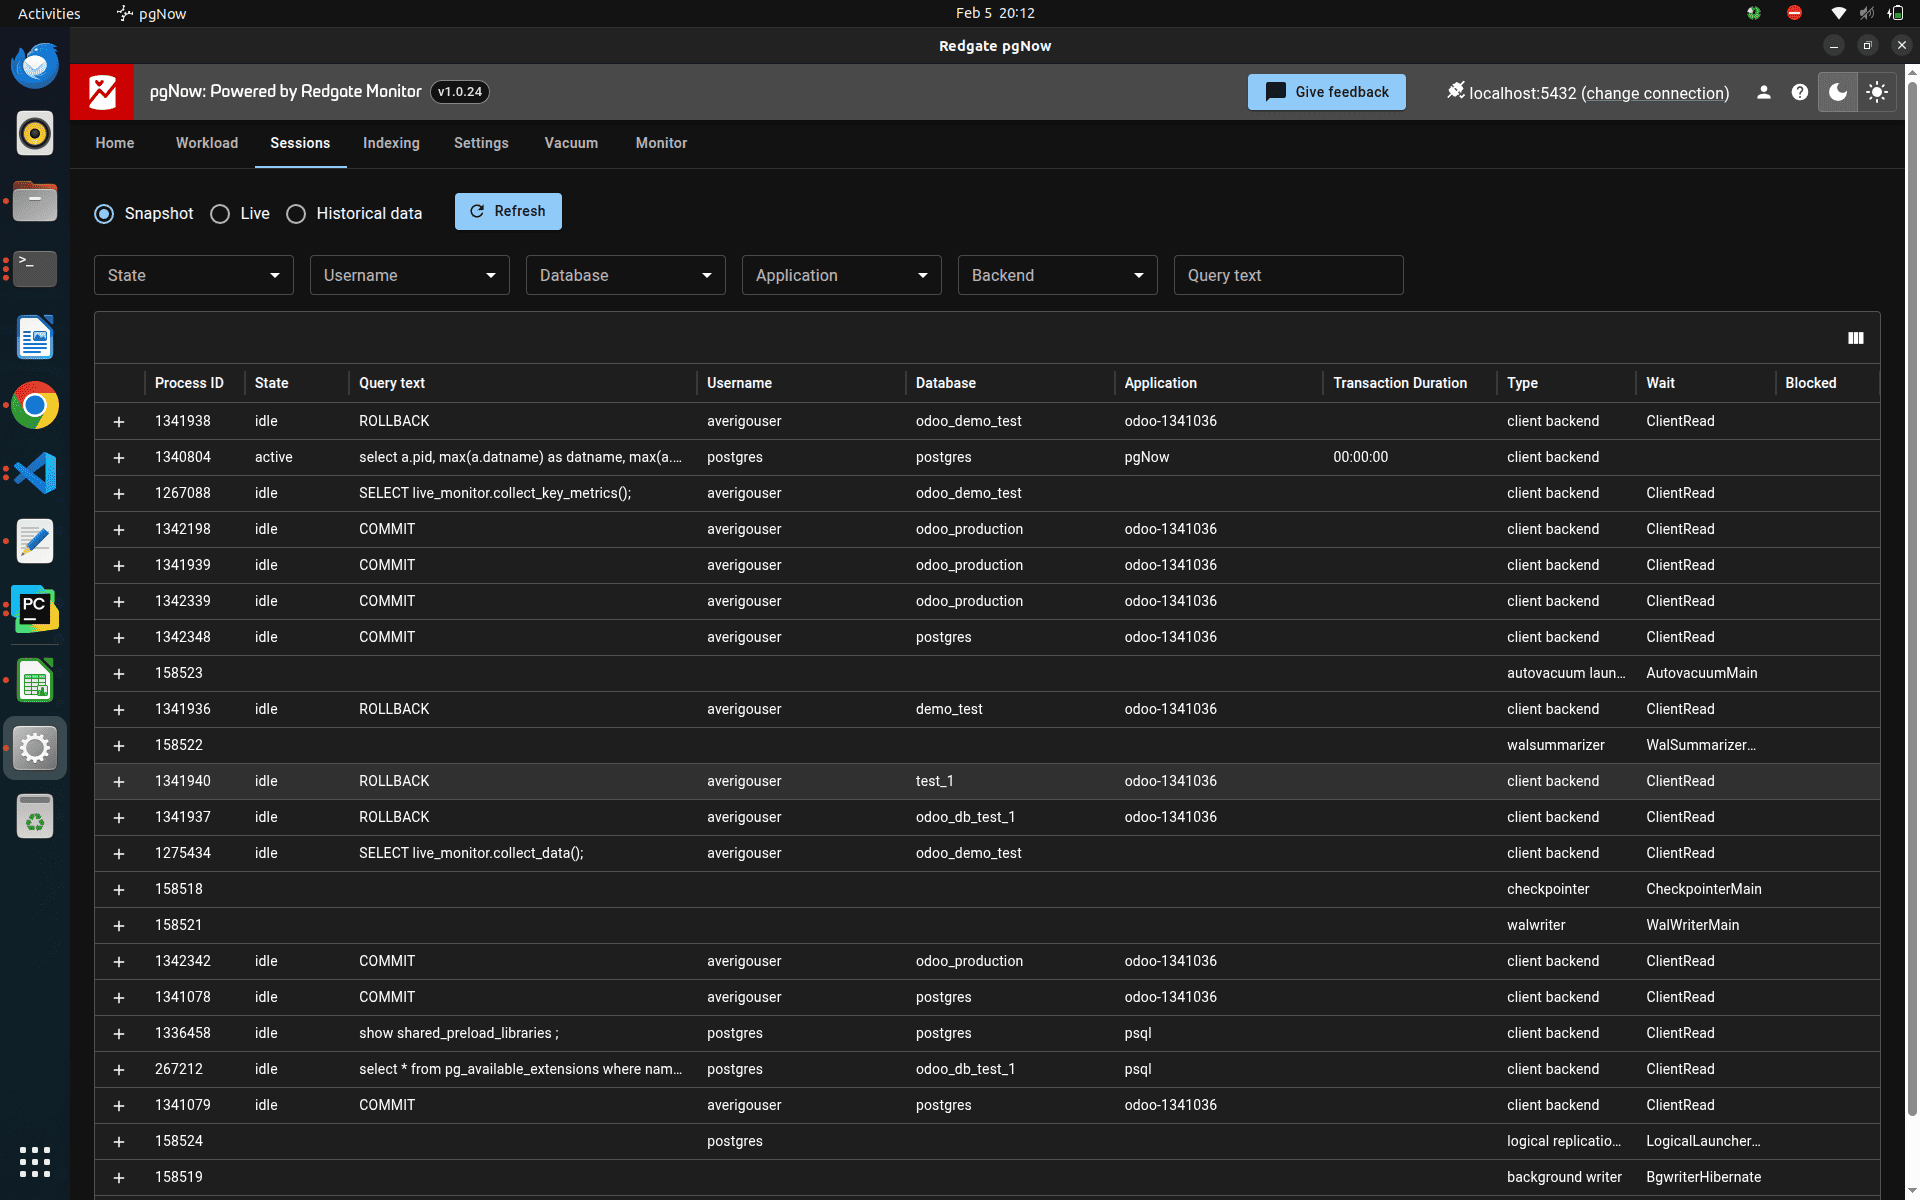
You can also monitor session-related information through this view. It displays details such as process ID, session state, query text, user name, database name, connected application, transaction duration, session type, wait event, and whether the session is blocked.
In standard PostgreSQL, you can view the currently active backend processes by running the following query:
select * from pg_stat_activity limit 1;
You get results like this
odoo_production=# select * from pg_stat_activity limit 1;
-[ RECORD 1 ]----+---------------------------------
datid            | 5
datname          | postgres
pid              | 1341078
leader_pid       |
usesysid         | 16389
usename          | averigouser
application_name | odoo-1341036
client_addr      | 127.0.0.1
client_hostname  |
client_port      | 56050
backend_start    | 2026-02-05 20:11:44.64648+05:30
xact_start       |
query_start      | 2026-02-05 20:11:44.6666+05:30
state_change     | 2026-02-05 20:11:44.666669+05:30
wait_event_type  | Client
wait_event       | ClientRead
state            | idle
backend_xid      |
backend_xmin     |
query_id         | -2835399305386018931
query            | COMMIT
backend_type     | client backend
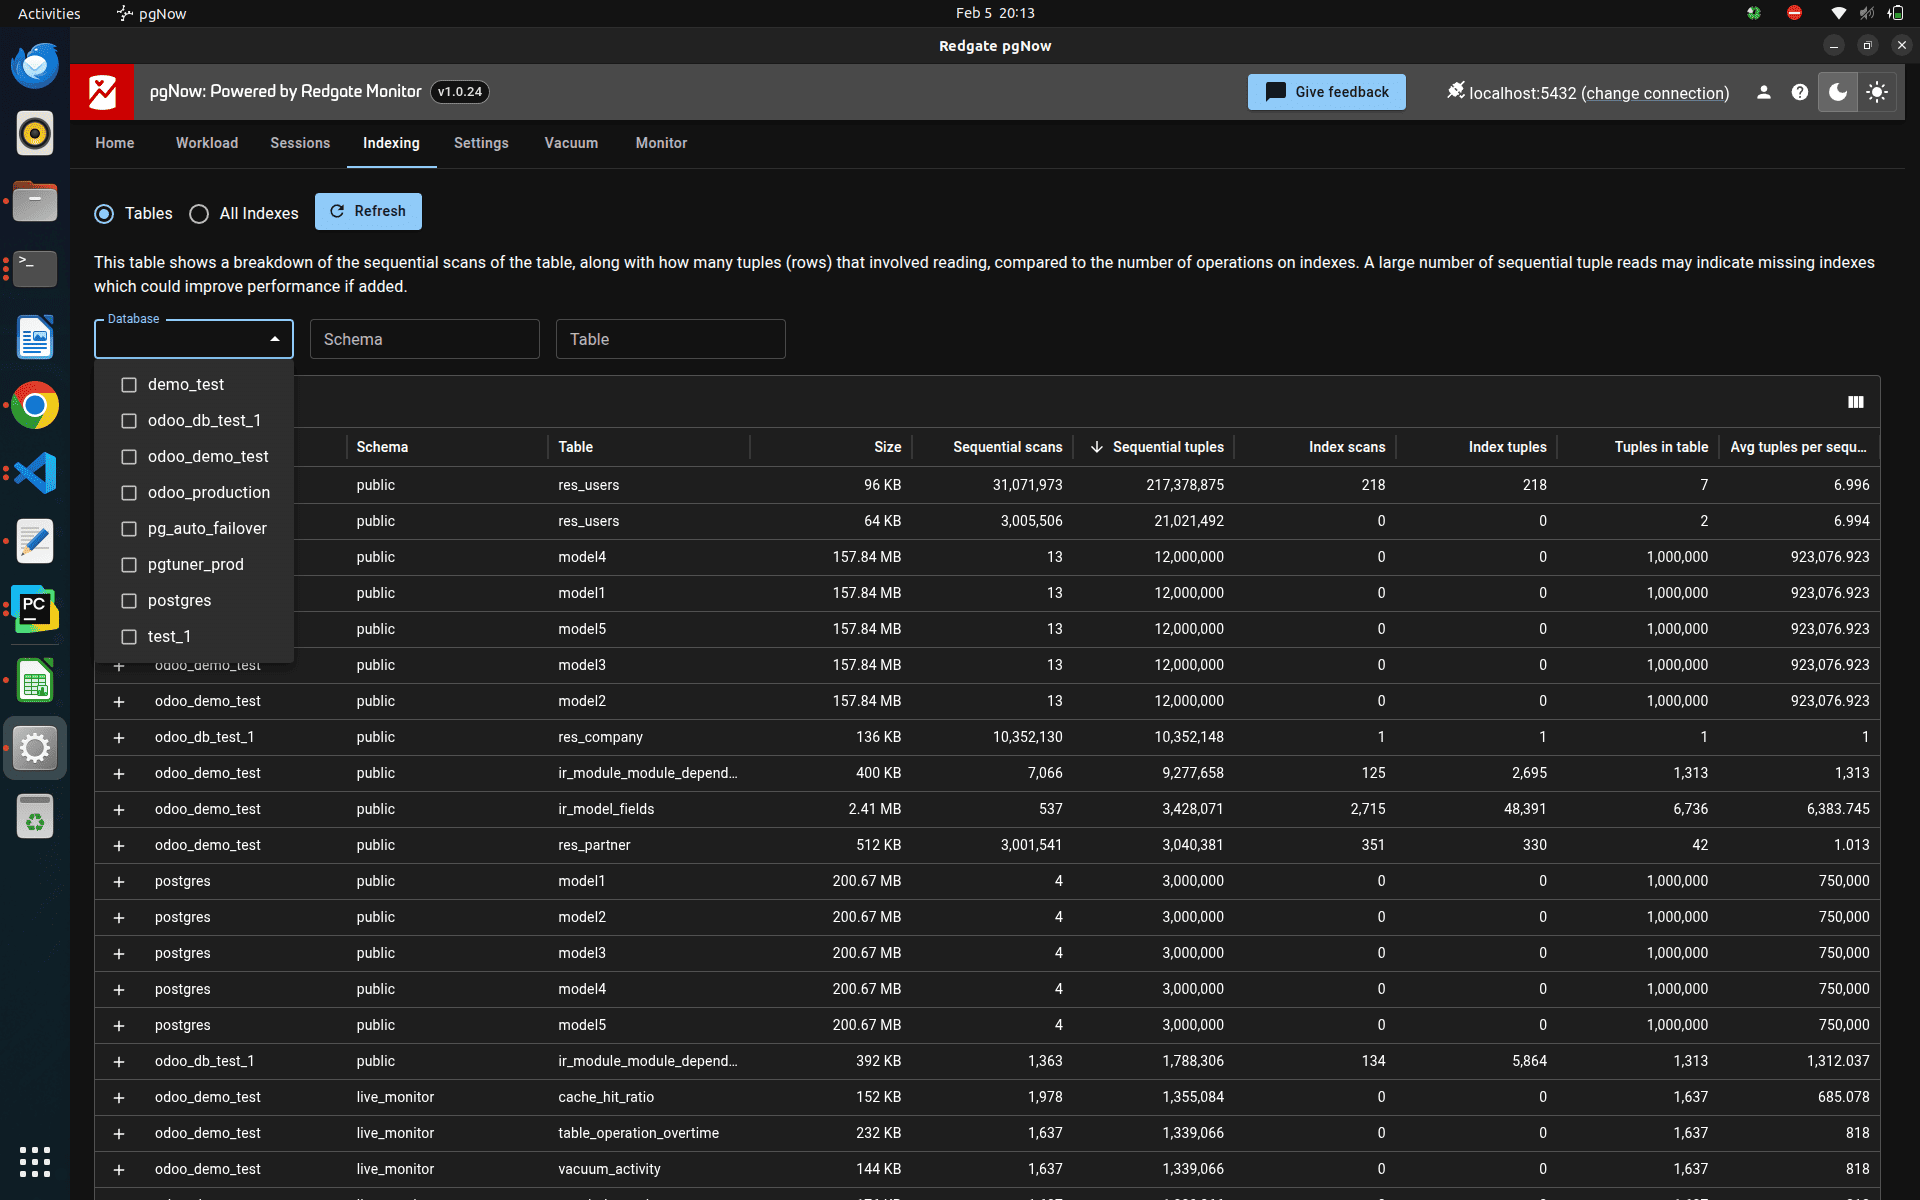
The user can also see the index-related details and table-related details like this
In PostgreSQL, the user can see each table's metadata and the index-related metadata from the below two postgres system catalogues.
select * from pg_stat_user_tables limit 1;
Result :
odoo_production=# select * from pg_stat_user_tables limit 1;
-[ RECORD 1 ]-------+---------------------------------
relid               | 5312206
schemaname          | public
relname             | ir_actions
seq_scan            | 48
last_seq_scan       | 2026-02-05 20:32:50.244931+05:30
seq_tup_read        | 0
idx_scan            | 0
last_idx_scan       |
idx_tup_fetch       | 0
n_tup_ins           | 0
n_tup_upd           | 0
n_tup_del           | 0
n_tup_hot_upd       | 0
n_tup_newpage_upd   | 0
n_live_tup          | 0
n_dead_tup          | 0
n_mod_since_analyze | 0
n_ins_since_vacuum  | 0
last_vacuum         |
last_autovacuum     |
last_analyze        |
last_autoanalyze    |
vacuum_count        | 0
autovacuum_count    | 0
analyze_count       | 0
autoanalyze_count   | 0
Now, let’s check the index related metadata directly from the postgres system catalogues.
select * from pg_stat_user_indexes limit 1;
Result :
-[ RECORD 1 ]-+---------------------------------
relid         | 5314913
indexrelid    | 5314919
schemaname    | public
relname       | bus_bus
indexrelname  | bus_bus_pkey
idx_scan      | 4
last_idx_scan | 2026-02-05 20:32:50.567887+05:30
idx_tup_read  | 5
idx_tup_fetch | 2
In the pgnow monitoring tool, the user can see each table and index-related information, like this
In the pgnow monitoring tool, there is a separate menu for the best recommendations that we can set for our database
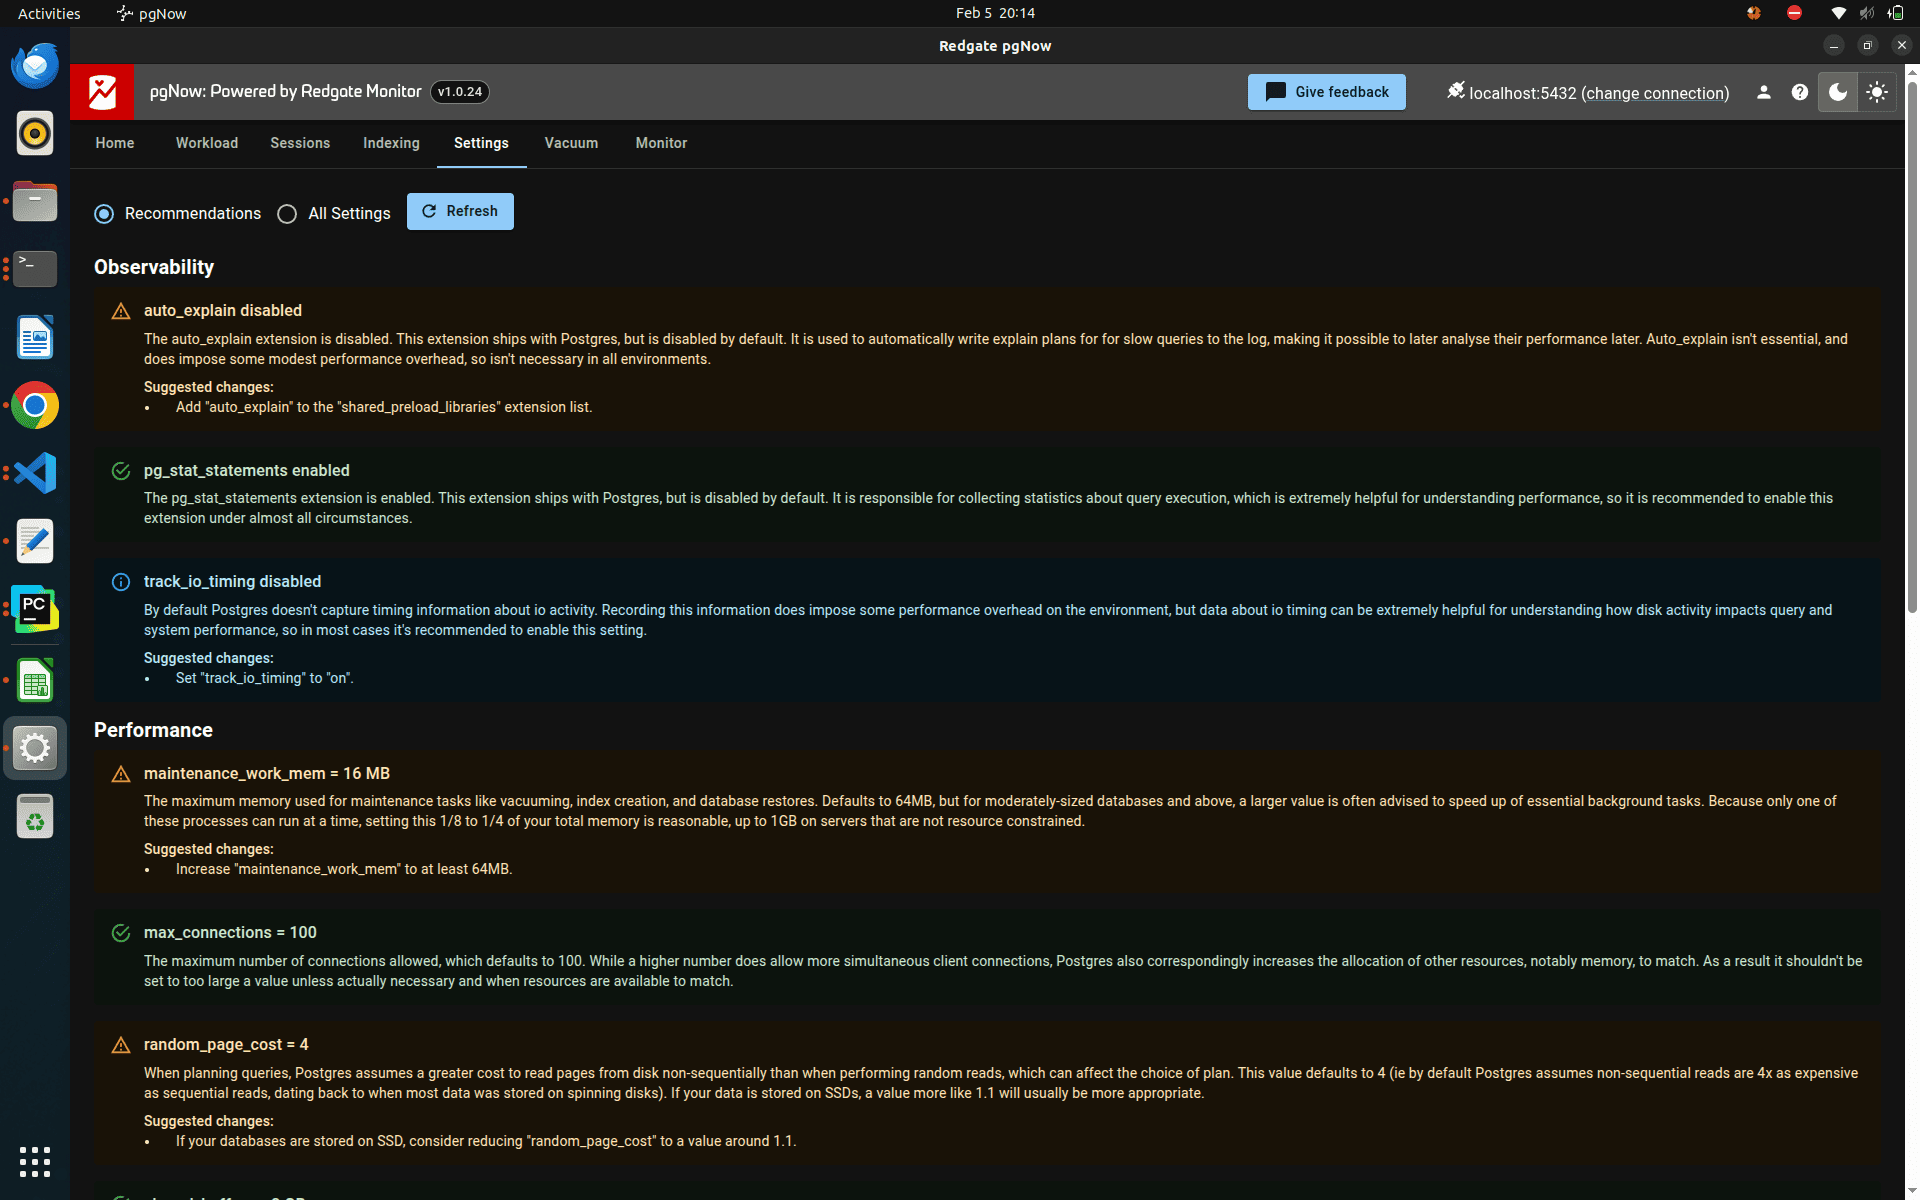
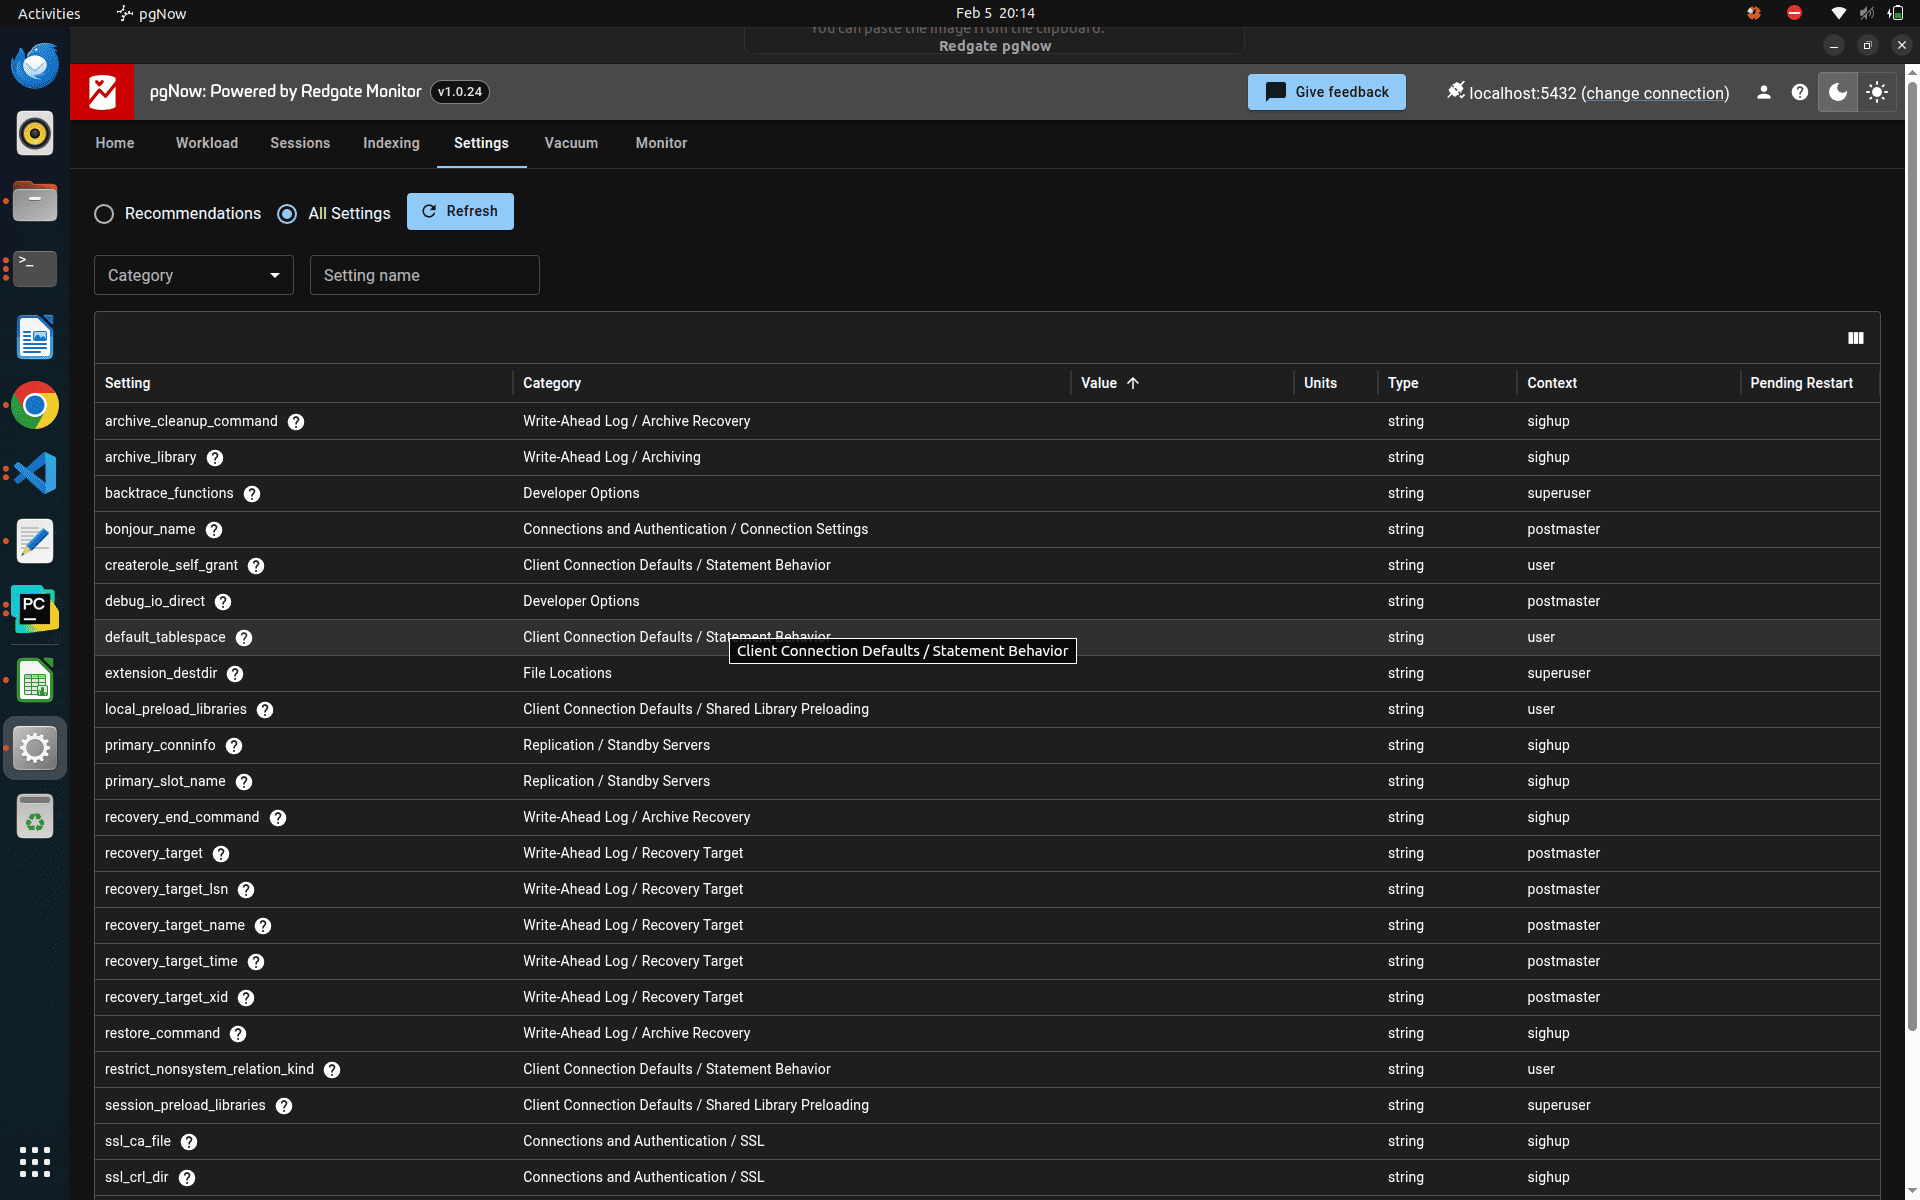
The tool also allows users to view all PostgreSQL configuration parameters along with their current values. Using the recommendations generated by pgNow, you can fine-tune these settings to better suit your workload, which helps improve overall database performance and stability.
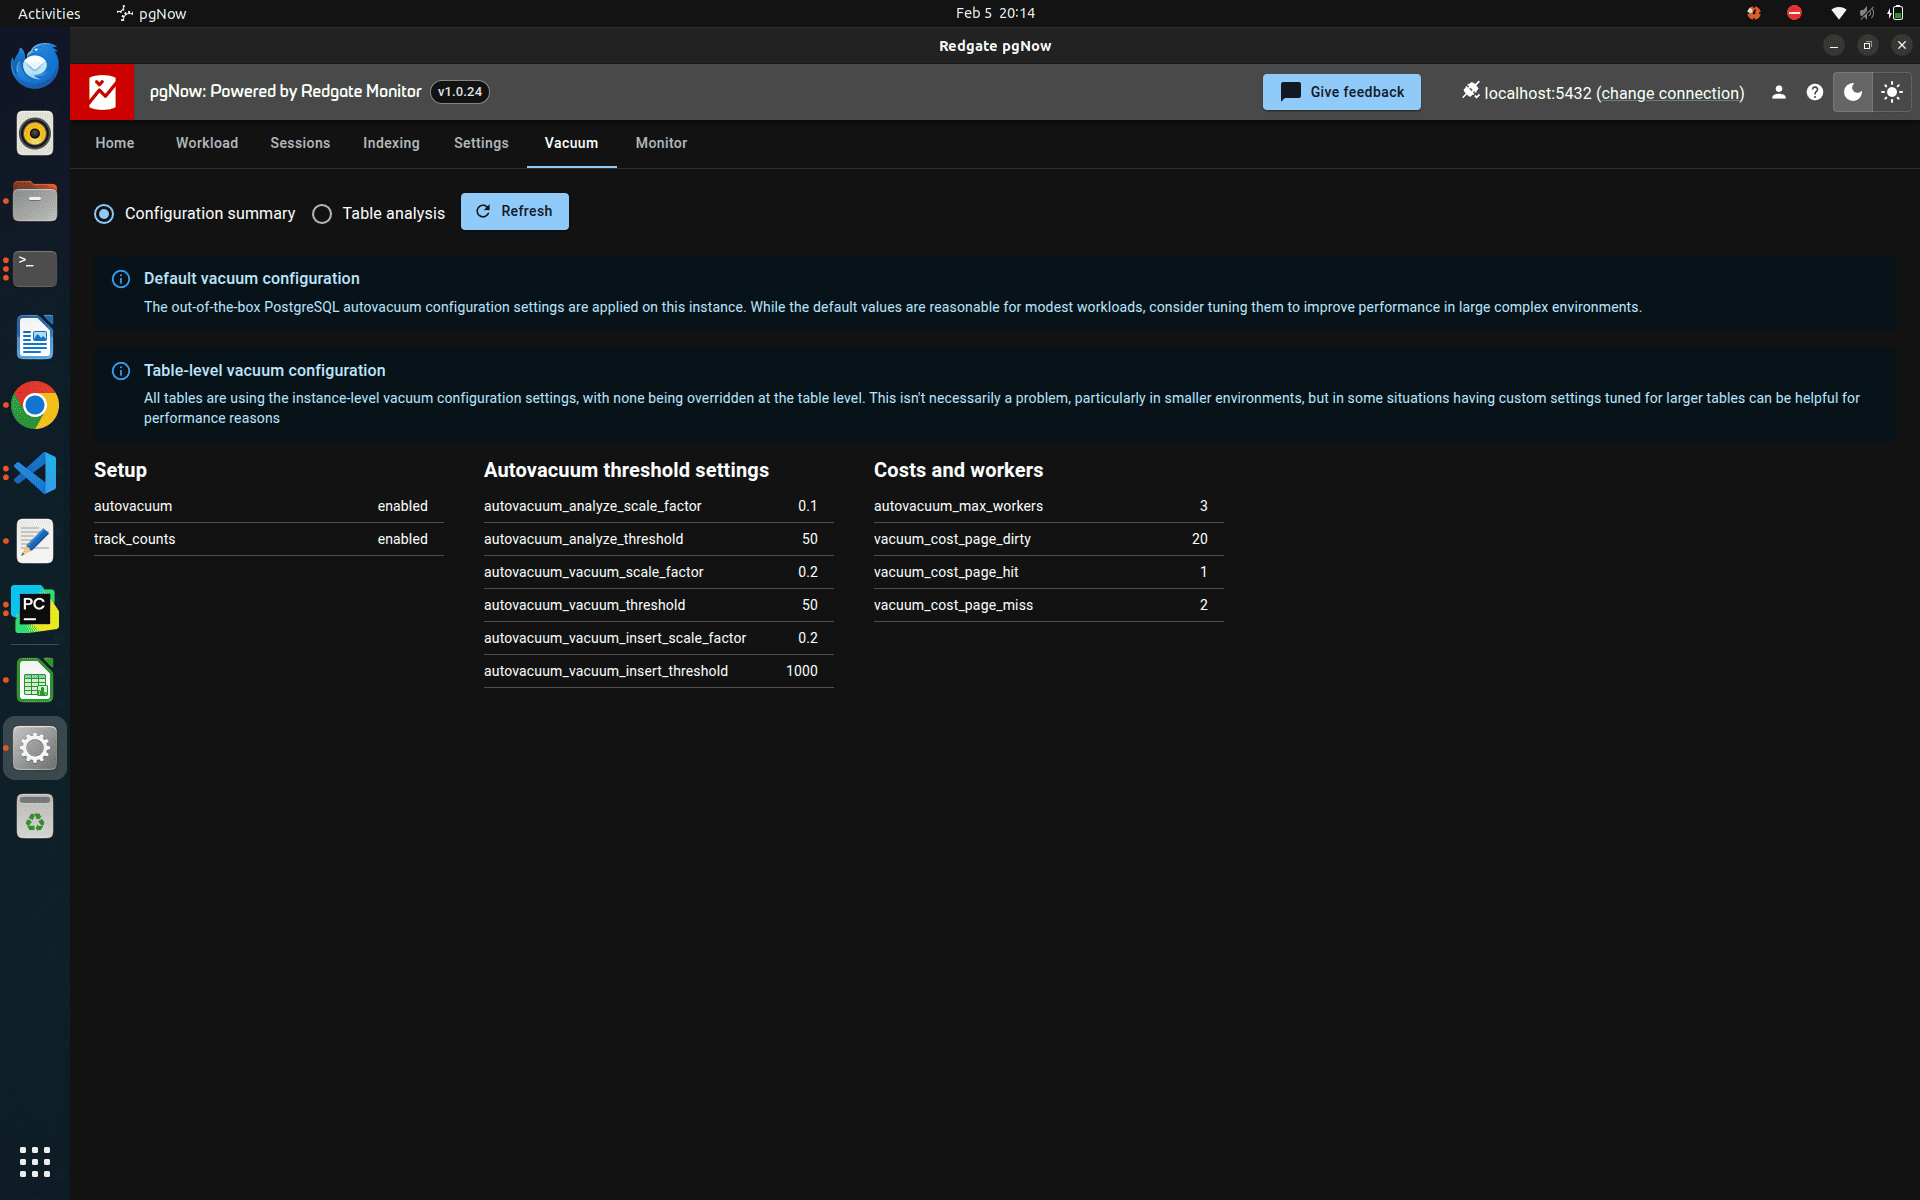
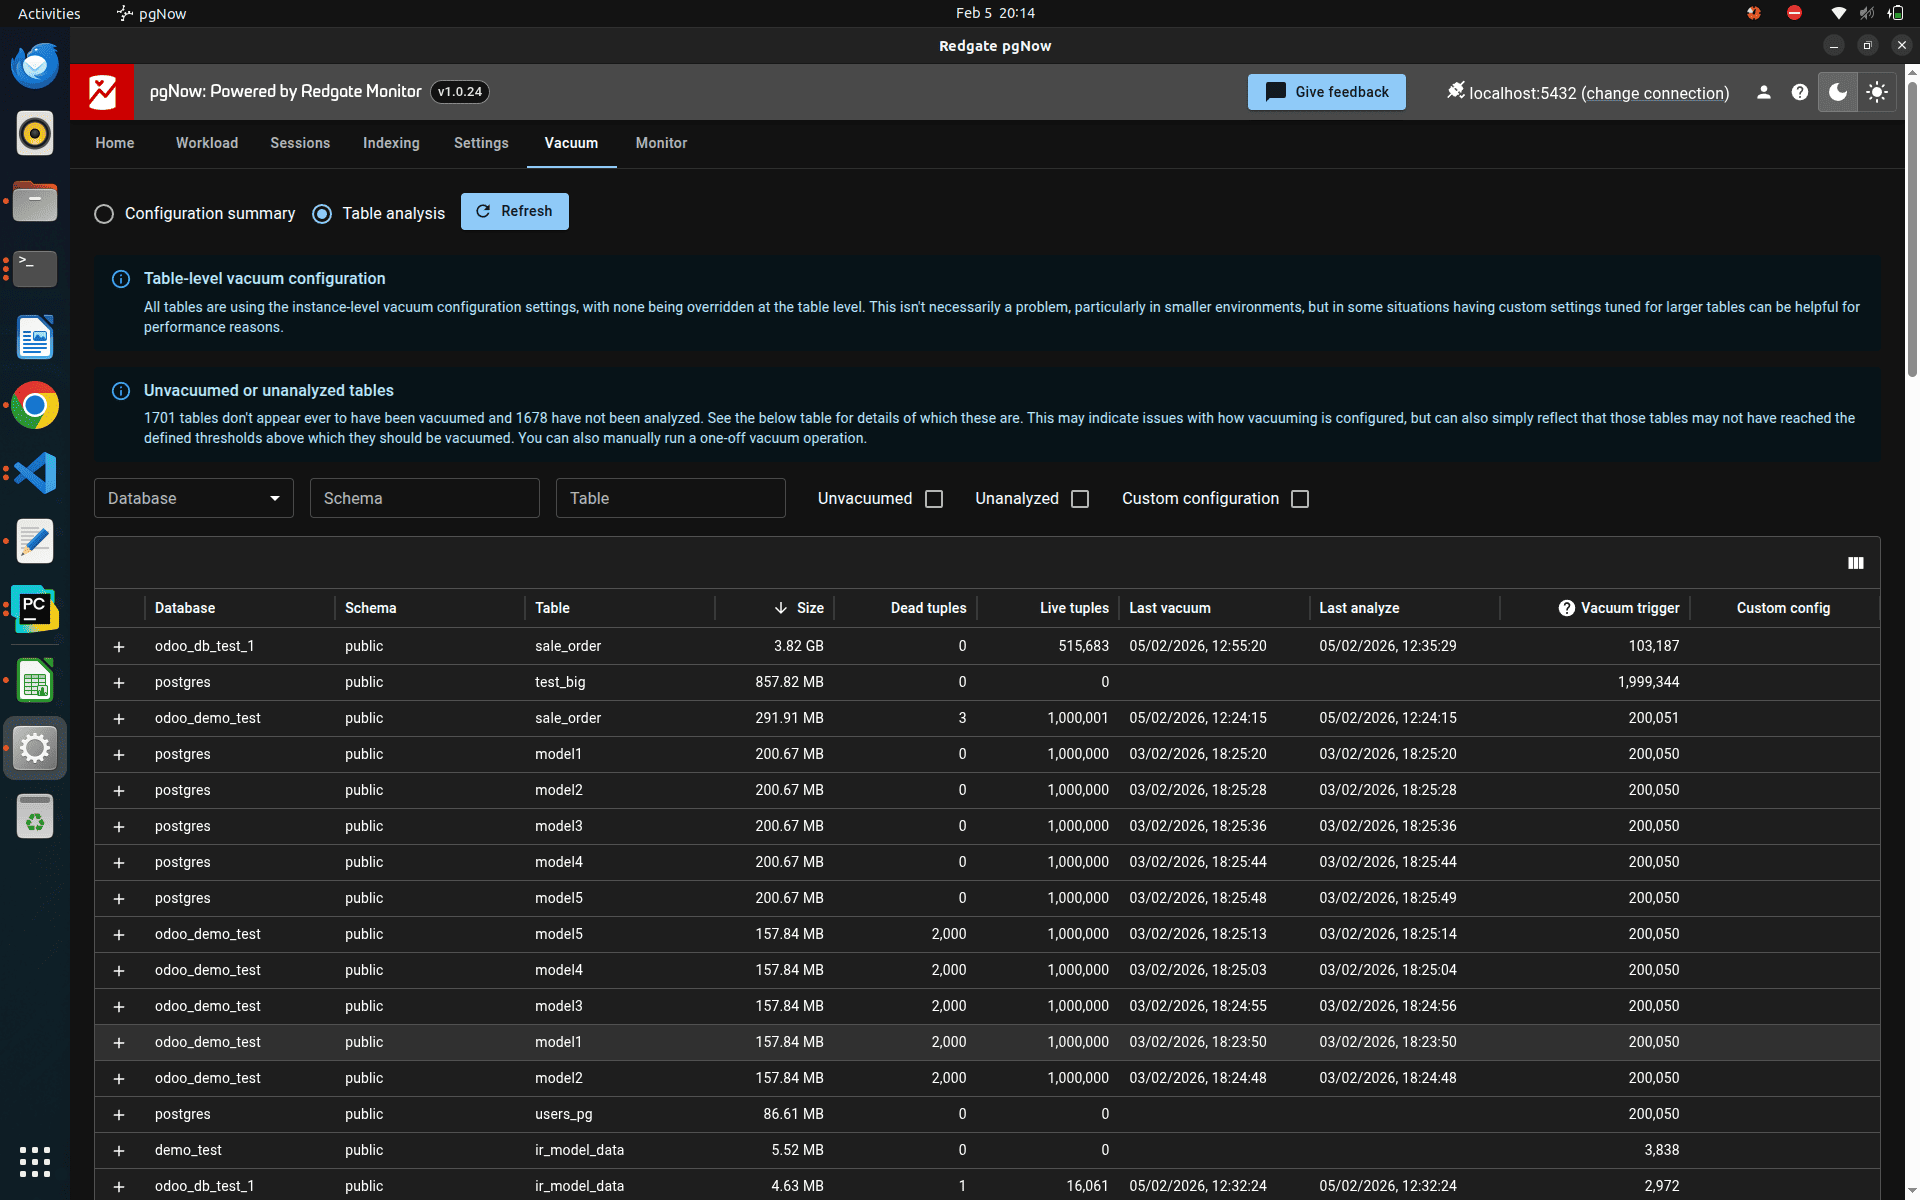
Vacuum plays a crucial role in maintaining PostgreSQL performance. In pgNow, there is a dedicated section to view vacuum-related configuration settings, along with table-level insights generated from vacuum activity. This helps users understand how vacuum is operating on individual tables and supports better tuning for efficient database maintenance.
pgNow offers a simple and practical way to monitor PostgreSQL databases by bringing workload analysis, session tracking, indexing insights, configuration details, and vacuum information into a single interface.By using the data and recommendations provided by the tool, users can better understand database behavior, identify performance issues early, and apply meaningful optimizations.
Overall, pgNow helps make PostgreSQL monitoring more accessible and supports smarter, data-driven decisions for maintaining a healthy and efficient database.