PostgreSQL environments that run large applications such as Odoo or data-heavy services often need a clear view of database health. Logs alone rarely give enough insight into performance issues, index problems, or query behavior. PgHero provides a lightweight monitoring interface that reads PostgreSQL statistics and presents them in a structured dashboard.
Understanding PgHero and Its Role in PostgreSQL Monitoring
PgHero is a web-based monitoring tool built to inspect PostgreSQL activity without adding heavy overhead. It does not replace database tools like pgAdmin or Prometheus. Instead, it focuses on operational visibility: slow queries, unused indexes, connection usage, and maintenance information.
Typical scenarios where PgHero becomes useful:
- Monitoring the production database
- Investigating slow inserts or updates
- Checking index efficiency
- Understanding connection distribution across databases
- Reviewing vacuum and analyze activity
Installing PgHero on Linux
The installation we performed on Ubuntu 22.04 is a practical example. Below is a structured explanation of those steps.
Step 1 — Add the Repository Key
wget -qO- https://dl.packager.io/srv/pghero/pghero/key | sudo apt-key add -
You may notice warnings about apt-key being deprecated. This does not prevent installation, but future systems may require using a keyring file instead.
Step 2 — Add the PgHero Repository
sudo wget -O /etc/apt/sources.list.d/pghero.list \
https://dl.packager.io/srv/pghero/pghero/master/installer/ubuntu/22.04.repo
This registers the package source so Ubuntu can install PgHero like a normal package.
Step 3 — Update and Install
sudo apt-get update
sudo apt-get -y install pghero
Verifying Installation
After installation, run this command
pghero --help
You get all the options related to the pghero like this
root@cybrosys:/home/cybrosys# pghero --help
Usage:
  pghero run COMMAND [options]
  pghero scale TYPE=NUM
  pghero logs [--tail|-n NUMBER]
  pghero config:get VAR
  pghero config:set VAR=VALUE
  pghero config:unset VAR
  pghero configure
  pghero reconfigure
  pghero restart
Details:
  pghero configure [-f FILE|-]
    * If using an installer:
      This command will launch the installer wizard.
      You can pass the installer seed file as argument or on STDIN.
   * Without installer:
      This will execute the configure script at /opt/pghero/packaging/scripts/configure (if any).
      A file containing environment variables can be given as argument or on STDIN (-f -), and will be saved in the /etc/pghero/conf.d folder.
  pghero reconfigure
    This command allows to reconfigure the application. Only useful if using an installer.
  pghero restart [process]
    This will restart the application (or the given process), in a distribution-independent manner.
root@cybrosys:/home/cybrosys#
Configuring PgHero
Configuration is done through environment variables using the built-in command.
Setting the Database Connection
sudo pghero config:set DATABASE_URL=postgres://odoouser:cool@localhost:5432/demo_test
This tells PgHero which PostgreSQL database to monitor.
Setting the Web Port
sudo pghero config:set PORT=3001
Starting the Web Service
sudo pghero scale web=1
We confirmed whether the pghero is running or not by checking its status
sudo systemctl status pghero-web-1.service
You get a result like this
cybrosys@cybrosys:~$ sudo systemctl status pghero
[sudo] password for cybrosys:
? pghero.service
     Loaded: loaded (/etc/systemd/system/pghero.service; enabled; vendor preset: enabled)
     Active: active (running) since Wed 2026-02-11 20:05:15 IST; 2h 58min ago
   Main PID: 59356 (sleep)
      Tasks: 1 (limit: 36913)
     Memory: 220.0K
        CPU: 1ms
     CGroup: /system.slice/pghero.service
             +-59356 /bin/sleep infinity
Feb 11 20:05:15 cybrosys systemd[1]: Started pghero.service.
cybrosys@cybrosys:~$
Exploring the PgHero Dashboard
The interface contains eight main sections. Each page provides a different view of database behavior.
Overview Page - General Health Summary
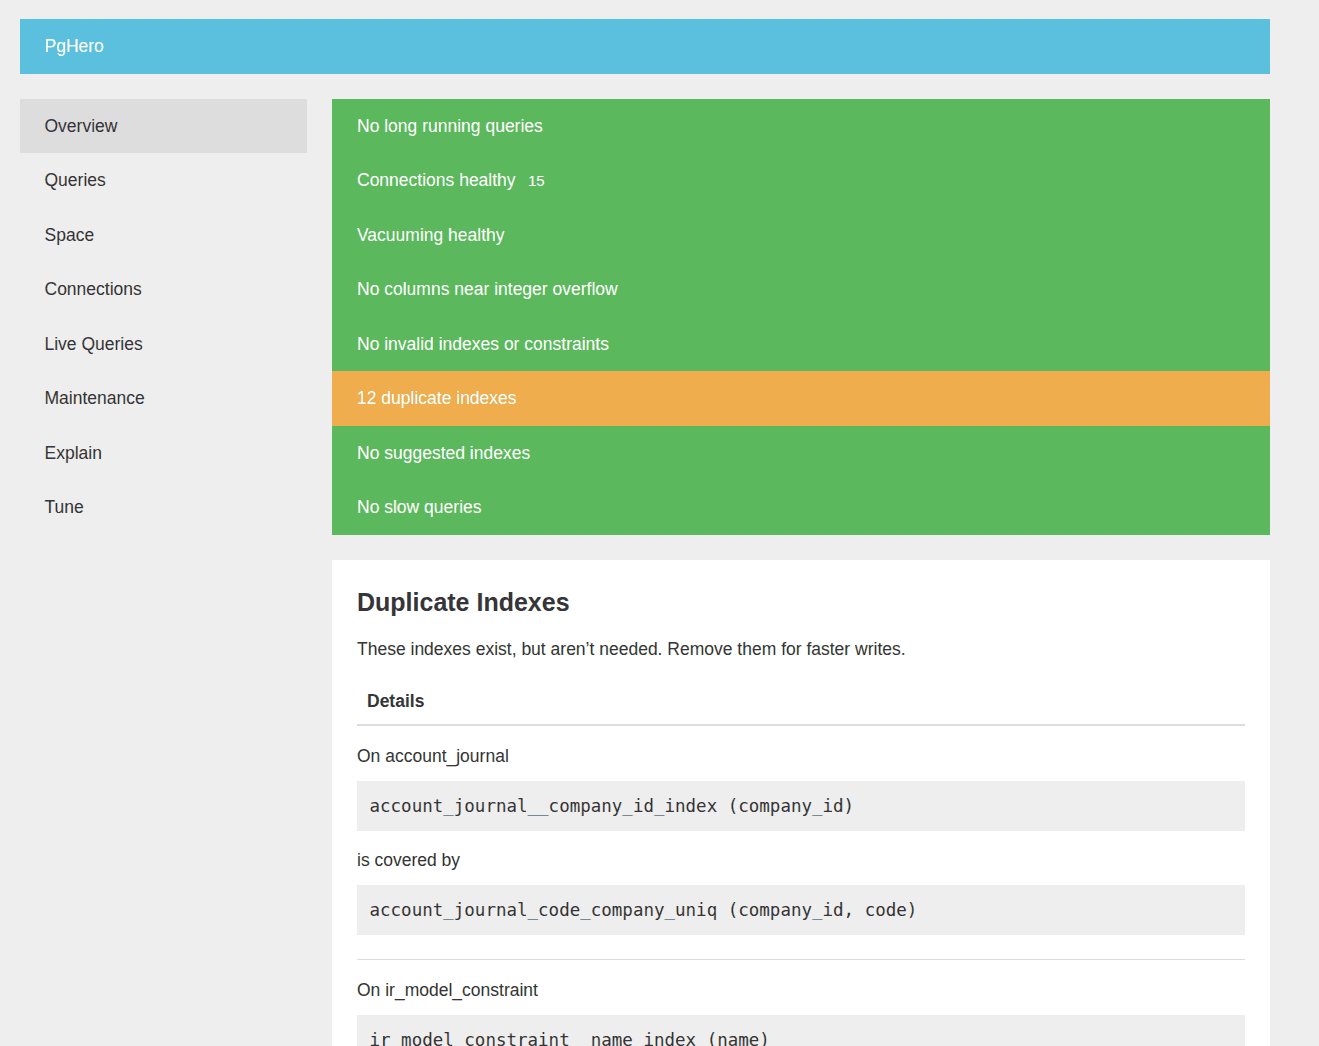
The Overview screen gives a quick summary of database health. In your setup, it displayed:
- No long running queries
- Connections healthy
- Vacuum activity normal
- Duplicate index warnings
This page acts as a starting point for diagnosing performance issues. The duplicate index message is important because extra indexes slow down insert operations, especially in write-heavy systems like Odoo.
Queries Page: Tracking Execution Patterns

The Queries page lists statements executed against the database with metrics such as:
- Total execution time
- Average latency
- Number of calls.
Developers can use this data to:
- Identify heavy ORM calls
- Investigate repetitive SQL generated by applications
- Optimize frequently executed queries
Space Page: Database Size and Index Usage
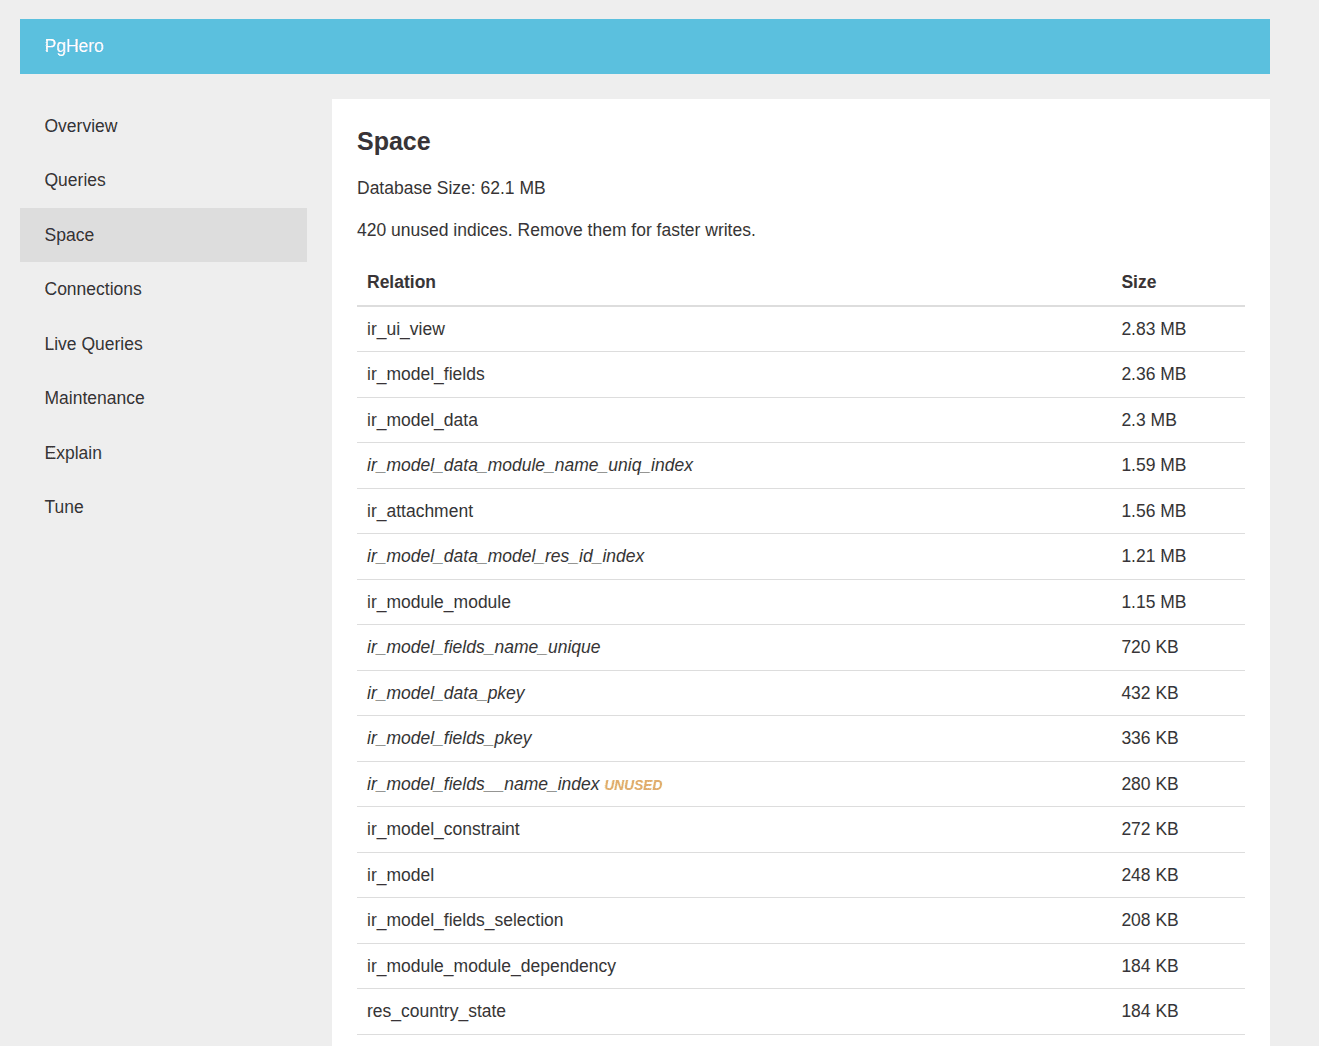
The Space section focuses on storage and index efficiency.
Unused indexes increase disk usage and slow down writes because PostgreSQL must maintain them during INSERT and UPDATE operations.
For developers working on PostgreSQL internals or performance tuning, this page provides a clear starting point for cleanup.
In normal postgresql we can see the metadata of each table from the postgres system tables named pg_stat_user_tables, and we can also get each index created by the user from the model named pg_stat_user_indexes
Connections Page: Monitoring Client Activity
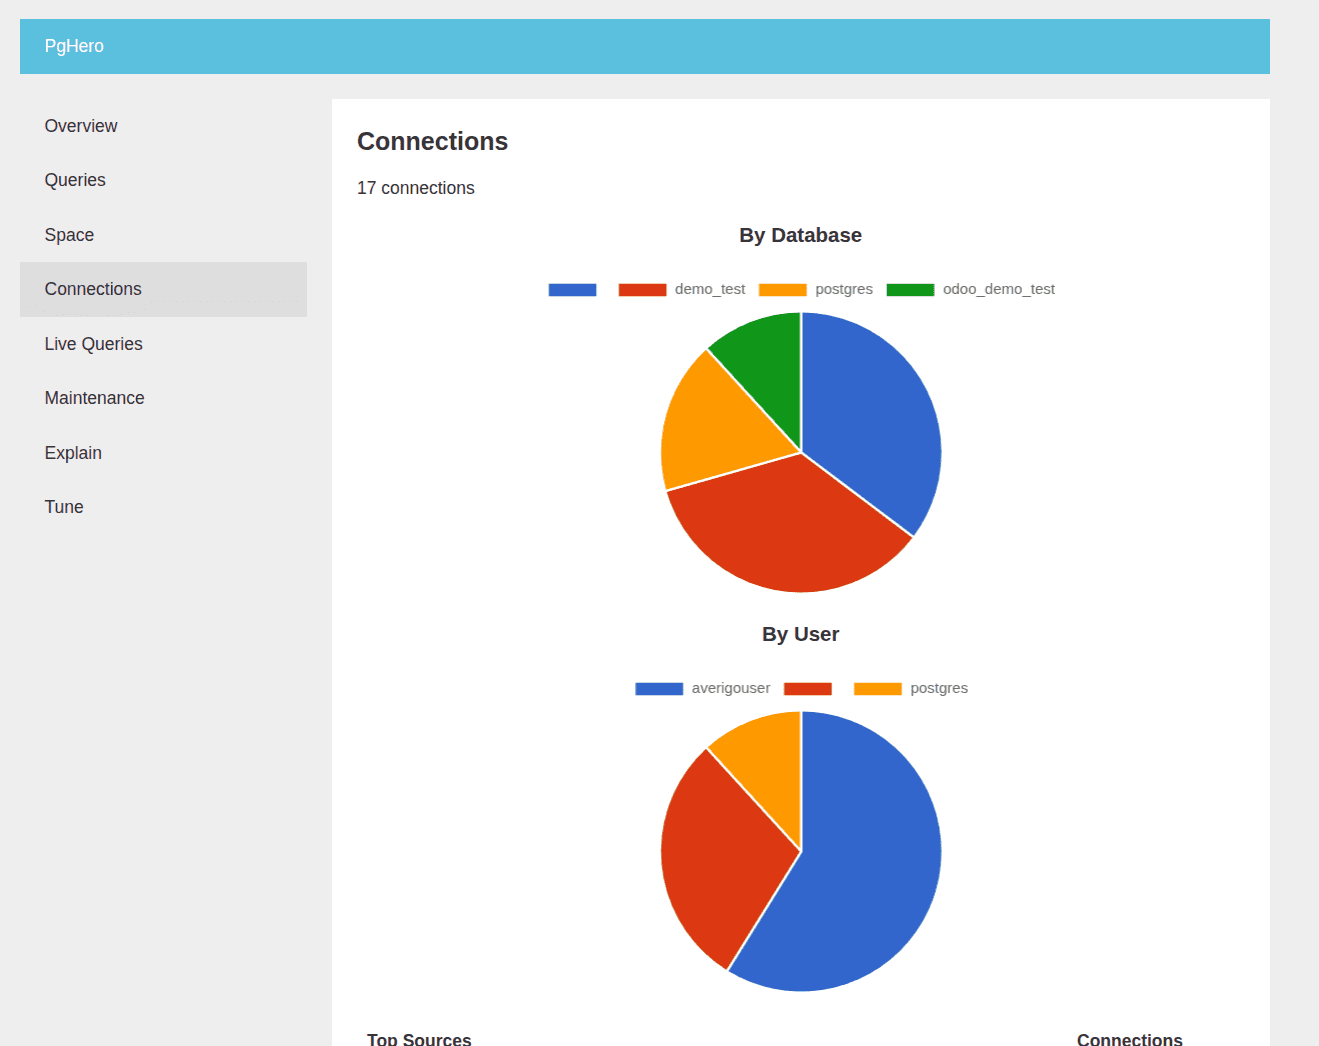
This page visualizes connection distribution:
This is useful when diagnosing connection pooling issues or application load imbalance.
In Odoo deployments, connection spikes often occur during batch operations or cron jobs. PgHero makes those patterns easy to observe.
Live Queries Page - Active Sessions
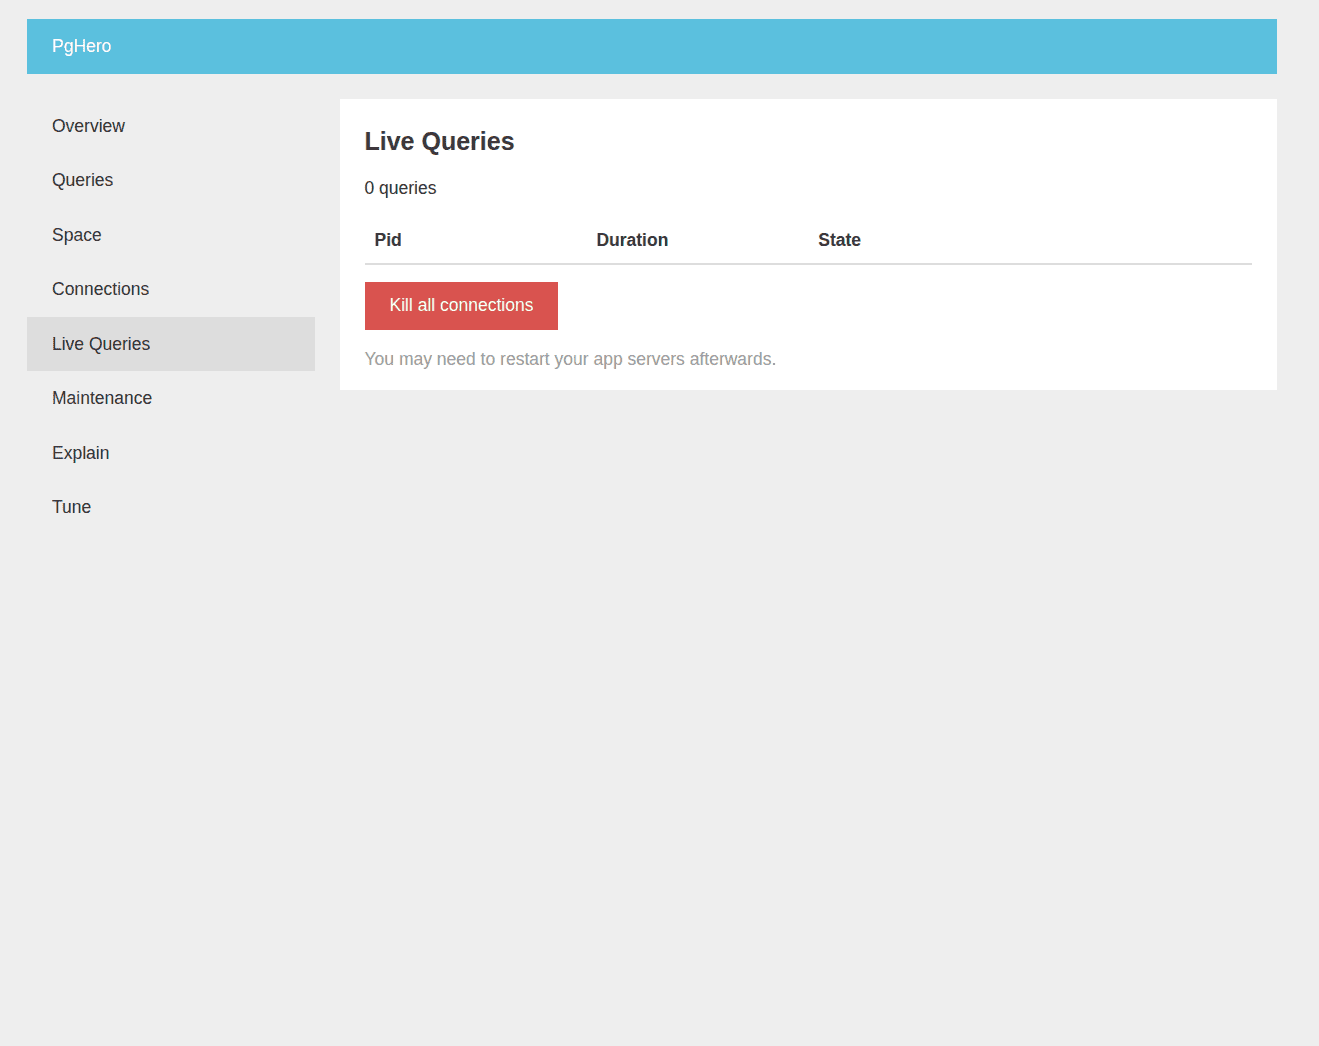
The Live Queries screen lists currently running SQL statements. Key functionality includes:
- Viewing query duration
- Identifying blocking sessions
- Killing connections when necessary
This page becomes critical when troubleshooting locking issues or unexpected CPU spikes.
In PostgreSQL, we have a system table named pg_stat_activity to see the activities that are running in the background.
Maintenance Page: Vacuum and Analyze Activity
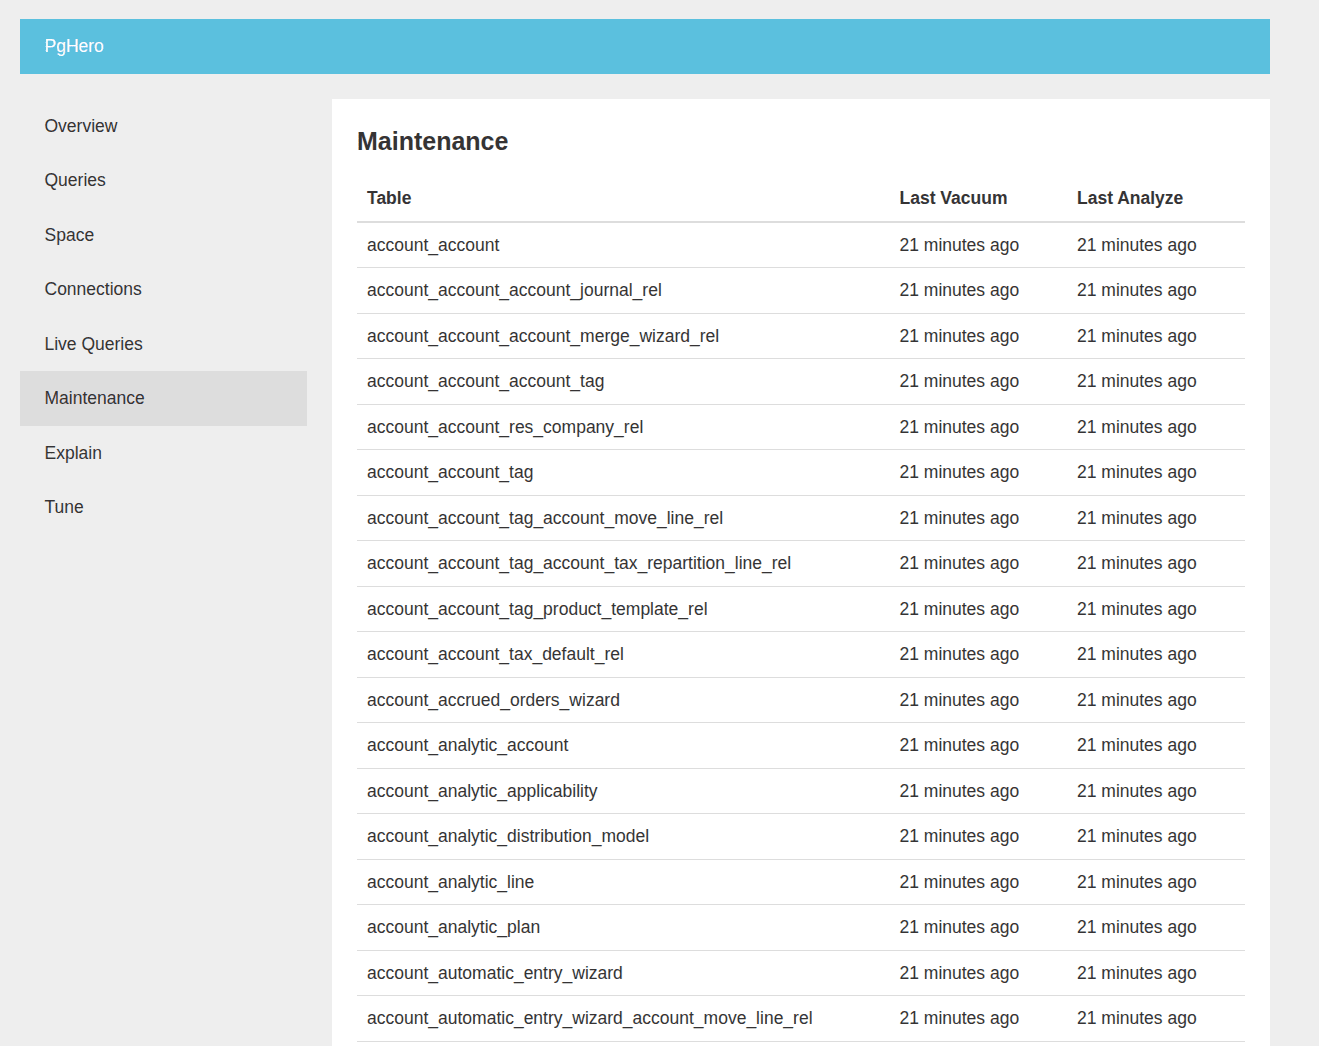
PostgreSQL relies on autovacuum to clean dead tuples. The Maintenance page displays:
- Last vacuum time
- Last analyze time
This indicates that the autovacuum is running normally, which is important for preventing table bloat.
Explain Page - Visualizing Query Plans
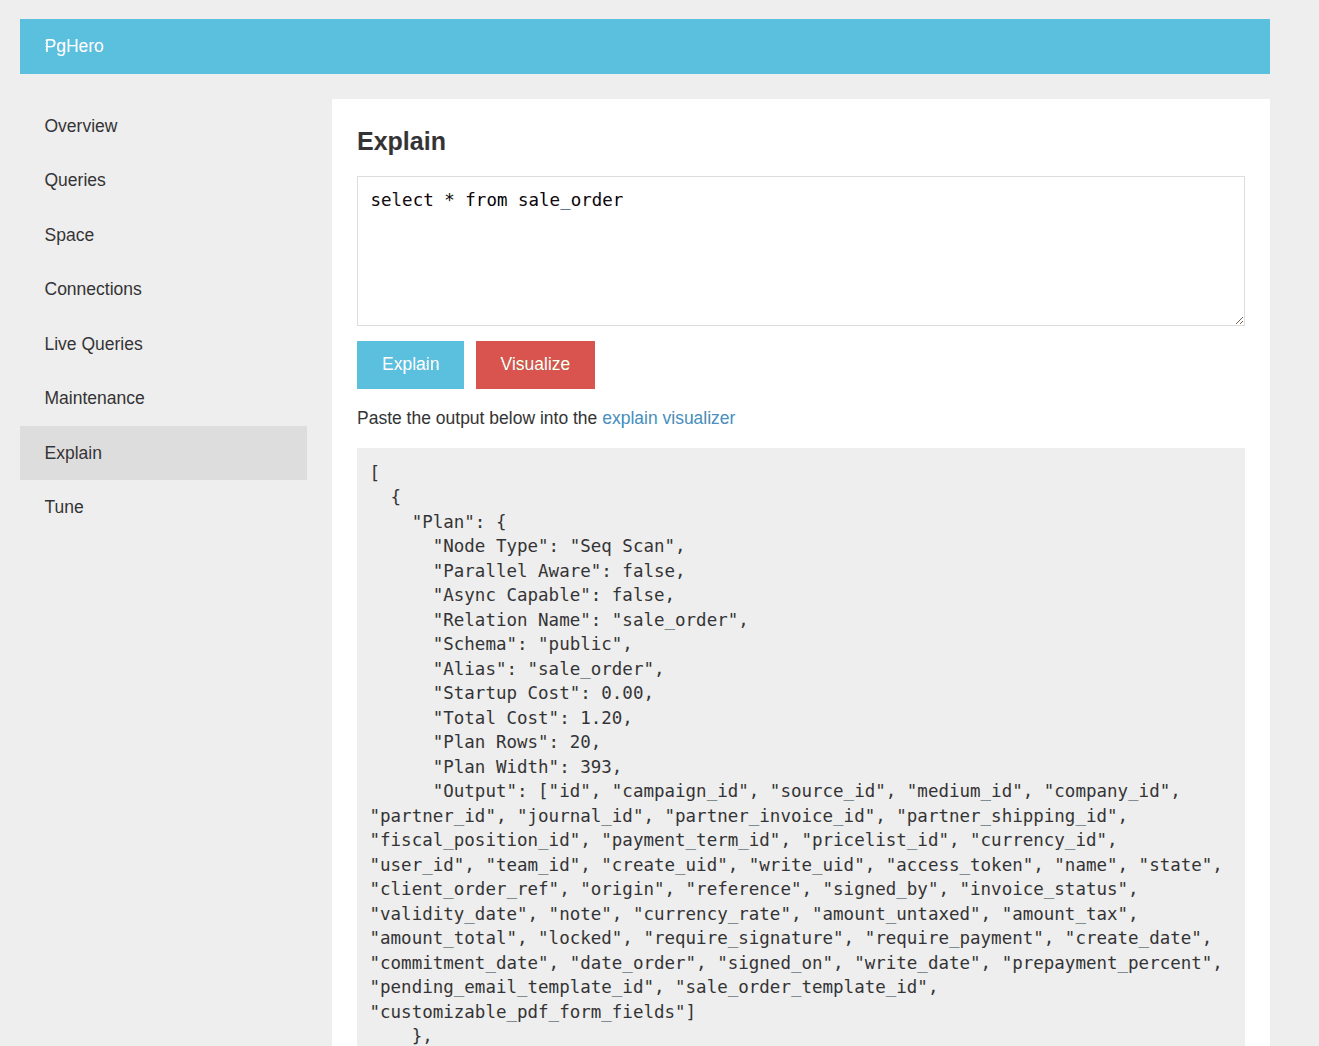
The Explain section allows developers to paste SQL queries and generate execution plans. This page is particularly useful for:
- Testing index strategies
- Understanding planner decisions
- Comparing execution paths before and after optimization
Tune Page: Reviewing Configuration Parameters
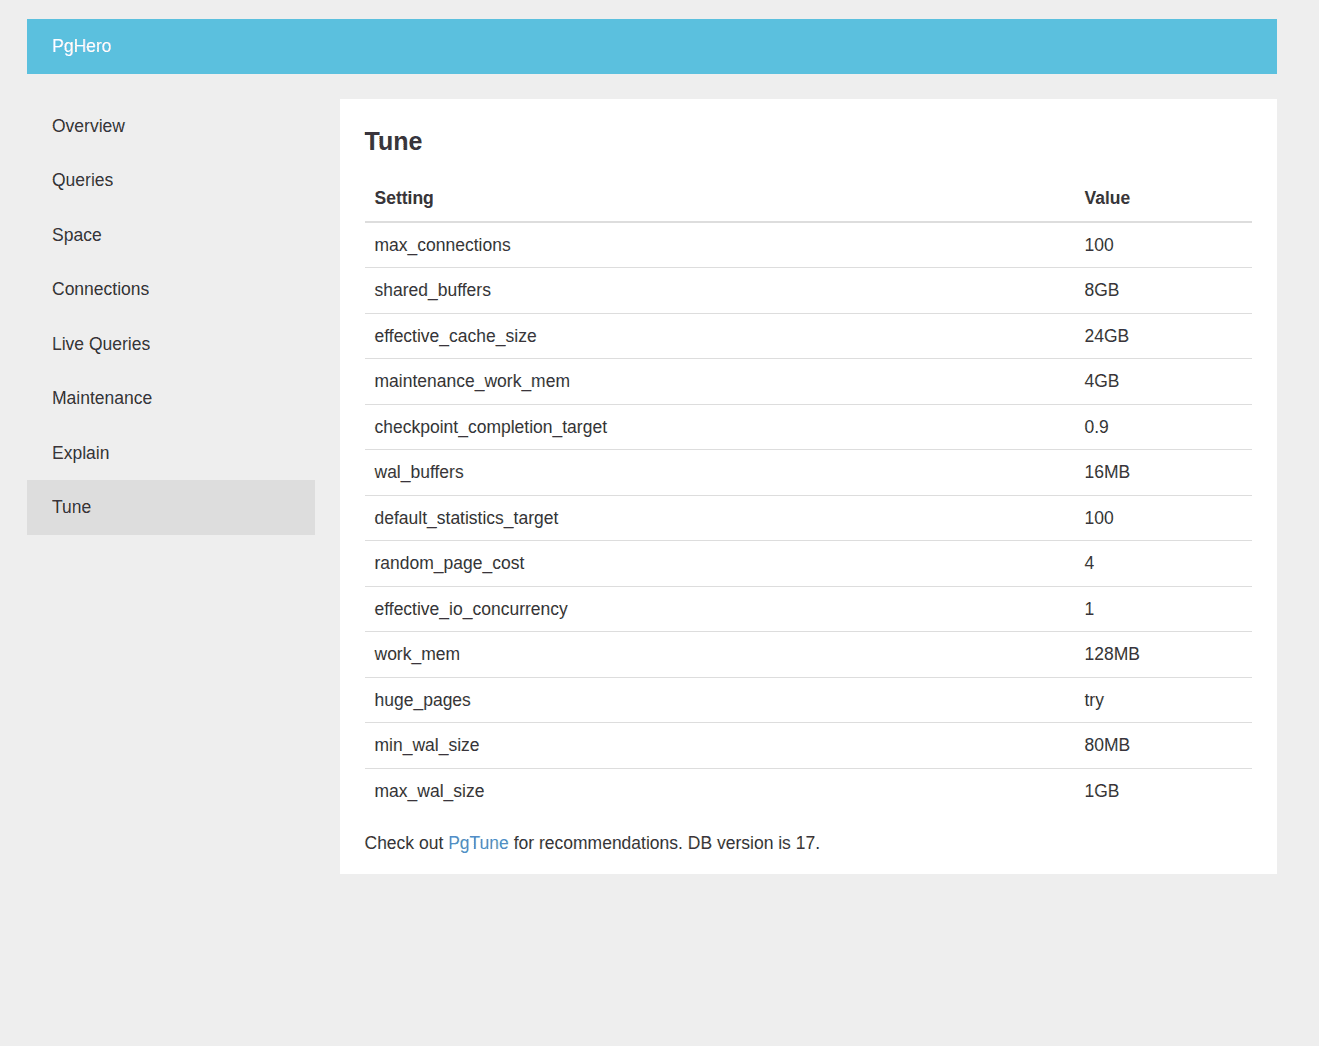
The Tune page displays selected PostgreSQL settings, such as:
- Shared_buffers
- Work_mem
- Effective_cache_size
- max_connections
These values reflect server memory allocation and planner behavior. PgHero also links to PgTune recommendations, helping administrators adjust configuration without manually inspecting postgresql.conf.
PgHero offers a clear monitoring interface without requiring a complex setup. By exposing PostgreSQL statistics in an accessible dashboard, it becomes easier to observe database behavior during development and production use.
From installation through configuration and service startup, the process is straightforward on Linux. Once running, each page of the dashboard focuses on a specific operational aspect: health overview, query performance, storage usage, connections, live sessions, maintenance, execution plans, and configuration tuning.
For environments like Odoo, where PostgreSQL performance directly affects business workflows, integrating PgHero into the monitoring stack provides a quick way to detect inefficiencies and maintain database stability.