When we started working on a PostgreSQL fork tailored for Odoo, one of the questions we asked ourselves was straightforward: are the JSONB columns that Odoo uses to store translatable fields like name actually causing a performance problem? The assumption seemed reasonable. Odoo stores fields such as product names and model labels in a format like {"en_US": "Product A", "fr_FR": "Product A"} in a JSONB column instead of a plain text column. Intuitively, that has to cost something. So we set out to measure it properly.
Why We Expected JSONB to Be Slower
To understand what we were testing, it helps to know how differently PostgreSQL handles these two column types under the hood. When you read a plain char or text column, PostgreSQL locates the column's offset in the heap tuple, reads the raw bytes, and hands them back. That's it. There is no transformation, no parsing, no intermediate representation, just bytes off the page delivered directly to the client.
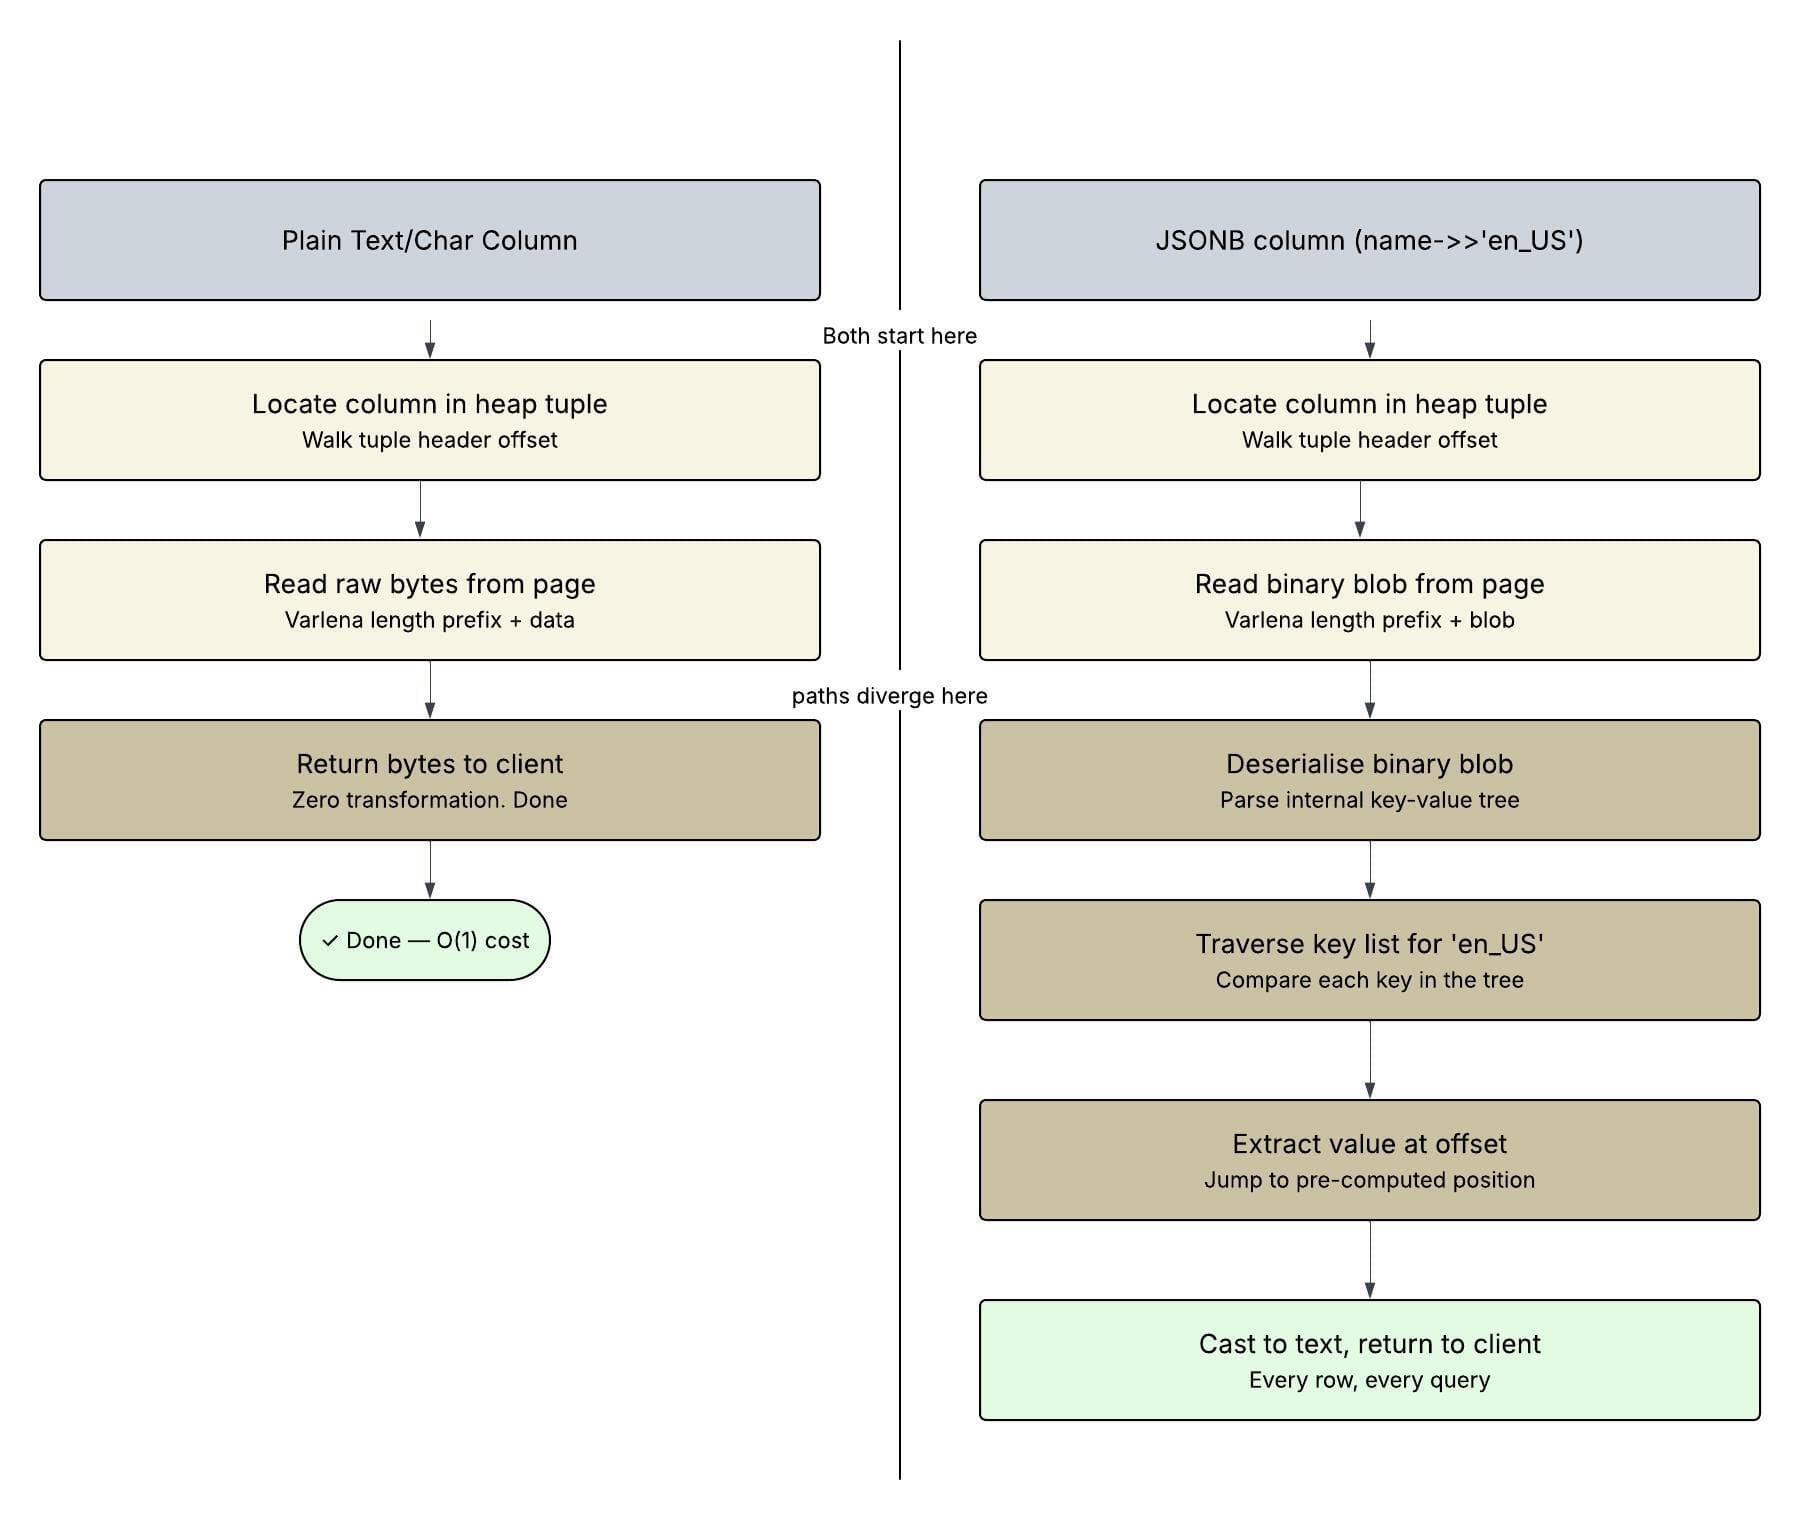
Reading a JSONB column and extracting a key with name->>'en_US' is an entirely different story. PostgreSQL stores JSONB in a custom binary format, not as raw JSON text, but as a serialised binary blob with an internal key-value tree. When you ask for a name->>'en_US', PostgreSQL has to deserialise that binary blob, traverse its internal key structure to locate the en_US key, extract the value bytes, and cast them to text before returning anything. Every single row pays this cost, independently, on every query. On top of that, JSONB blobs are physically wider on disk than a plain text value because they carry all locale translations together, en_US, fr_FR, de_DE and whatever else is configured, meaning more storage pages need to be read for the same number of rows.
Given all of that, we expected our benchmarks to confirm a clear and measurable gap between the two approaches.
What the Benchmarks Actually Showed
We set up two tables: product_template with name as a JSONB column, and product_template_custom with name as a plain text column and ran equivalent queries across both at 10,000 and 50,000 rows. We tested simple SELECT projections and ORDER BY queries with a LIMIT. The results genuinely surprised us.
-- FOR CUSTOM TABLE CREATED WITH NORMAL CHAR "NAME" FIELD
jsonb_check=# explain analyze select name from product_template_custom;
                                                           QUERY PLAN
---------------------------------------------------------------------------------------------------------------------------------
 Seq Scan on product_template_custom  (cost=0.00..1617.00 rows=50000 width=23) (actual time=0.014..75.138 rows=50000.00 loops=1)
   Buffers: shared hit=1117
 Planning Time: 0.038 ms
 Execution Time: 137.254 ms
(4 rows)
Time: 137.749 ms
-- FOR PRODUCT TABLE WITH JSONB "NAME" FIELD
jsonb_check=# explain analyze select name->>'en_US' from product_template;
                                                        QUERY PLAN
--------------------------------------------------------------------------------------------------------------------------
 Seq Scan on product_template  (cost=0.00..1849.45 rows=50036 width=32) (actual time=0.016..78.214 rows=50036.00 loops=1)
   Buffers: shared hit=1224
 Planning:
   Buffers: shared hit=2
 Planning Time: 0.091 ms
 Execution Time: 136.955 ms
(6 rows)
Time: 137.514 ms
At 10,000 rows, both queries finished in approximately 28 - 29 milliseconds. At 50,000 rows, both sat around 136 - 137 milliseconds. Across every test we ran, the execution times were statistically indistinguishable. On the surface, it looked like there was no difference at all.
Why the Times Were the Same And Why That Doesn't Mean There's No Problem
After digging into the EXPLAIN ANALYZE output carefully, we understood what was happening. The bottleneck in both cases was not CPU processing; it was memory bandwidth. PostgreSQL was spending the majority of its time simply moving buffer pages from shared_buffers into backend-local memory. At 10,000 rows, that cost around 27ms per query. The JSONB deserialisation cost, roughly a few microseconds per row, was entirely buried inside that I/O wait. You simply cannot see a 10–15ms CPU effect when the surrounding I/O already costs 27ms.
However, the buffer counts told a more honest story. The JSONB table consistently consumed more buffer pages than the text table 245 versus 228 at 10K rows, and 1,224 versus 1,117 at 50K rows. That is roughly 8–9% more pages for the same number of rows, a direct consequence of JSONB rows being physically wider on disk. This matters because buffer pages are a finite resource. As tables grow and shared_buffers fill up, wider rows cause more frequent cache evictions, which eventually push data onto disk and turn a hidden CPU cost into a very visible I/O penalty.
The planner also acknowledged the overhead even when the execution times did not show it. In our ORDER BY tests, the planner's estimated cost for the JSONB sequential scan was consistently 25 cost units higher than for the text column, a roughly 6% premium that the planner correctly propagated through the entire query plan, even though actual timing variance swallowed the difference at this scale.
When the Overhead Does Become Visible
Our testing made it clear that the JSONB overhead in Odoo is not a problem for small-to-medium installations running simple lookups by primary key and those make up a large portion of Odoo's query patterns. However, the gap opens up under three specific conditions.
- When name->>'en_US' appears in a WHERE filter or ORDER BY clause without an expression index, PostgreSQL must deserialise every JSONB blob in the table during a sequential scan, and that cost multiplies directly with row count. At 500,000 rows, this is no longer invisible.
- Under high concurrency, each backend session independently deserialises JSONB in its own local memory; there is no shared deserialization, so the CPU cost scales linearly with active sessions.
- As tables grow large enough that shared_buffers can no longer hold the full dataset, the wider JSONB rows accelerate cache pressure and cause more frequent disk reads than an equivalent text table would.
What our research ultimately showed is that JSONB and plain text columns perform nearly identically at moderate data sizes, not because the overhead is absent, but because, in our test setup, the workload was memory-bandwidth bound. The extra deserialisation, key traversal, and type casting that JSONB demands per row is real, and the buffer counts prove it. The overhead is simply deferred, surfacing only as data scales, concurrency rises, or unindexed filters and sorts come into play.