It tends to be highly disappointing and frustrating if you don’t have sufficient information readily available. Business organizations often face this challenge across their different operational cycle. They frequently face the challenge of pulling and manipulating information manually from different sources which can be inefficient, imperfect and tedious. However, a dashboard can be a key to their business woes.
Business organizations can make better choices through dashboards. Business intelligence dashboards can play a significant role, much like the analytic tools featuring Big Data across all industries. These dashboards can offer the business departments- critical reporting of the business conducts and metrics data, that are essential in business performance management. With real-time key metrics, performance indicators, guiding choices and better exploration of the business landscape, dashboards can simply take the business to its next level.
Conceiving the same, Cybrosys Technologies have crafted the module, ”ADVANCED GRAPH VIEW – DASHBOARDS” in Odoo. The application module is built in Odoo v12 and works well in both Odoo Community and Odoo Enterprise Edition.
The module envisions to analyze almost every aspect of the business operations that are recorded in Odoo, no matter whether its accounting, sales, purchase, human resources or customer relations. The module remains self-reliant in detailing different business cycles.
Advanced Graph View-Dashboard comes with 7 types of chart offering complete vicinity to the business conducts. One can seamlessly build and modify a wide assortment of charts including Pie Chart, Donut Chart, Bar Chart, Horizontal Bar Chart, Line Chart, Radar Chart and Polar Area Chart utilizing Advanced Graph View-Dashboards module.
Charts in Advanced Graph View-Dashboard enables you to visualize your information in real-time that you can settle on better choices quicker. With 7 distinctive chart types, the module displays different patterns and measurements of your live business information. The flexibility of the module makes it stand out from the rest of the crowd. It simply offers adaptability to work with other Odoo modules and display your information the way you need.
Each chart within the module comes along with its own extensive functionality. For example:
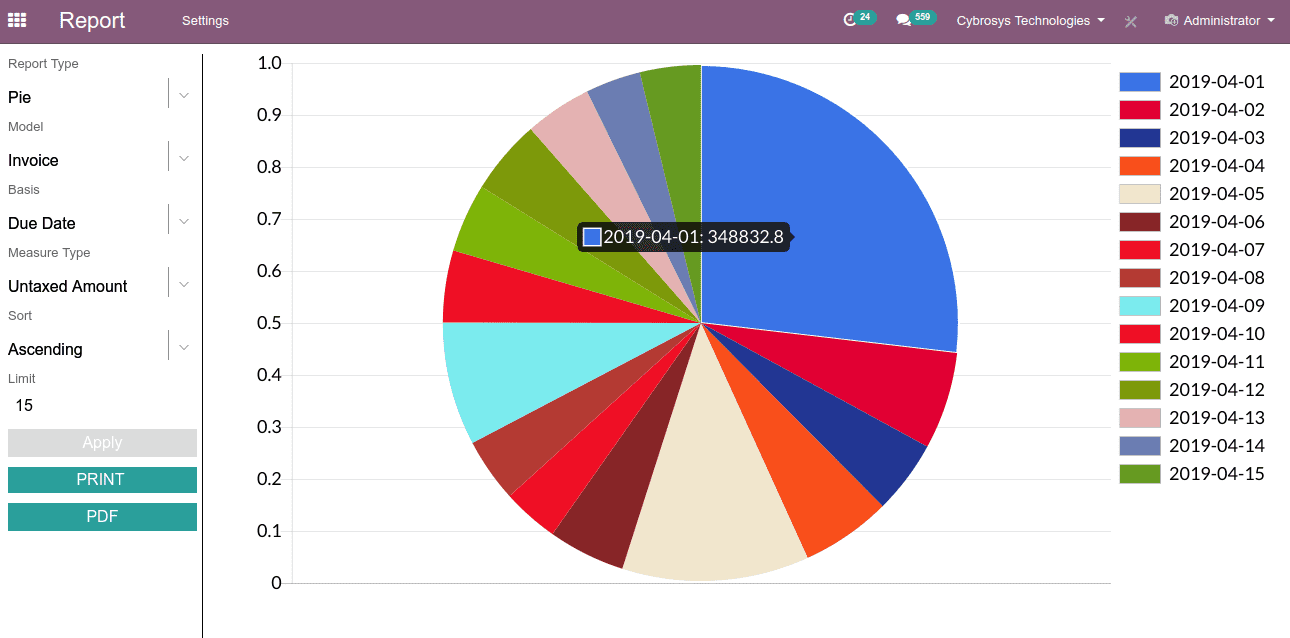
The Pie Chart can be utilized for better representation of business proportions and percentages
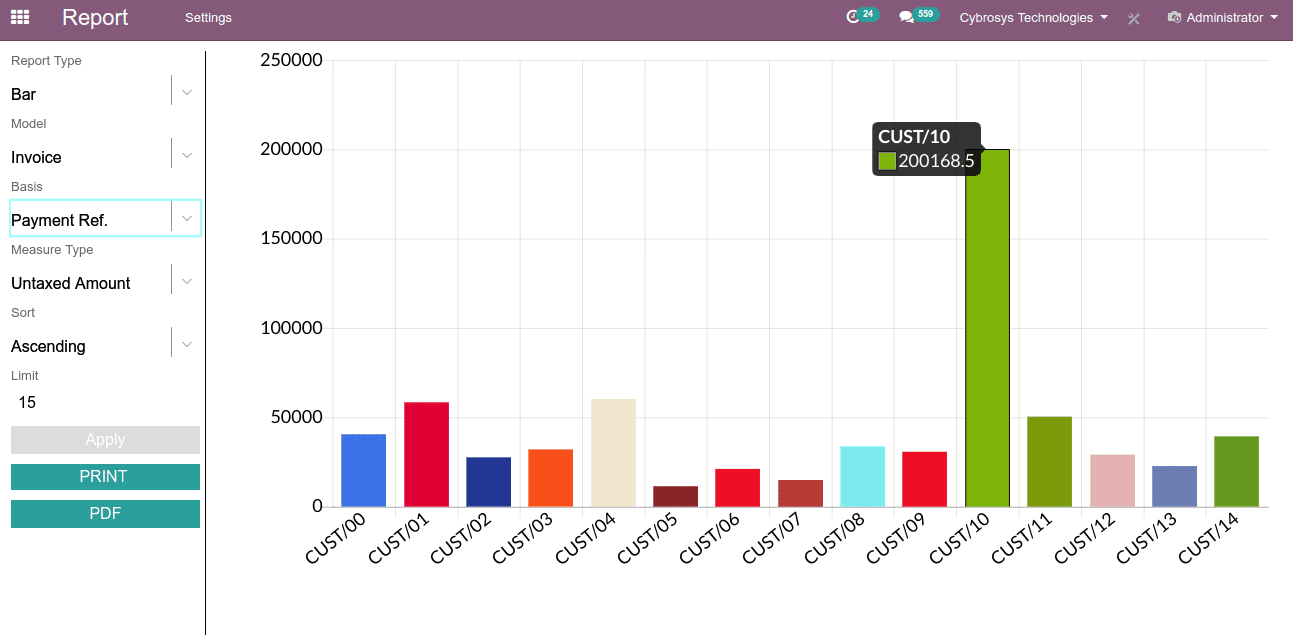
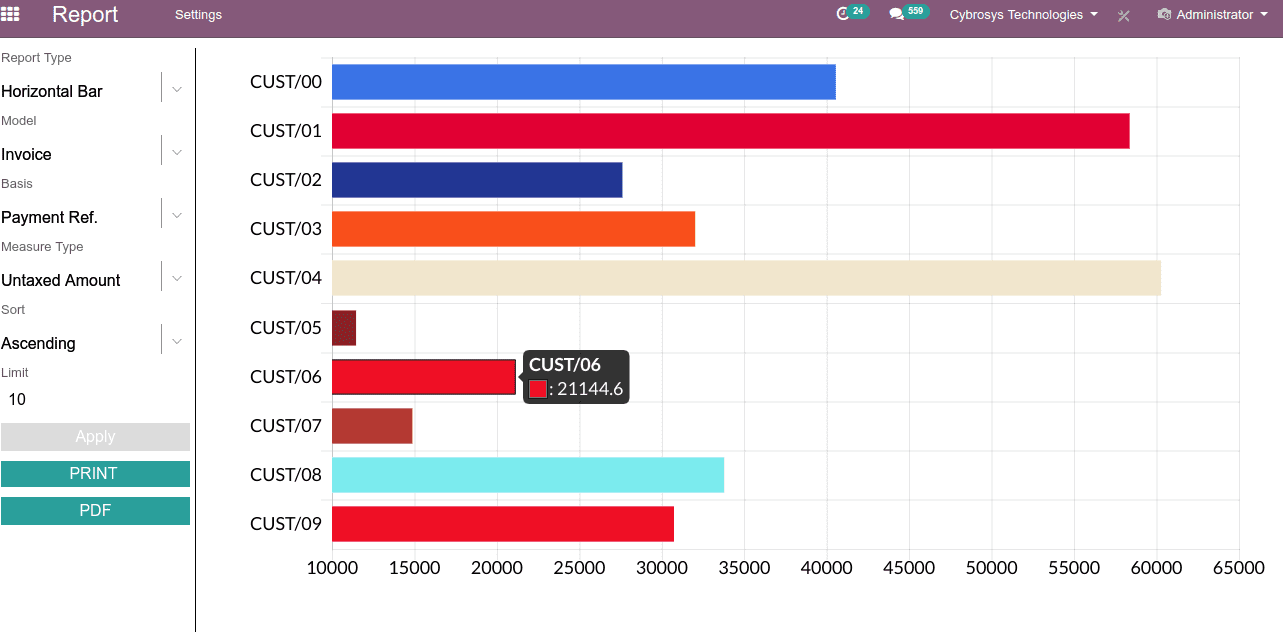
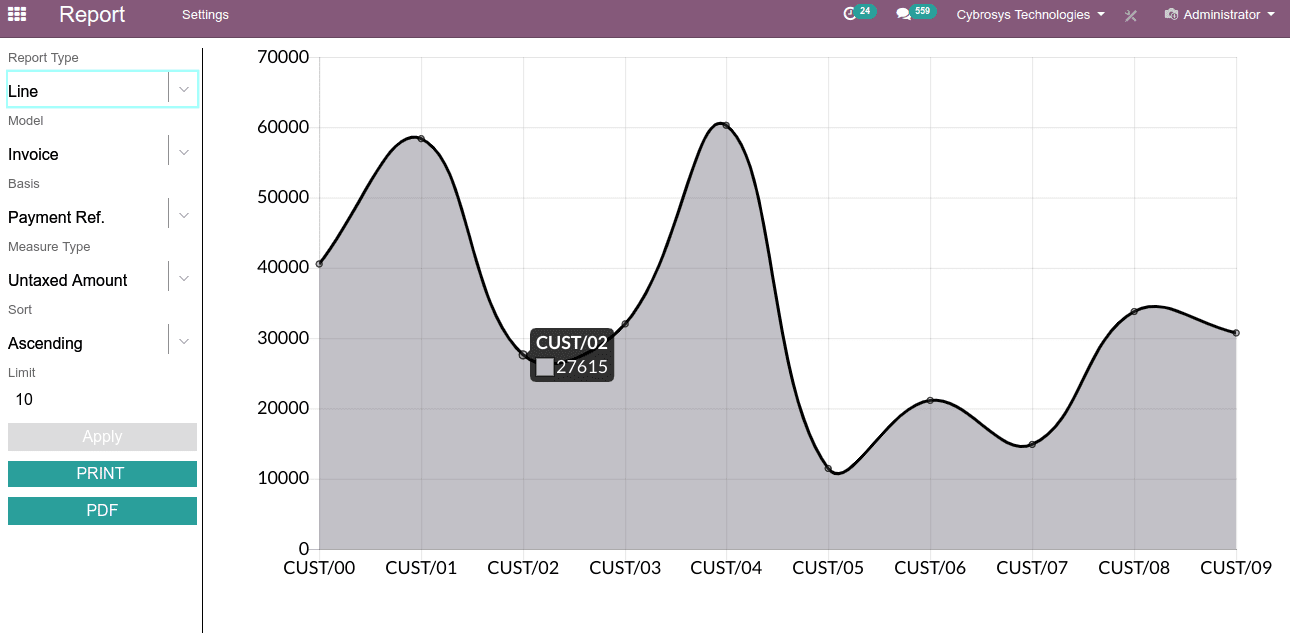
Bar Charts and Column charts function admirably for correlations and Line Charts helps to display the patterns or the rate of progress after a change in time.
Line Chart
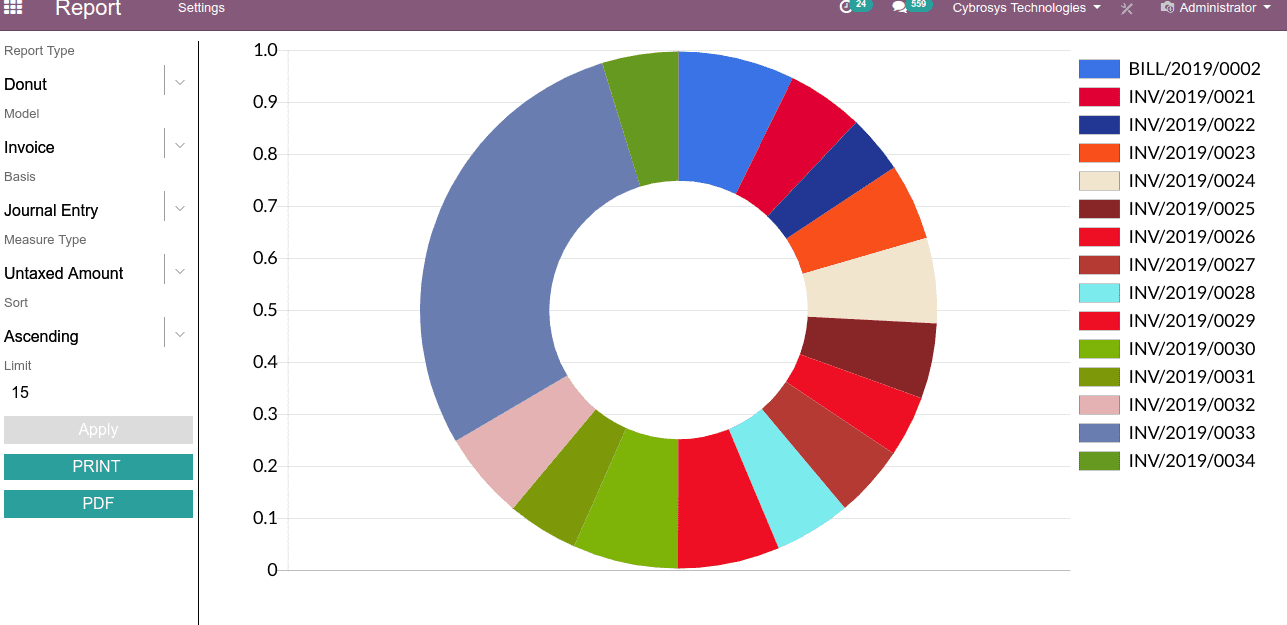
Donut Chart
Radar Chart

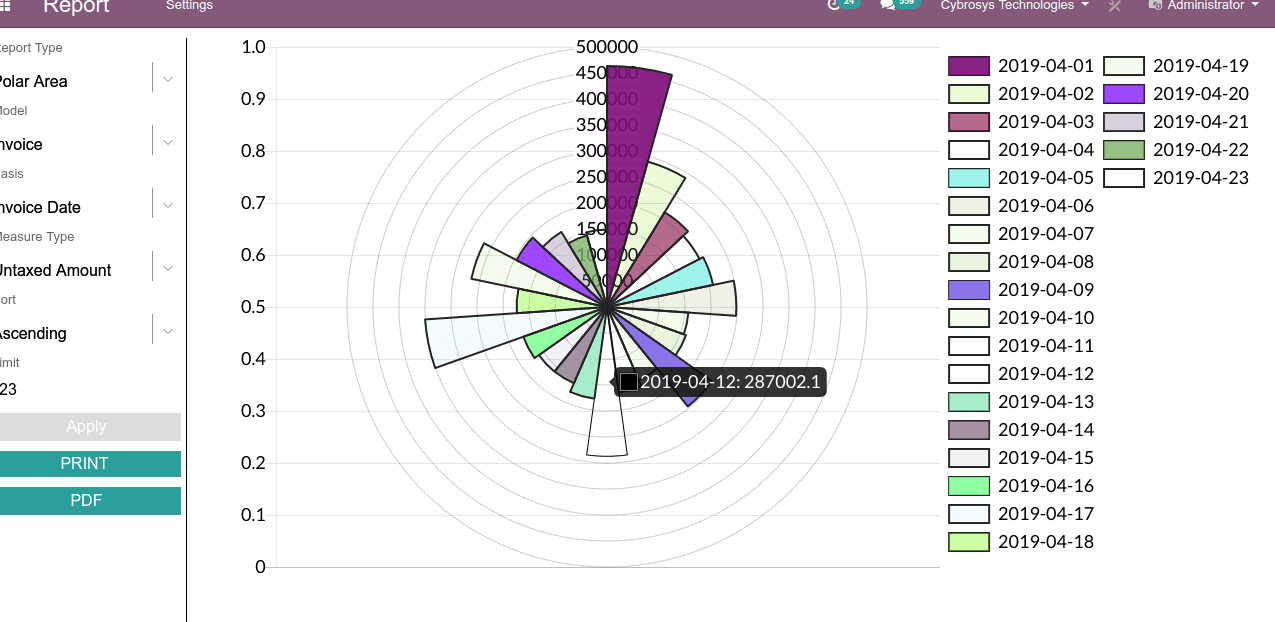
Polar Area
One can simply create the astonishing graphical reports using the simplest user interface laid by the module. Here, the end user acquires the capacity to personalize the content, oversee them, create and offer reports, nonetheless distribute a boundless number of charts based on preferred frequency.
Briefly saying, right from acquiring real-time insights and competitive analyses, the Advanced Graph View module remains self-reliant in performing all necessary actions that you desire. It loads real-time data over any changes made to the user interface. In addition, one can also avail both hard copy and soft copy of the reports via clicking appropriate buttons set in the module.
Now let me a brief, the workflow of Advanced Graph View-Dashboard.
Configuration:
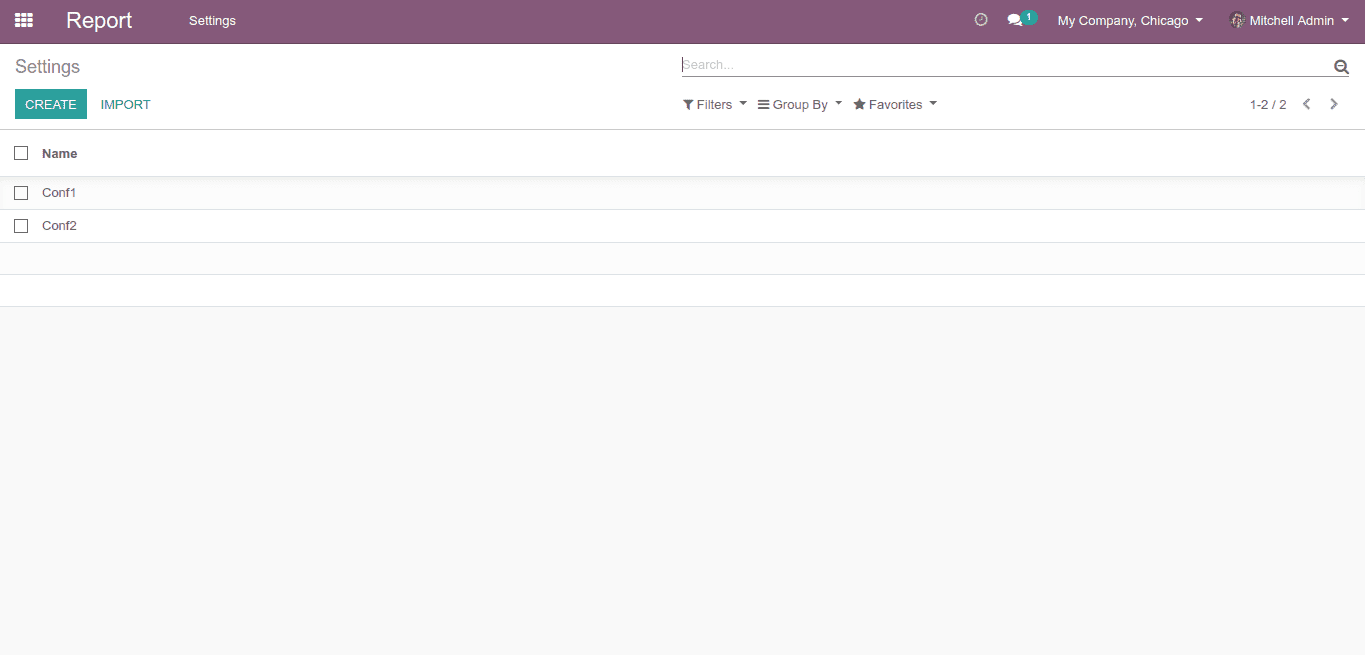
The module provisions to configure the models as per your choice. One can decide what to be displayed and what not via configuration.
The end user can also create multiple sets of configurations and later enable/ disable them as per the need.
Only those models that are enabled in the configurations shall be displayed in the graphical interface.
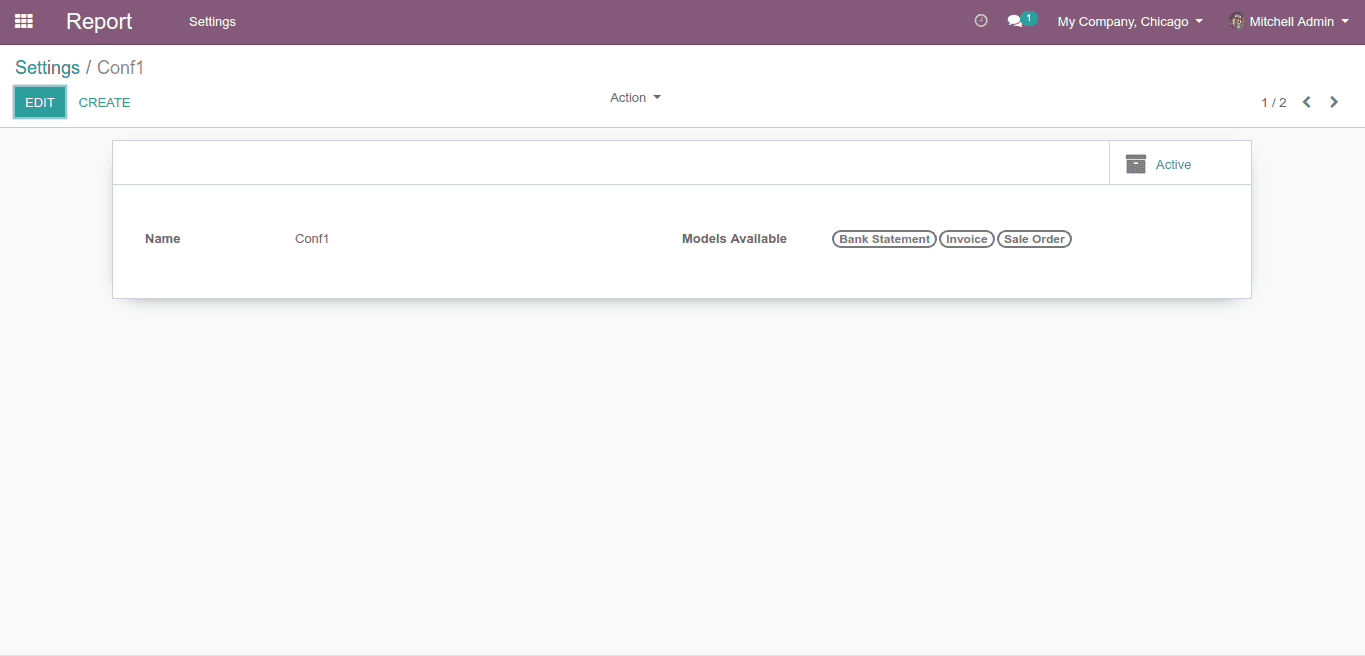
Chart Interface:
Under the chart interface of the module, one has several components to generate and manipulate the report. The components include:
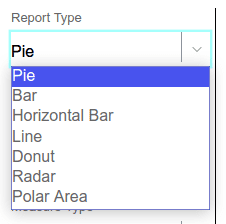
Report Type:
The report type is a lookup field that allows users to select the type of chart from the list comprising- Pie Chart, Bar Chart, Horizontal Bar Chart, Donut Chart, Line / Area Chart, Radar Chart, and Polar Area Chart.
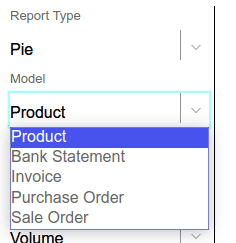
Model:
The model field lets the user select the Odoo model from any of the active configuration. This field determines where the data of the report should be collected.
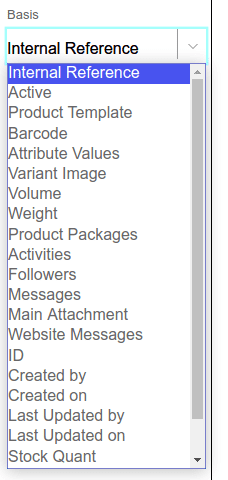
Basis:
The lookup field lets the user choose any field from the selected model. It performs like an independent axis in the module. Based on the field, the data shall be aggregated and grouped together.
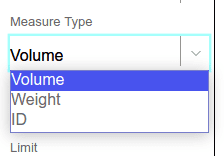
Measure:
The field functions as the dependent axis on the graphs. The field’s lookup values are filtered based on their data types. Only the numeric and monetary values can be selected here. These values will be grouped based on the independent axis (The Basis Field).
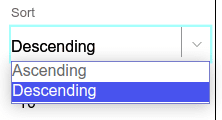
Sort:
The choice over ascending or descending mode of sorting can be made here. The field helps the user to get tail values or head values.
Limit:
This is a numerical field that helps to limit the number of records retrieved from the database. This comes handy in two situations. One first note, if the user have huge data set and need to retrieve only a specific number of information.
And the second when user need to sort the information say retrieve first n values or last n values.
Print:
The print button enables the user to acquire hard copy of the data via directly connecting them to a hardware.
PDF:
The PDF button enables the user to export generated graph to a PDF file, which can be downloaded later.
Doesn’t it worth?
If you are interested in buying this Odoo app for your business go to Advanced Graph View - Dashboards and for availing any service of Cybrosys in Odoo, kindly drop a request to info@cybrosys.com.