In Odoo, we have a variety of views such as tree, form, kanban, graph, calendar, and many others. Each of the accessible views will assist you in defining the facts in a unique way that is sustainable for your understanding. Furthermore, view selection choices are provided in practically every Odoo menu.
In this blog, let us discuss how to create and manage the Gant Chart view in Odoo 15
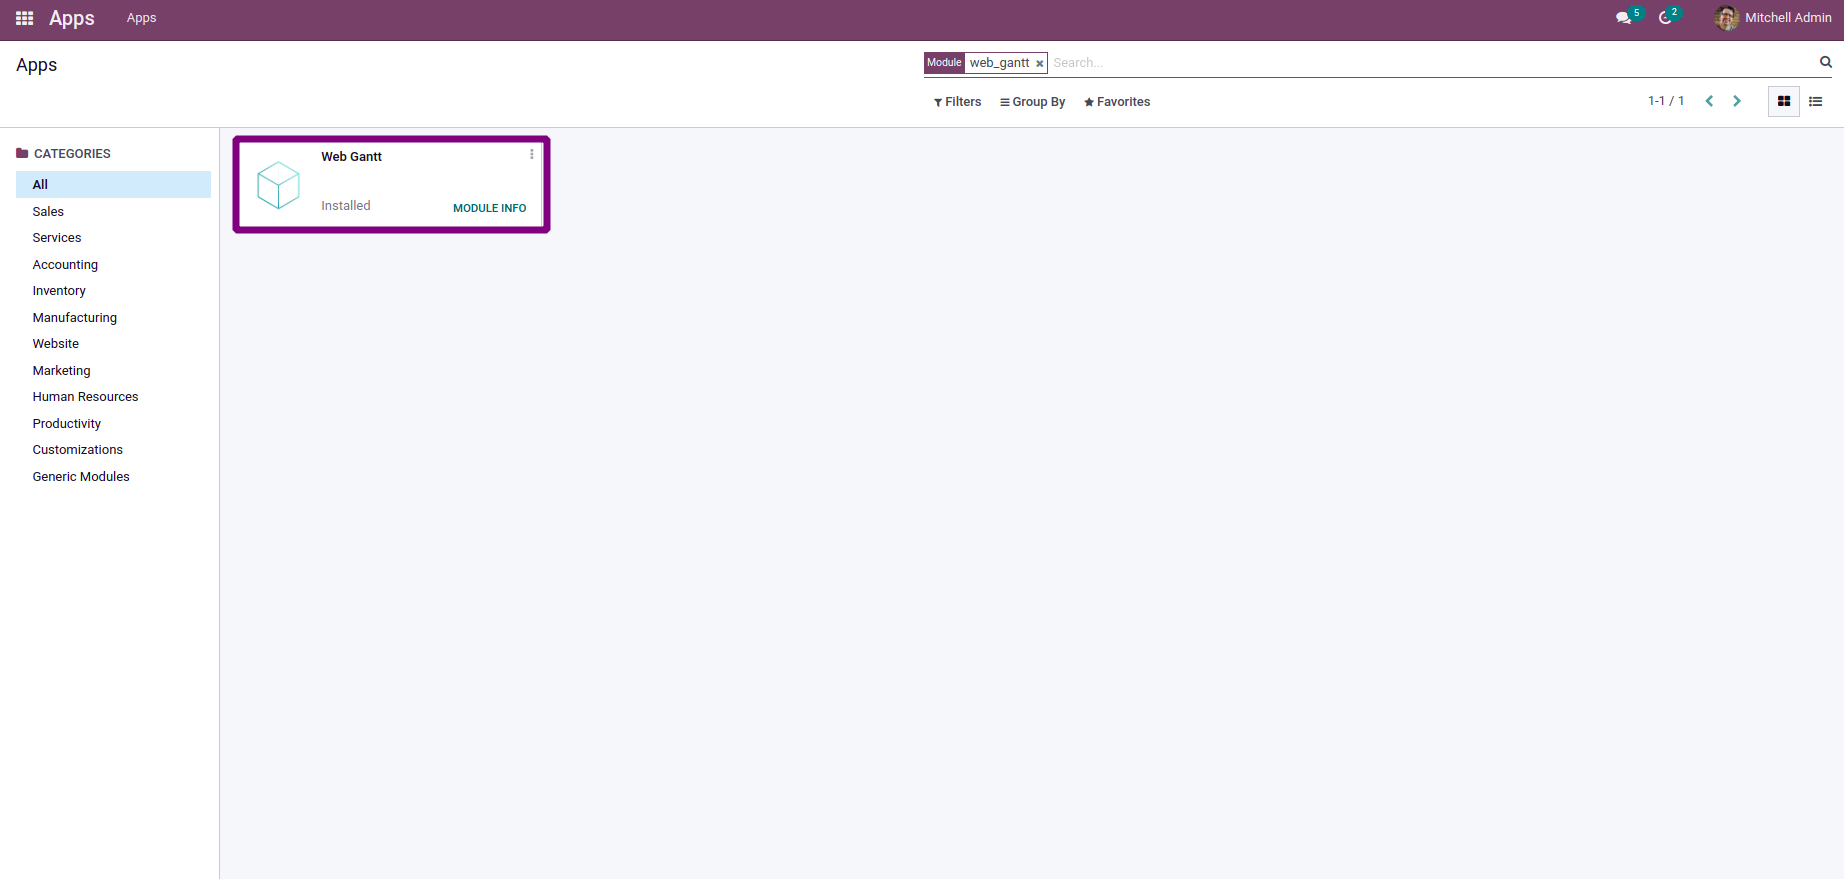
Currently, the Gantt view is only available for the enterprise version of Odoo as the ‘web_gantt’ module can only be installed in the enterprise version of Odoo.
A Gantt can be defined as a graphical display of the project and all the corresponding tasks associated with it. The time it will take to complete the task is represented by each bar on the graph.
On top of all the grouped tasks, a resource allocation summary bar displays the efficiency with which resources are allocated among the tasks.
Then, let us go through the Gantt view of Odoo in more detail. And we all know the different sorts of bar charts, such as horizontal and vertical. In addition, the Gantt view in Odoo utilizes the horizontal bar chart concept.
Example: The Gantt view in the Planning module is shown in the figure below.
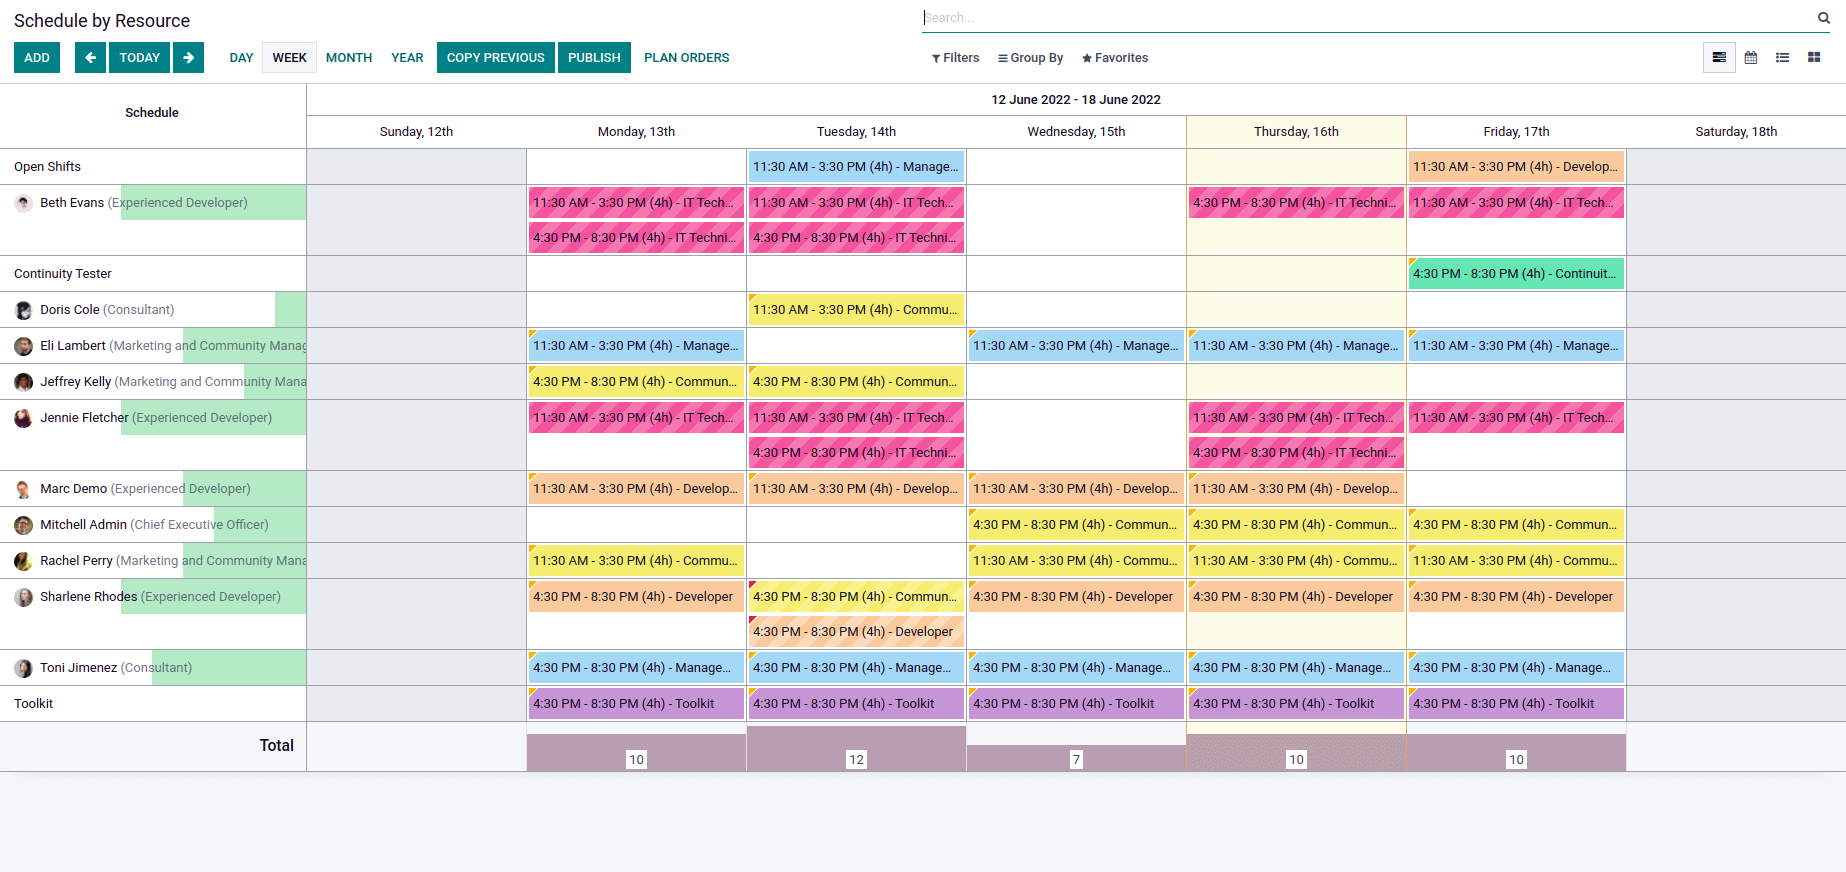
The Gantt view's core representation concept is planning, therefore you can use it to plan your project, production, or anything else. It can also be used as a report of analysis. It also has a more appealing and user-friendly appearance.
So, let's try to implement this view in our program. I'm going to make a simple basic Gantt view. Before we start creating a Gantt view, we need to double-check and double-confirm certain attributes and main items that will be used in the Gantt view.
Main Element
- Gantt tag
Attributes
- String
- Start date
- Stop date
- Default group by
- Progress
- Default scale
- Scales
- Precision
- Thumbnails
- Color
We're going to make a basic view now.
We'll need a model to depict a Gantt view first.
class TipsTricks(models.Model):
_name = 'tips.tricks'
_rec_name = 'name'
_inherit = ['mail.thread']
name = fields.Char("Name")
check = fields.Boolean("Active", default=False)
upper_name = fields.Char("UPPER NAME",       compute="_compute_upper_name")
partner_id = fields.Many2one('res.partner', 'Partner')
number = fields.Integer(string="Value", default=0)
date_deadline = fields.Date(string='Deadline', index=True, copy=False)
date_start = fields.Date(string='Start date', index=True, copy=False)
partner_ids = fields.One2many('res.partner', 'tips_id', string='Customers')
tag_ids = fields.Many2many('account.account.tag', string='Tags')
Then we'll need an XML file, similar to the ones we use to build form views, but instead of using the form tag, we'll use the Gantt tag and its properties.
<record id="tips_tricks_view_gantt" model="ir.ui.view">
<field name="name">tips.tricks.gantt</field>
<field name="model">tips.tricks</field>
<field name="arch" type="xml">
<gantt date_start="date_start"
date_stop="date_deadline"
default_group_by='partner_id'>
</gantt>
</field>
</record>
Let's go on to the next stage now that we've established the view. The Gantt tag has some characteristics and provides rudimentary functionality. As we progress to the top of the bar, the template is used to illustrate the specifics of each bar. After that, we must include the Gantt view mode in our action.
<record id="tips_menu_action" model="ir.actions.act_window">
<field name="name">Tips.Tricks</field>
<field name="res_model">tips.tricks</field>
<field name="view_mode">tree,form,calendar,graph,kanban,gantt</field>
<field name="view_id" ref="tips_tree_view"/>
<field name="help" type="html">
<p class="oe_view_nocontent_create">Create a New Tip
</p>
</field>
</record>
We've introduced a Gantt view to our form view mode.
Let's see the changes in the application once the code works. The view I developed is displayed below.
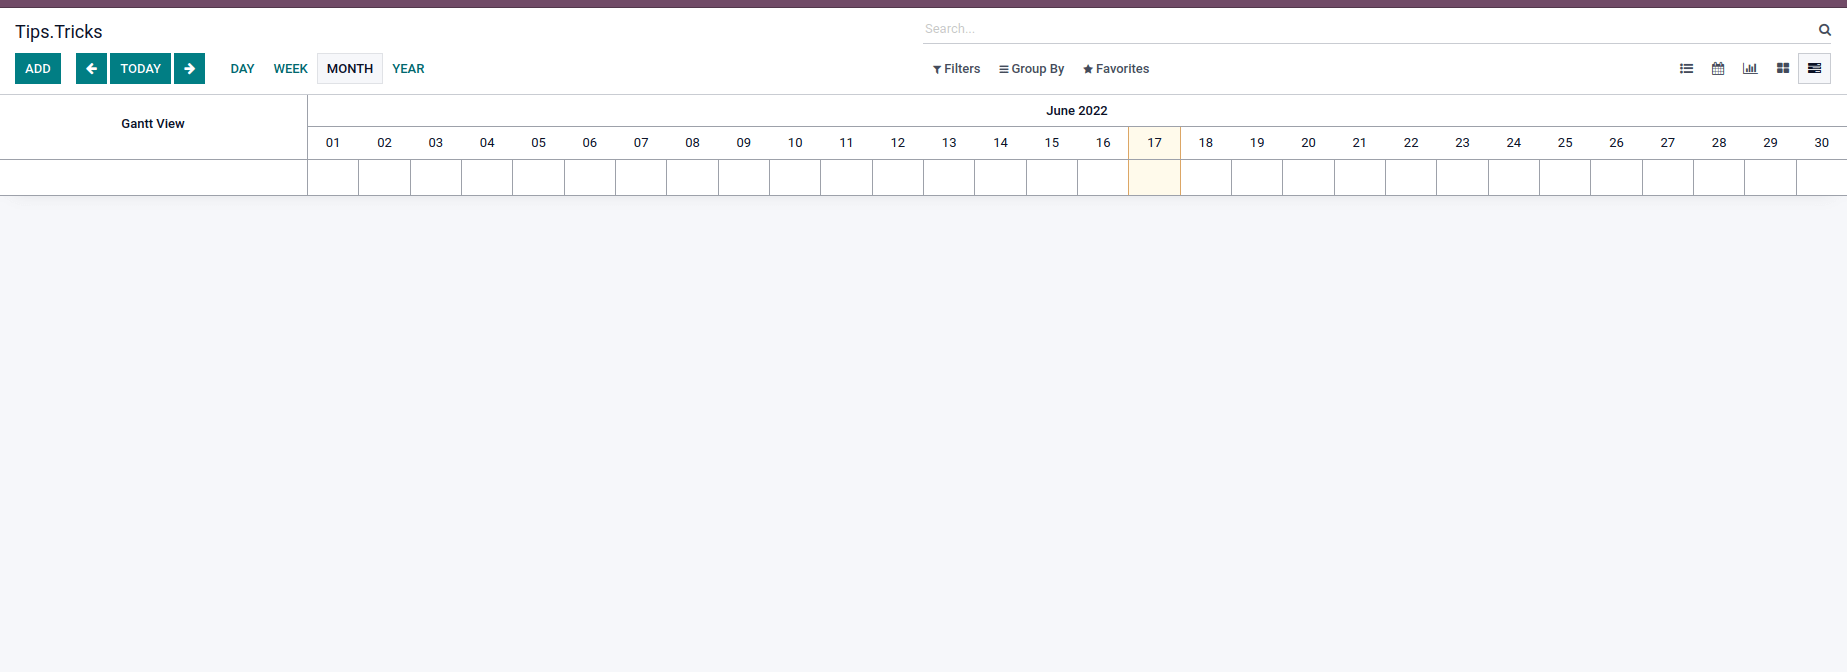
Data can be filtered by day, week, and year. The various hues represent different personnel allocations. Additionally, for more complex features, you can experiment with different properties within the Gantt tag.