JMeter is a popular open-source software tool used for load testing, performance testing, and functional testing of web applications. It was originally developed by the Apache Software Foundation and is written in Java.
JMeter is designed to simulate multiple users and their interactions with a web application, measuring performance and identifying bottlenecks or issues that can impact the user experience. It can be used to test various protocols such as HTTP, HTTPS, SOAP, FTP, and JDBC.
JMeter has a user-friendly interface and supports the creation of complex test scenarios using various features such as parameterization, correlation, and assertions. It can also generate various types of reports, graphs, and charts to help users analyze test results.
JMeter is widely used in the software testing industry and is a valuable tool for ensuring the performance, scalability, and reliability of web applications.
How to Install JMeter
JMeter is developed by Java. Require to install the latest version of JRE or JDK to run JMeter because Jmeter is developed by Java.
1. You need to check if Java is installed on the system. Run the below command
Java -version
Otherwise, you need to install Java on your system.
https://linuxhint.com/install-java-9-on-ubuntu/
2. Download Jmeter from Internet
Click on the following URL to install the latest version of Jmeter
https://jmeter.apache.org/download_jmeter.cgi
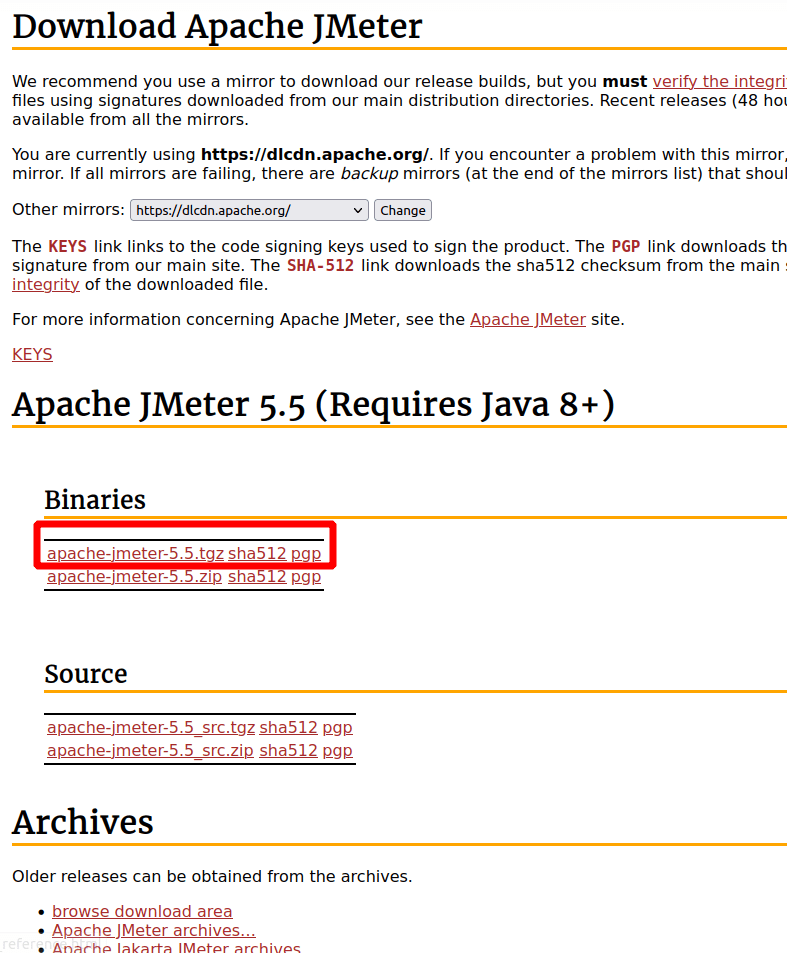
Download the binary file of Jmeter from the above link.
3. Unzip and keep the file at any location
* Open the file and open the terminal from the bin file
* run the command
sh jmeter.sh

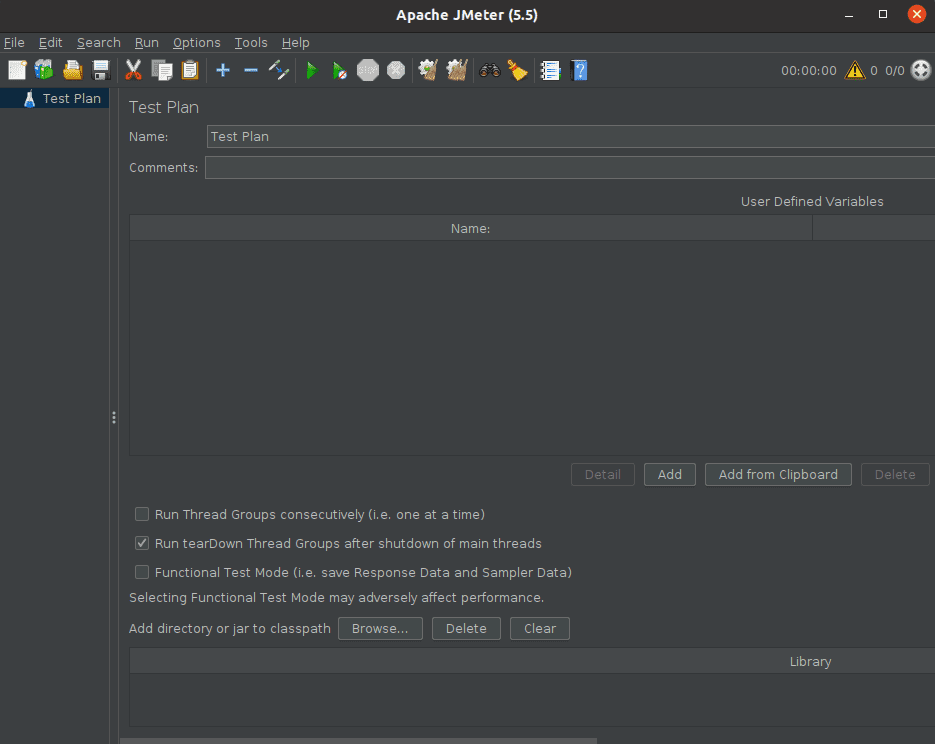
JMeter Web Test Plan
1. Rename the Test Plan and add Thread Group
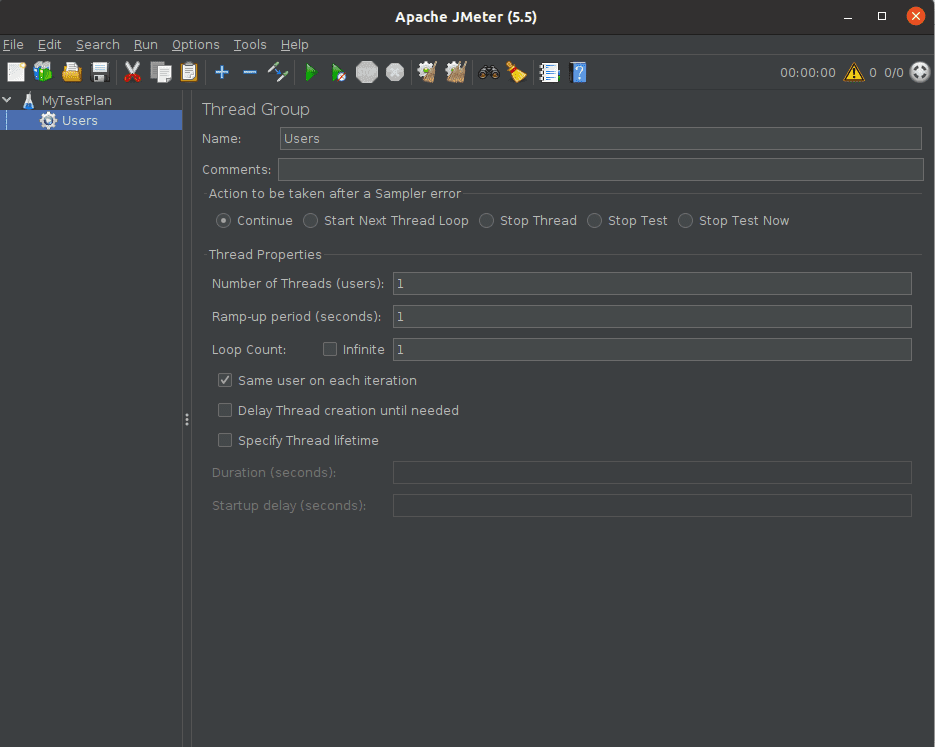
In JMeter, a thread group is a group of virtual users or threads that execute the same scenario or test case concurrently. The thread group is the primary element of a JMeter test plan, and it simulates real-world scenarios by generating multiple concurrent requests to a server or application under test.
* Right-click on the MyTestPlan - Add - Threads - Thread Group.
2. Add Sampler
JMeter provides a wide variety of samplers to support different types of protocols and technologies, such as HTTP, FTP, JDBC, SOAP, REST, and more. Each sampler has its own set of configurations, such as the target URL, method, request parameters, and more.
For adding a sample, right click on the Thread Group(Users): Add - Sampler - HTTP
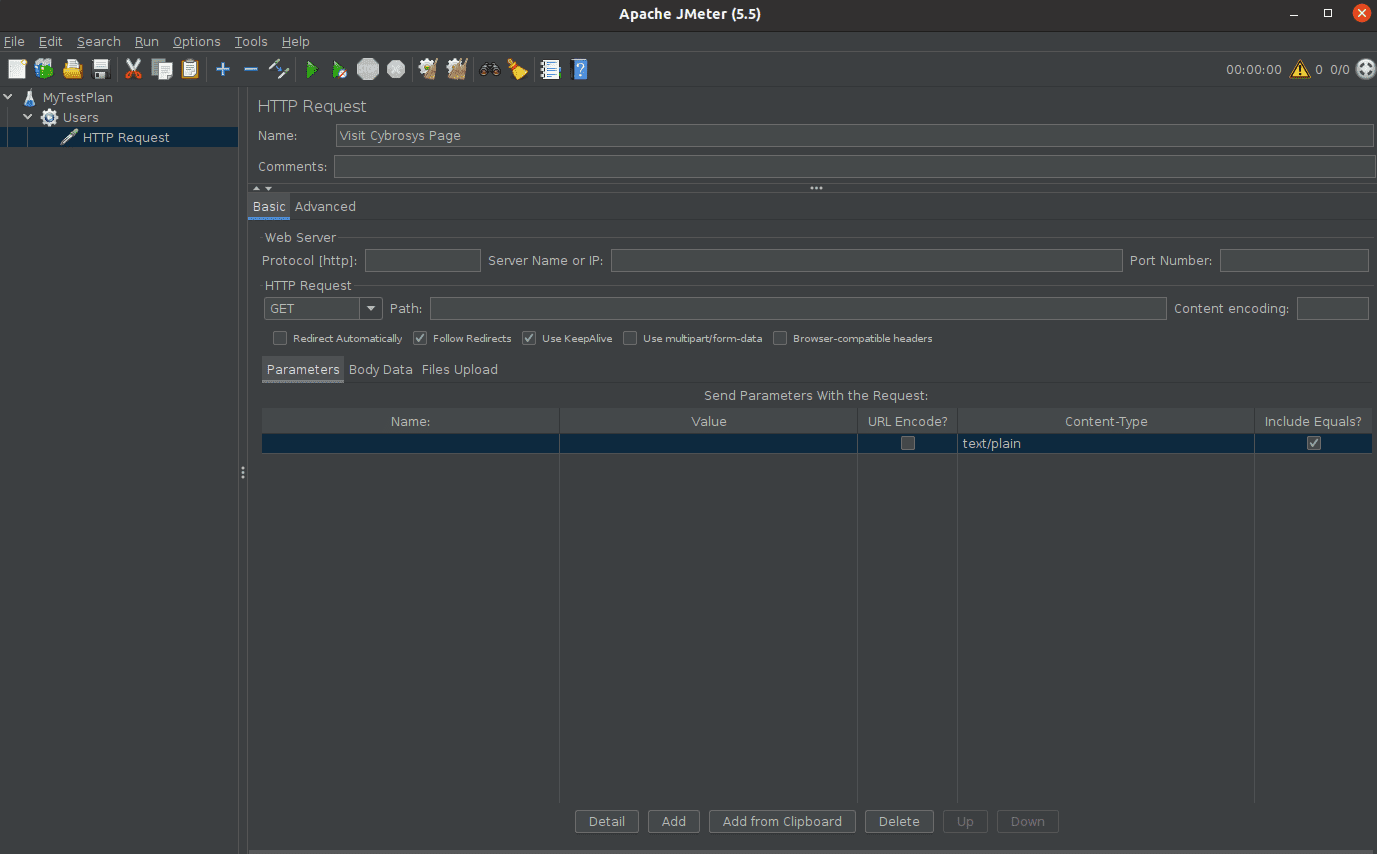
Here, a sampler HTTP Request is added under the users, Let’s fill in the request details,
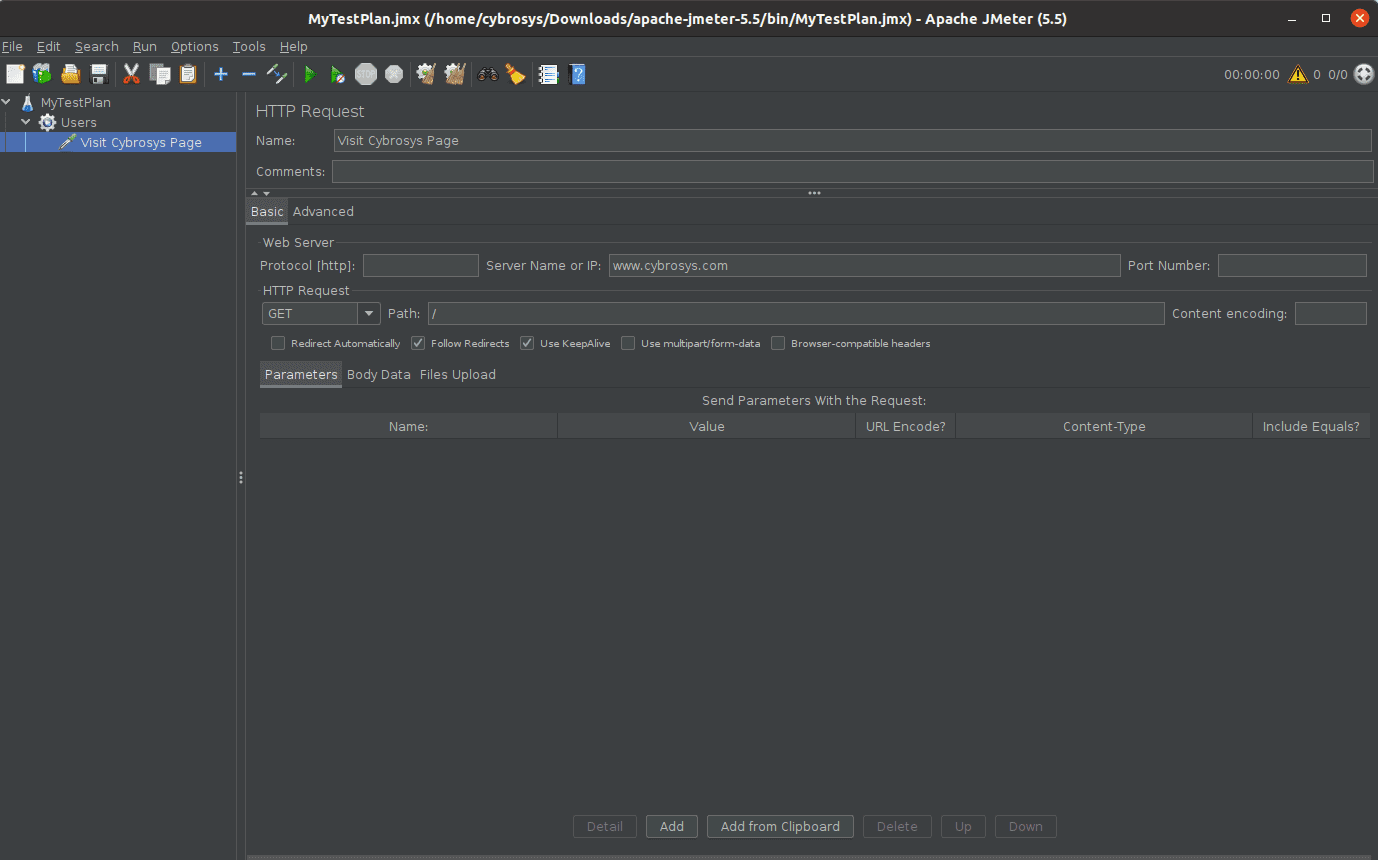
* Name - We can set a name related to the action, Visit Cybrosys Page
* Server Name or IP - We can give the required server name for testing, www.cybrosys.com (No need to mention http://)
* Protocol - HTTP is the protocol, so we can keep it blank
* Path - Giving path as / (slash), means we want the root page of the server.
3. Add a Listener
In JMeter, a listener is a component that captures and displays the results of a test run. Listeners can be added to a test plan to collect and analyze data about the performance of a system under different loads and conditions.
There are many different types of listeners available in JMeter, each with its own set of features and functions. Some common types of listeners include:
1. View Results Tree: Displays the full response data for each request, including headers and body.
2. Summary Report: Provides a summary of the test results, including the number of requests, the average response time, and the error rate.
3. Aggregate Report: Displays statistical information about each request, including the average response time, the number of requests, and the throughput.
4. Graph Results: Displays graphs of various test metrics, such as response time, throughput, and error rate.
5. Assertion Results: Displays the results of any assertions that were made during the test run.
Let’s add simple Listner View Results in Table.
Right click on the users - Add - Listner - View Results in Table
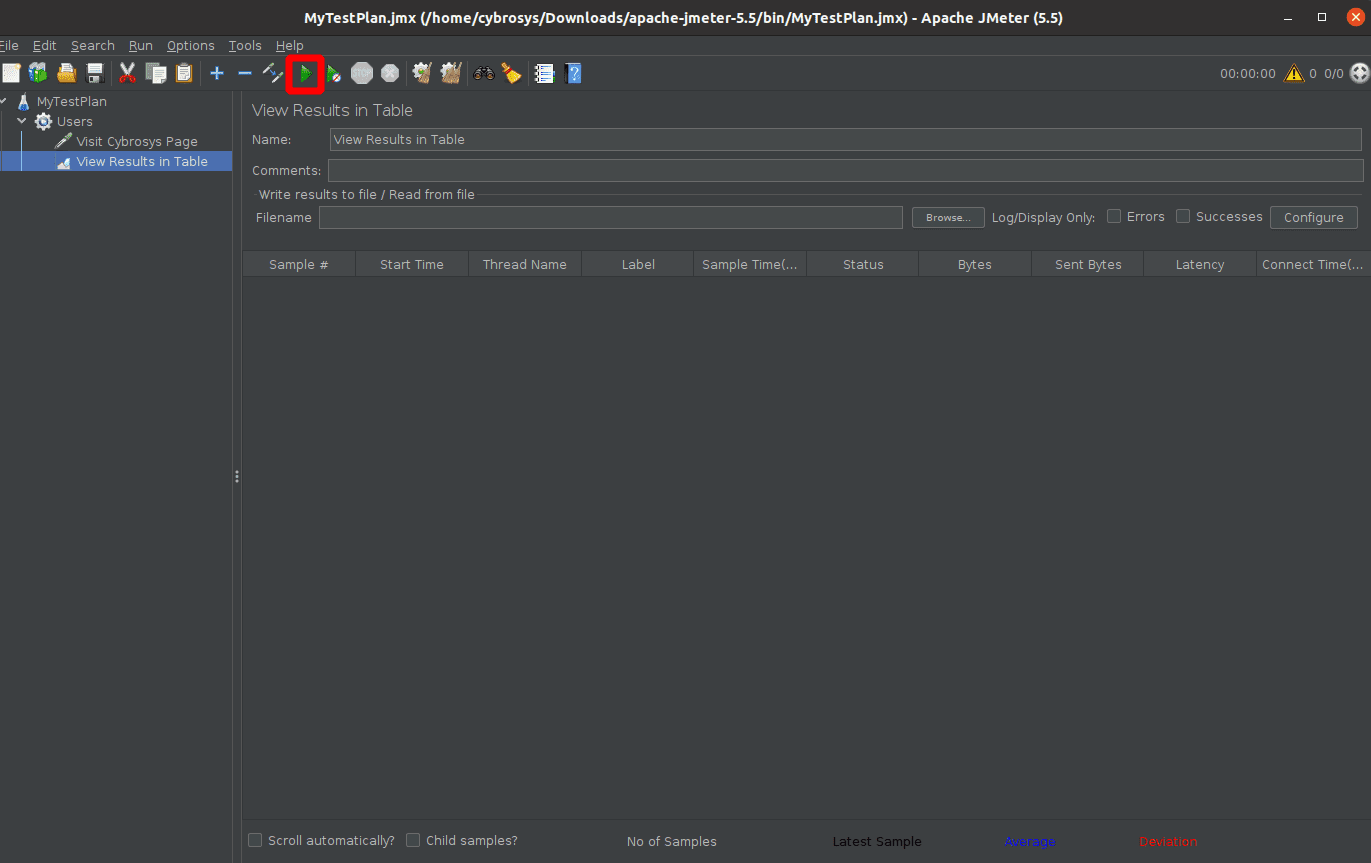
4. Run Test
We can simply click on the run button from the menu.
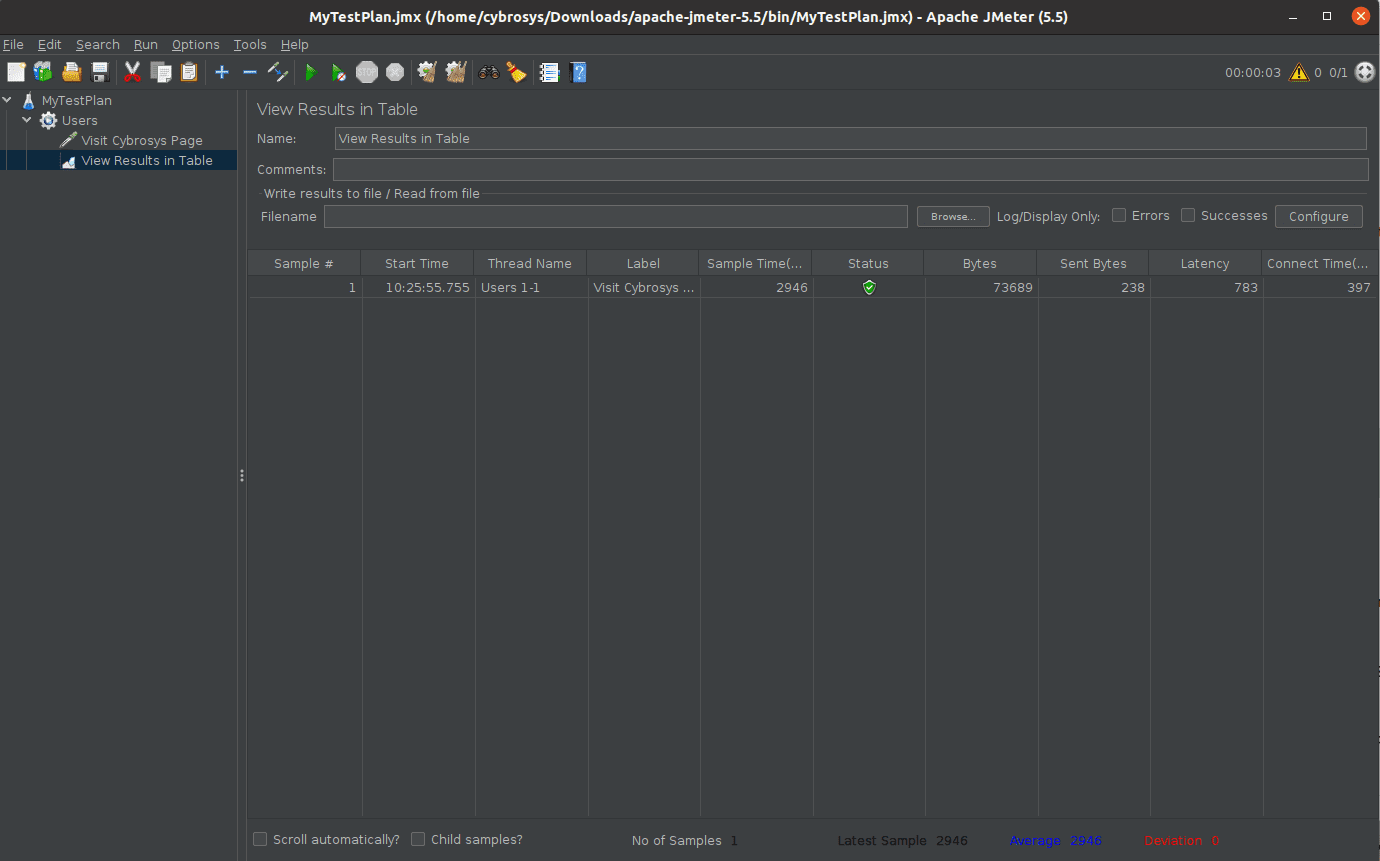
Sample Number: A unique identifier for each HTTP request.
HTTP Request: The name of the HTTP Request sampler.
Start Time: The time at which the HTTP request started.
Load Time: The time it took for the HTTP request to complete.
Error Count: The number of errors that occurred during the HTTP request.
Response Code: The HTTP status code returned by the server.
Response Message: The HTTP status message returned by the server.
Response Time: The time it took for the server to respond to the HTTP request.
Bytes: The size of the response data in bytes.
Sample Count: The total number of times the HTTP request was executed.
Error %: The percentage of requests that resulted in an error.
This is one of the simple test plans using Jmeter. Overall, JMeter is a versatile and powerful tool for load testing and performance testing of web applications. Its user-friendly interface, cross-platform support, scalability, and customization options make it a popular choice among developers and testers.