Even though cash flow is the central focus of the business, analyzing sales data is equally significant. If you do not properly analyze your sales, the organization won't be able to identify the growth and progress of your business. An effective sales analysis only can scale your business and get a clear picture of the current status of your business and what will be in the future.
An effective sales analysis can help you make correct sales and marketing decisions. Manually analyzing your sales and business will not always be an easy task. The digitalized tools will be very effective for the proper business and sales analysis. The Odoo 16 Sales module has a powerful reporting feature that will provide deep insight into your business and sales.
In this blog, let us have a glance at the Sales Analysis and Reporting features of the Odoo 16 Sales module.
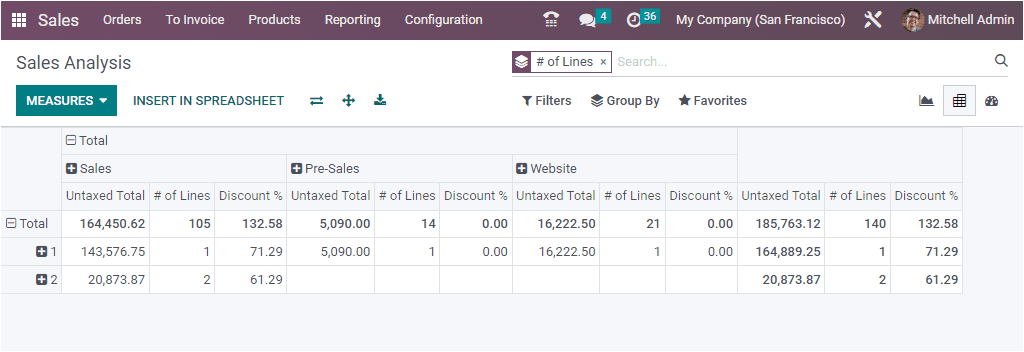
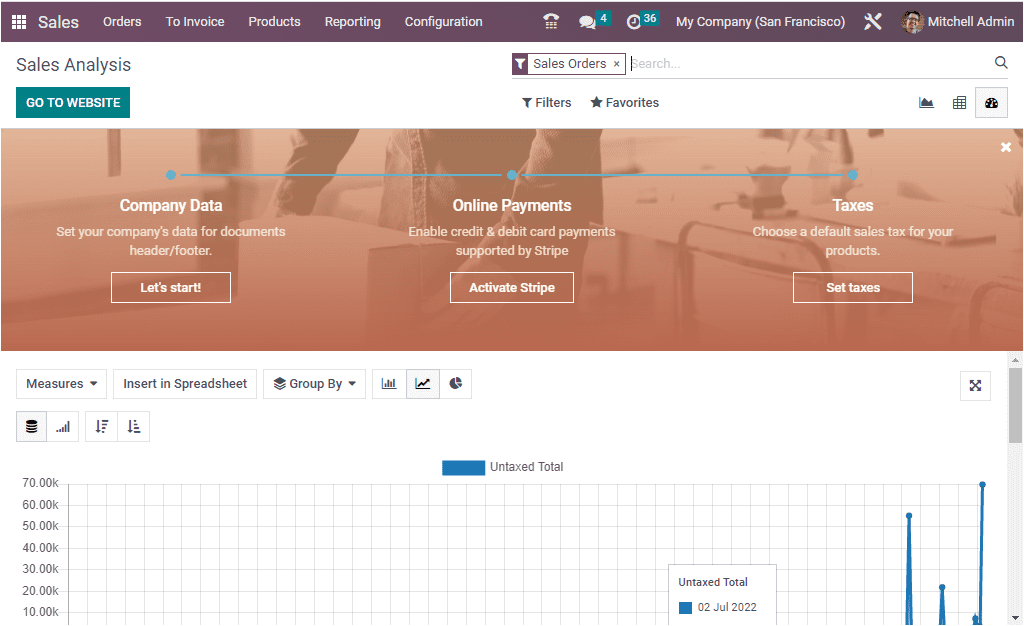
The Reporting tab of the Odoo 16 Sales module encompasses two sub-menus. Accessing this sub-menus is very effortless. A single click on the Reporting tab is enough to display the sub-menus Dashboard and Sales, respectively. When you open the Sales window by clicking on the Sales menu, you will get a clear picture of your company’s Sales analysis. Let us have a close look at this window.
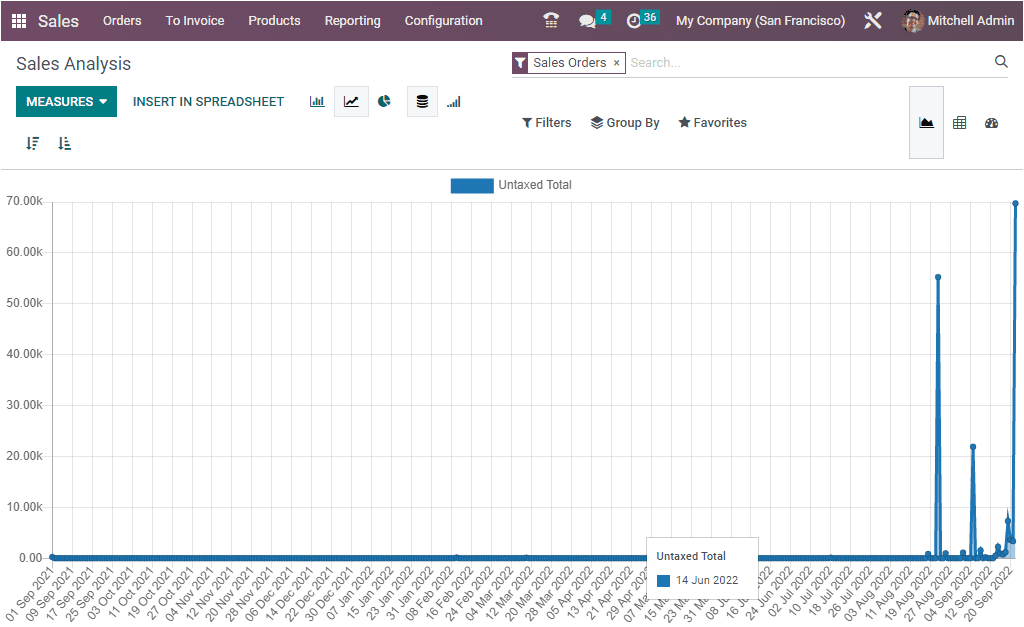
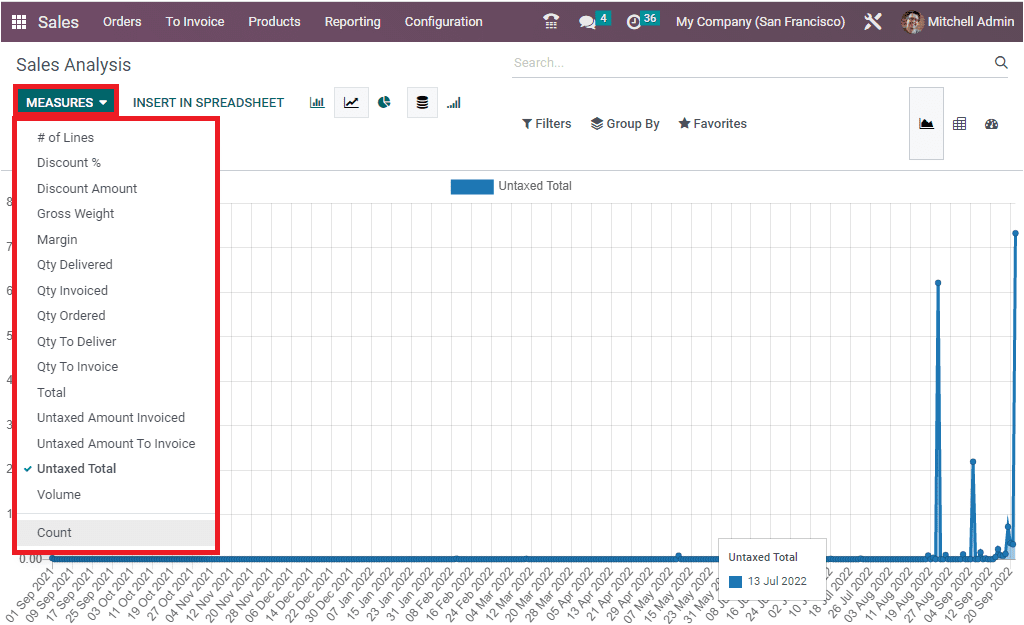
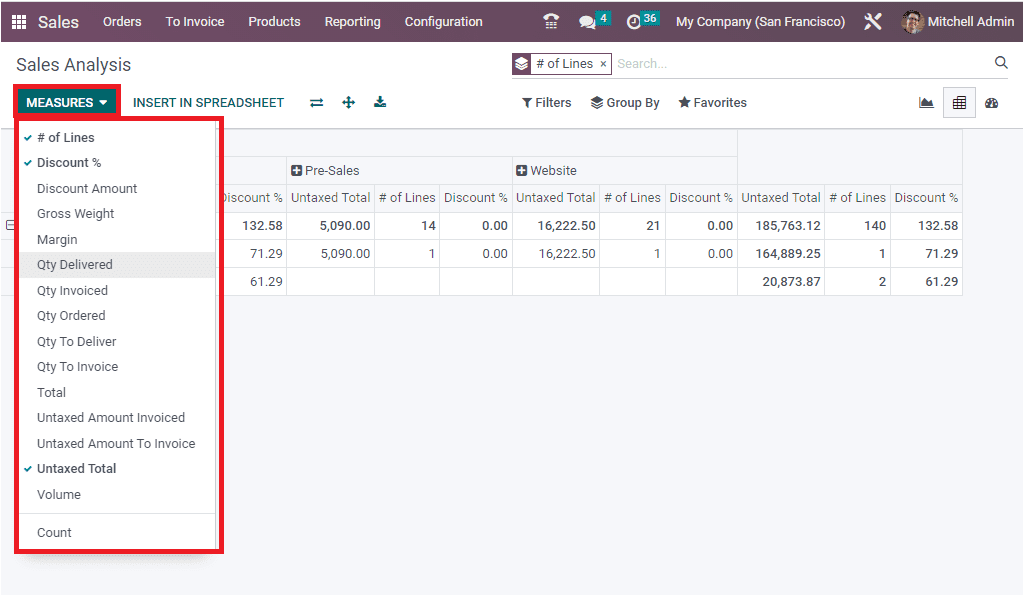
The window offers you every type of report analysis. Both quantitative and qualitative measures are available. The above image depicts the untaxed total analysis. To generate reports on various measures, you can apply different measures listed under the MEASURES tab. The various measures included in the system are # of Lines, Discount %, Discount Amount, Gross Weight, Margin, Quantity Delivered, Qty Invoiced, Qty Ordered, Qty to Invoice, Qty to Deliver, Total, Untaxed Amount Invoiced, Untaxed Amount To Invoiced, Untaxed Total, Volume, and Count.
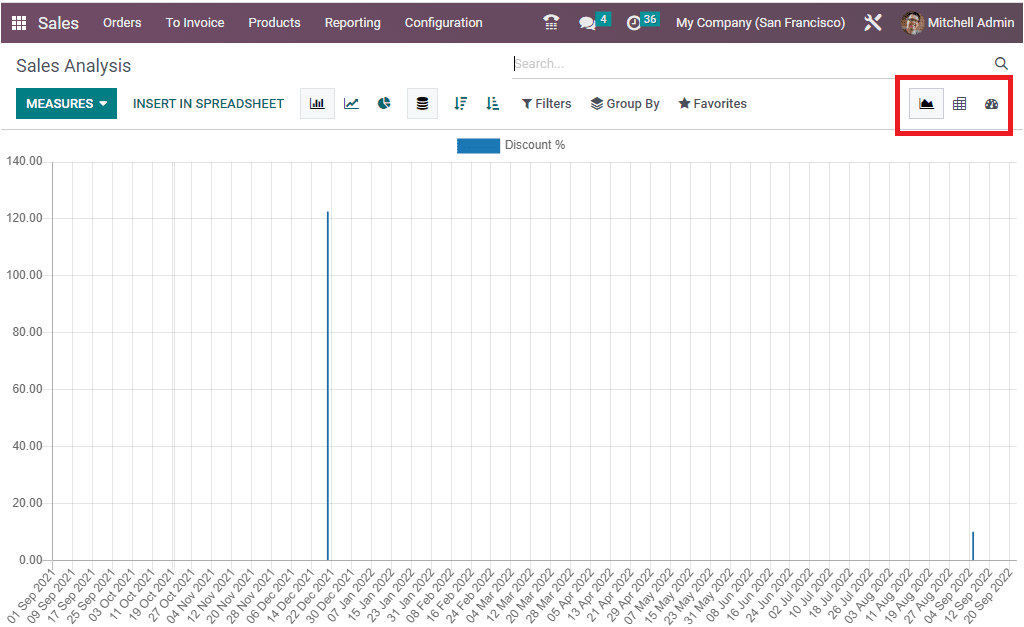
The Sales Analysis can be analyzed in graphical, pivotal, and dashboard views by choosing the respective menu icon. The menu icons are placed on the top right corner of the window - Graph, Pivot, and Dashboard icons, as shown in the image below.
In the Graph view, you have the option to view the reports in different forms, such as Bar Chart form, Line Chart form, and Pie Chart forms, by selecting the respective icons on the top center of the window, as shown in the image below.
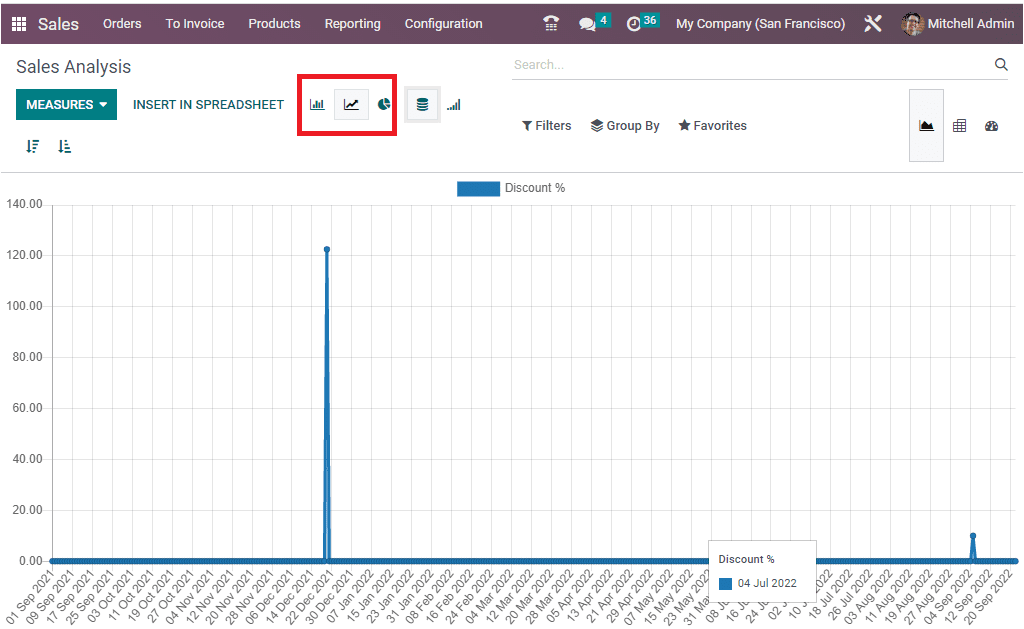
In addition, the Stacked view and the cumulative view are also available by clicking on the corresponding icons.
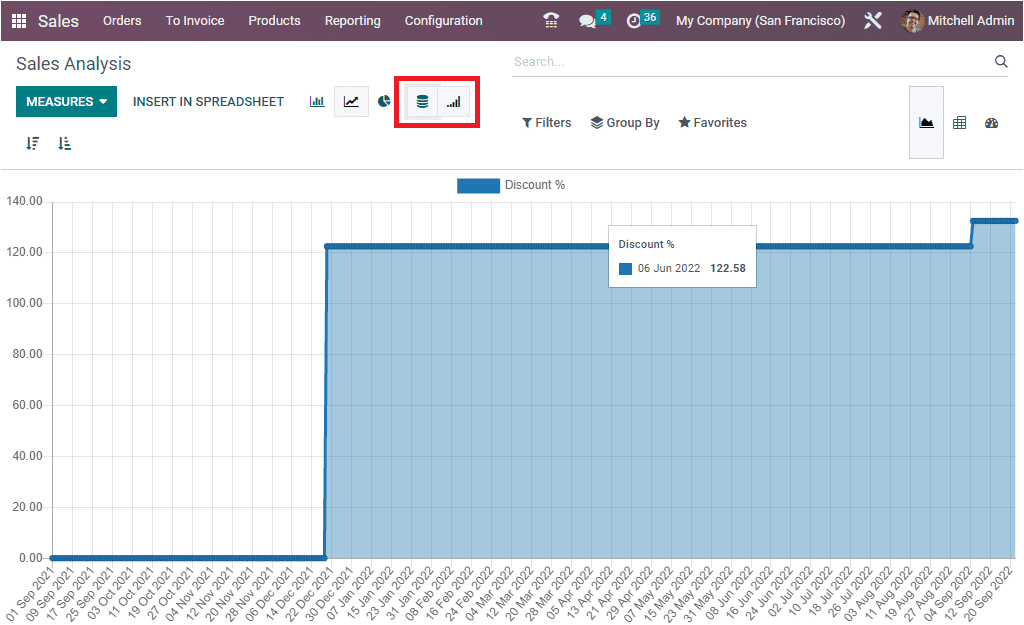
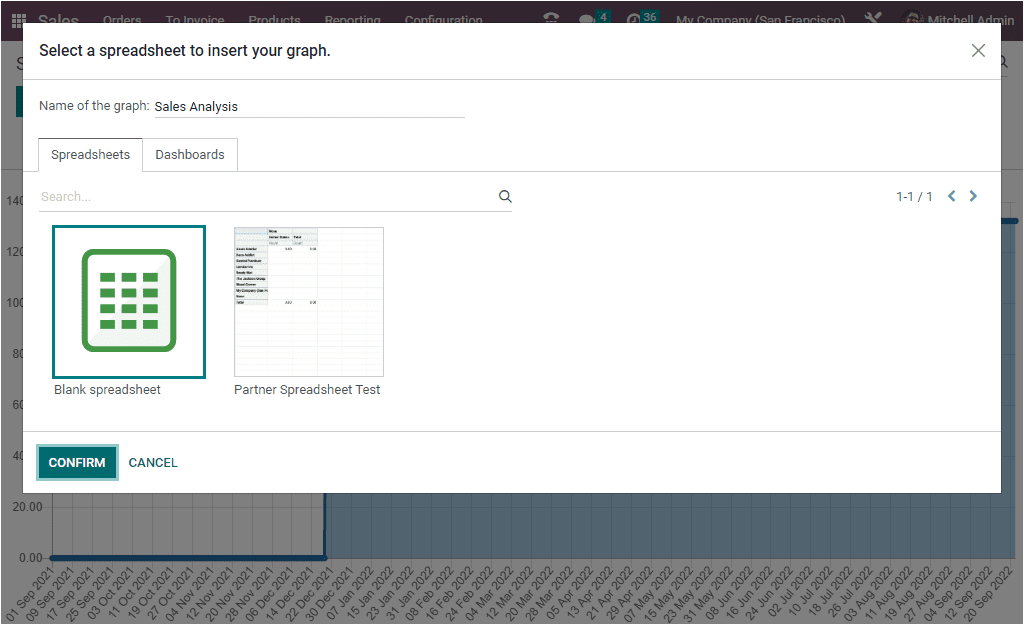
The INSERT IN SPREADSHEET button allows you to insert your graph into a spreadsheet. The moment you click the button, the system will furnish a new pop-up window for selecting a spreadsheet to insert your graph.
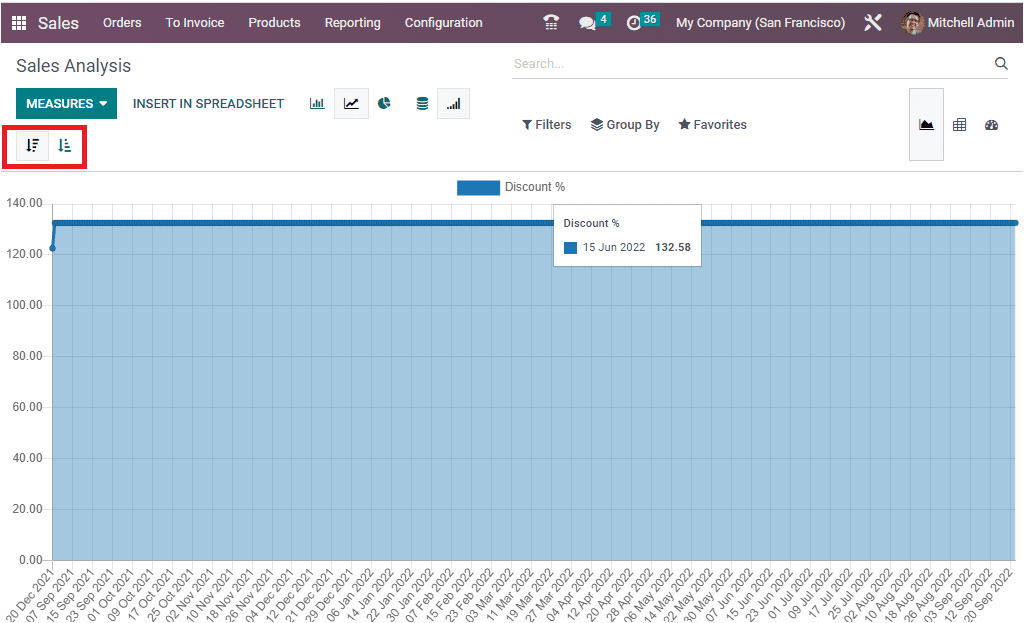
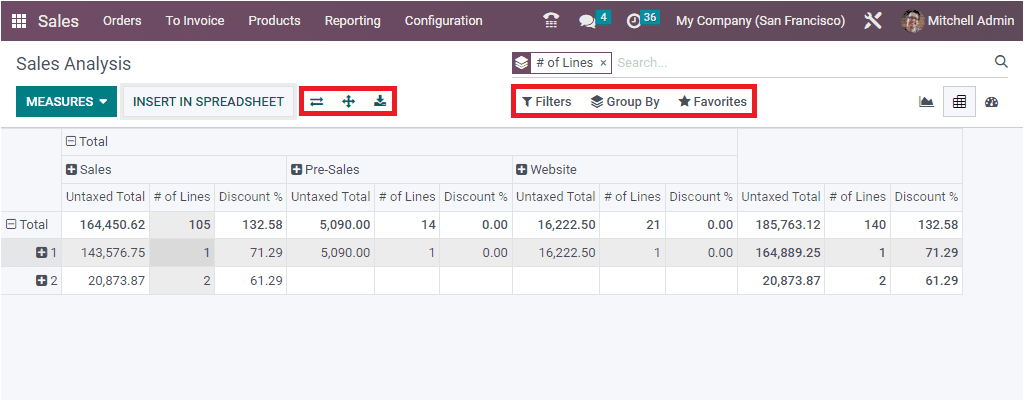
In addition, you can arrange the reports in the window in both ascending and descending modes by clicking on the Descending and Ascending buttons, as highlighted in the image below.
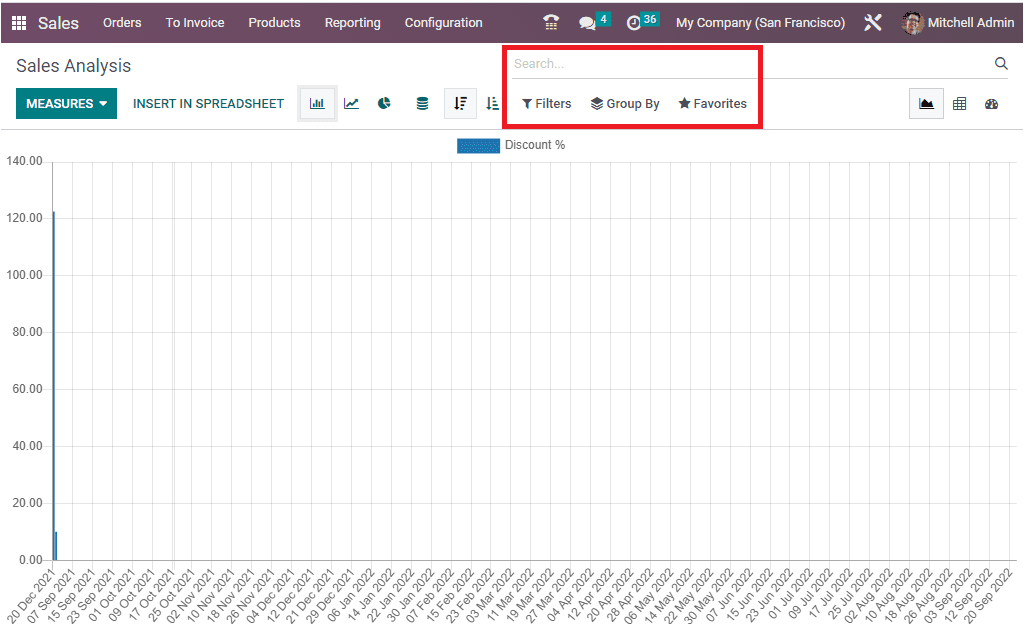
Apart from all these options, the sorting functionalities available in the Odoo platform are also available here in the window. The window's middle top right portion is specifically designed to display these options. Here you can see the Filters, Group By, Favourite, and Search options as highlighted in the image below.
The Filters menu includes various default and customizable options. The default options included in the filters tab are Quotations, Sale Orders, and the Order Date option. With the help of the Order Date menu, you can filter the sales analysis month-wise, quarter base, and yearly basis.
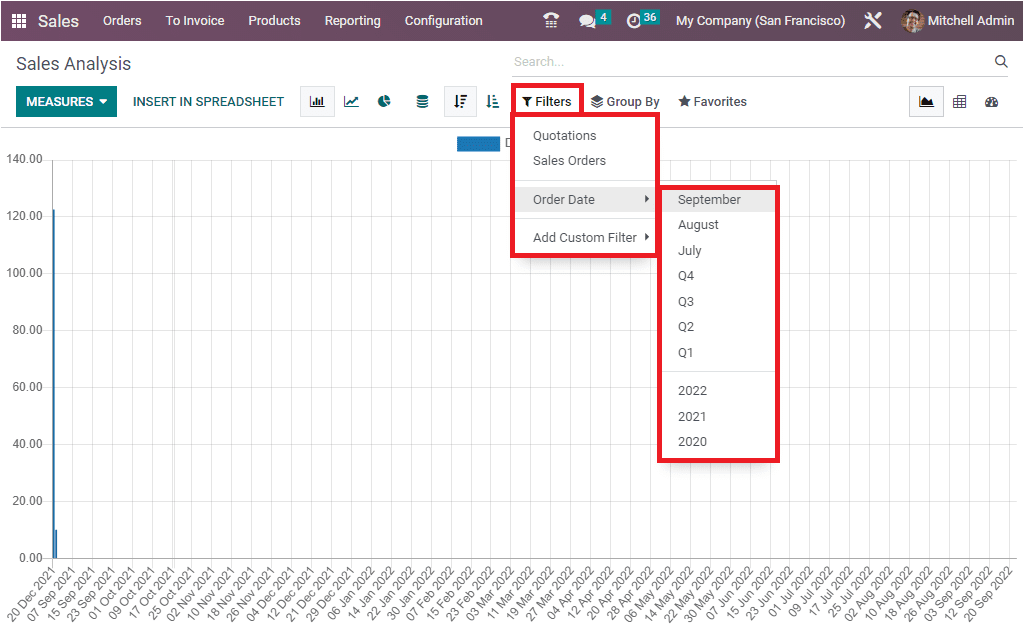
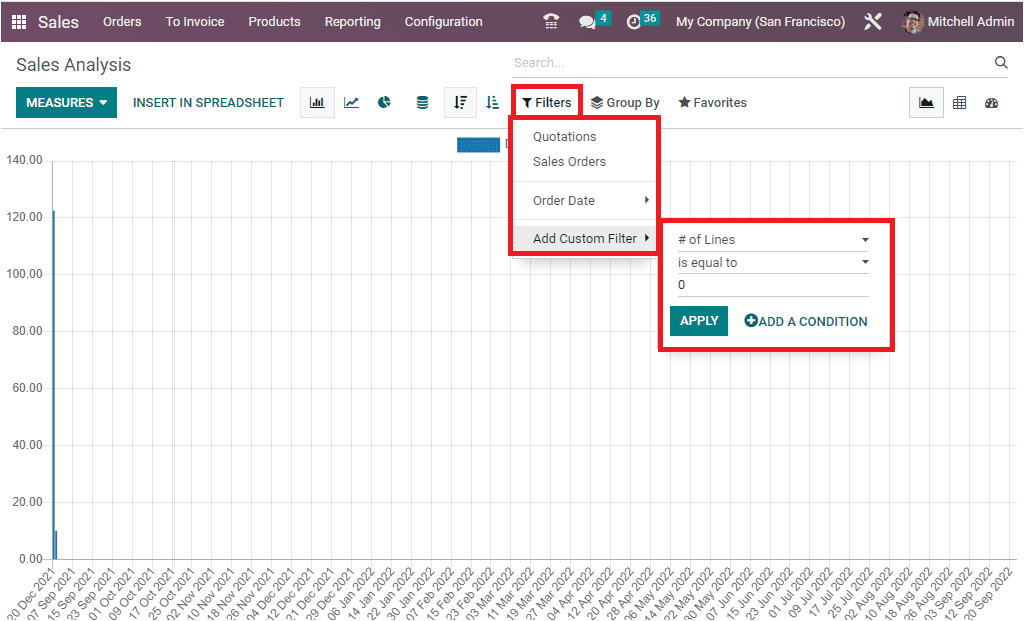
The Add Custom Filter option at the bottom of the filter menu allows you to customize various filters.
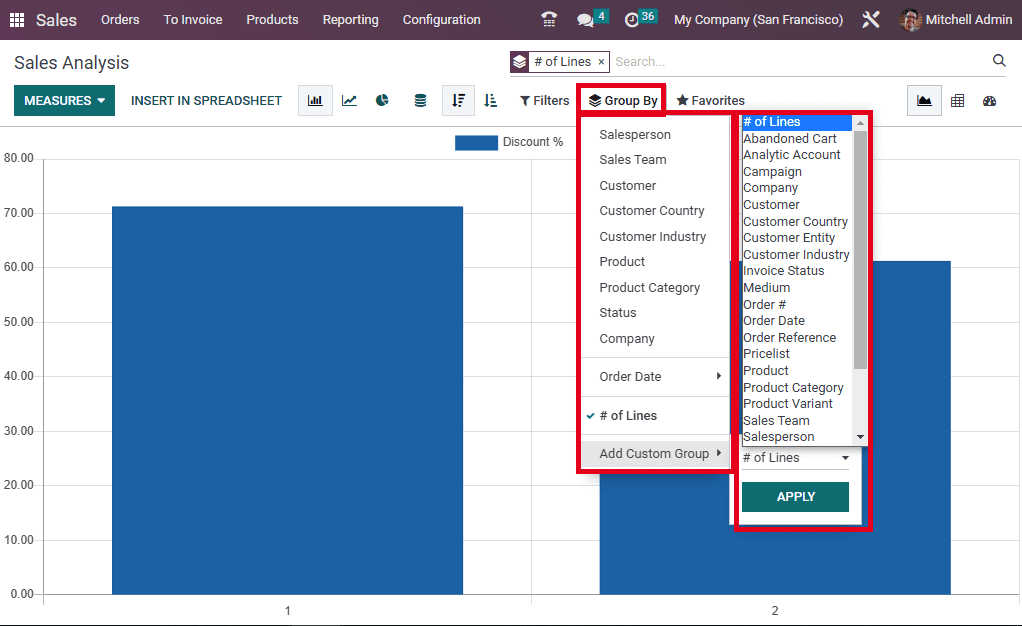
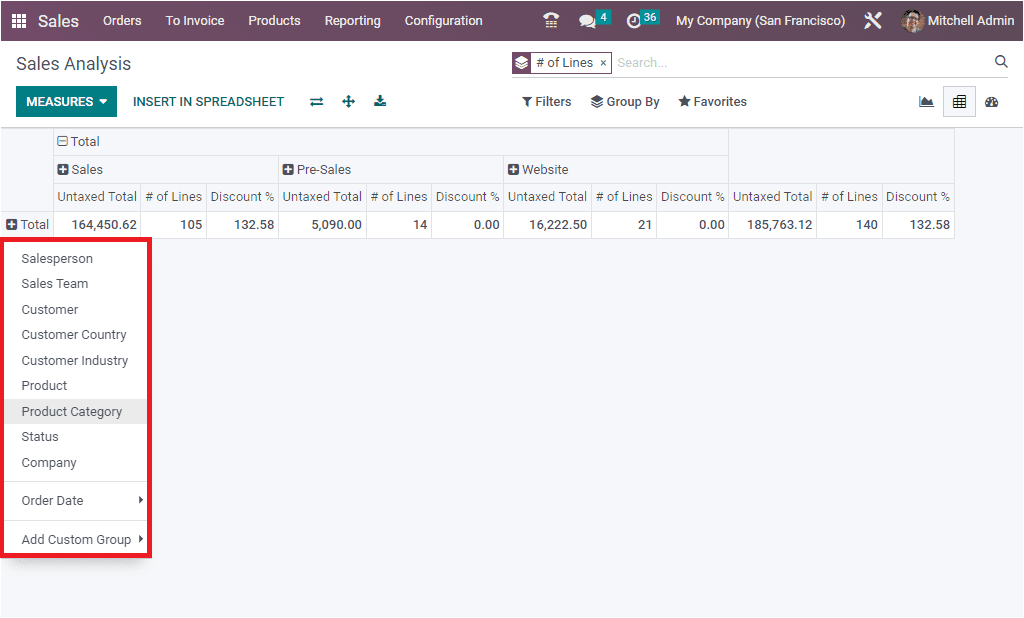
The next menu Group By option is very useful for grouping your sales analysis reports based on various criteria. The default grouping options included in the system are Salesperson, Sales Team, Customer, Customer Country, Customer Industry, Products, Product Category, Status, Company, and Order Date (Year, Quarter, Month, Week, or Day). The Add Custom Groups option allows you to add more groups.
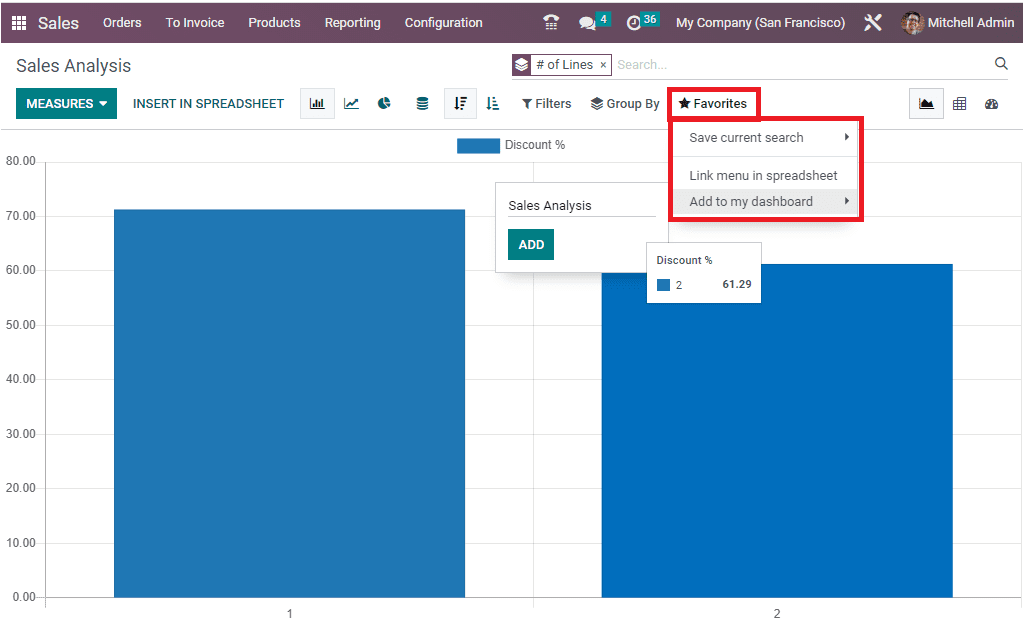
Similarly, the Favourites tab also displays various menus such as Save current search, Link menu in a spreadsheet, and Add to my dashboard menus as shown in the image below.
Now let us discuss the Pivot view of the Sales Analysis window.
Pivot View
It is very easy to access the Pivot view of the window. As soon as you click on the Pivot view menu icon, you will depict the sales analysis report in a tabular manner.
The Pivot view window also displays the MEASURES tab.
All the options in the Graph view MEASURES tab that we described earlier are also seen in the Pivot view. In addition, you can see the options such as Flip axis, Expand all, and Download XLSX available here in the Pivot view.
The sorting functionalities such as Filters, Group By, Favourites, and Search options are also ready for operation.
Furthermore, the pivot view allows you to analyze the total amount based on various aspects such as Sales person, Sales Team, Customer, Customer Country, Customer Industry, Product, Product Category, Status, Company, Order Date( Year, Quarter, Month, Week, and Day).
Now let us discuss the Dashboard view.
Dashboard View
The Dashboard view menu icon is designed to navigate into the Dashboard view of the Sales analysis window. The screenshot of the Dashboard window is given below.
The Dashboard view window will depict the reports in all types of report forms. The graph view representation, pivot view, and quantitative measures are available in the window.
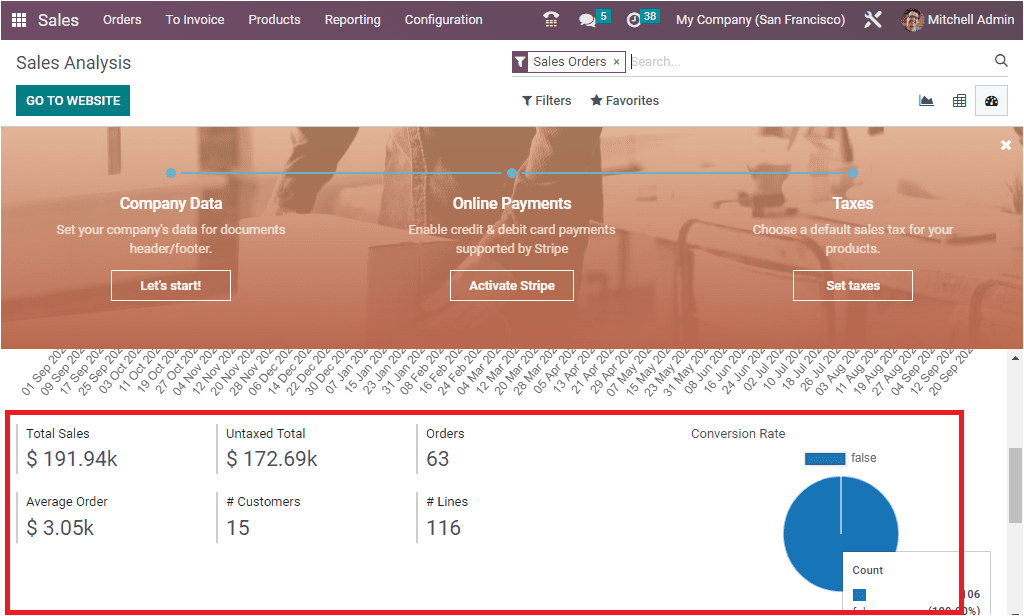
The window will depict the Total Sales, Untaxed Total, Orders, Average Order, Number of Customers, and Number of Lines in a transparent manner. In addition, the Conversion Rate is depicted in a Pie chart form.
This is all about the reporting features of the Odoo 16 Sales module.