In Odoo 18, a bar chart (or bar graph) visually represents categorical data using rectangular bars whose heights or lengths are proportional to the values they display.
Let's build a bar chart using the Studio module.
Go to the Studio module in Odoo 18 and choose the model you want to use for creating the bar chart.

Click on the Views tab and choose "Graph View" from the list of available options.
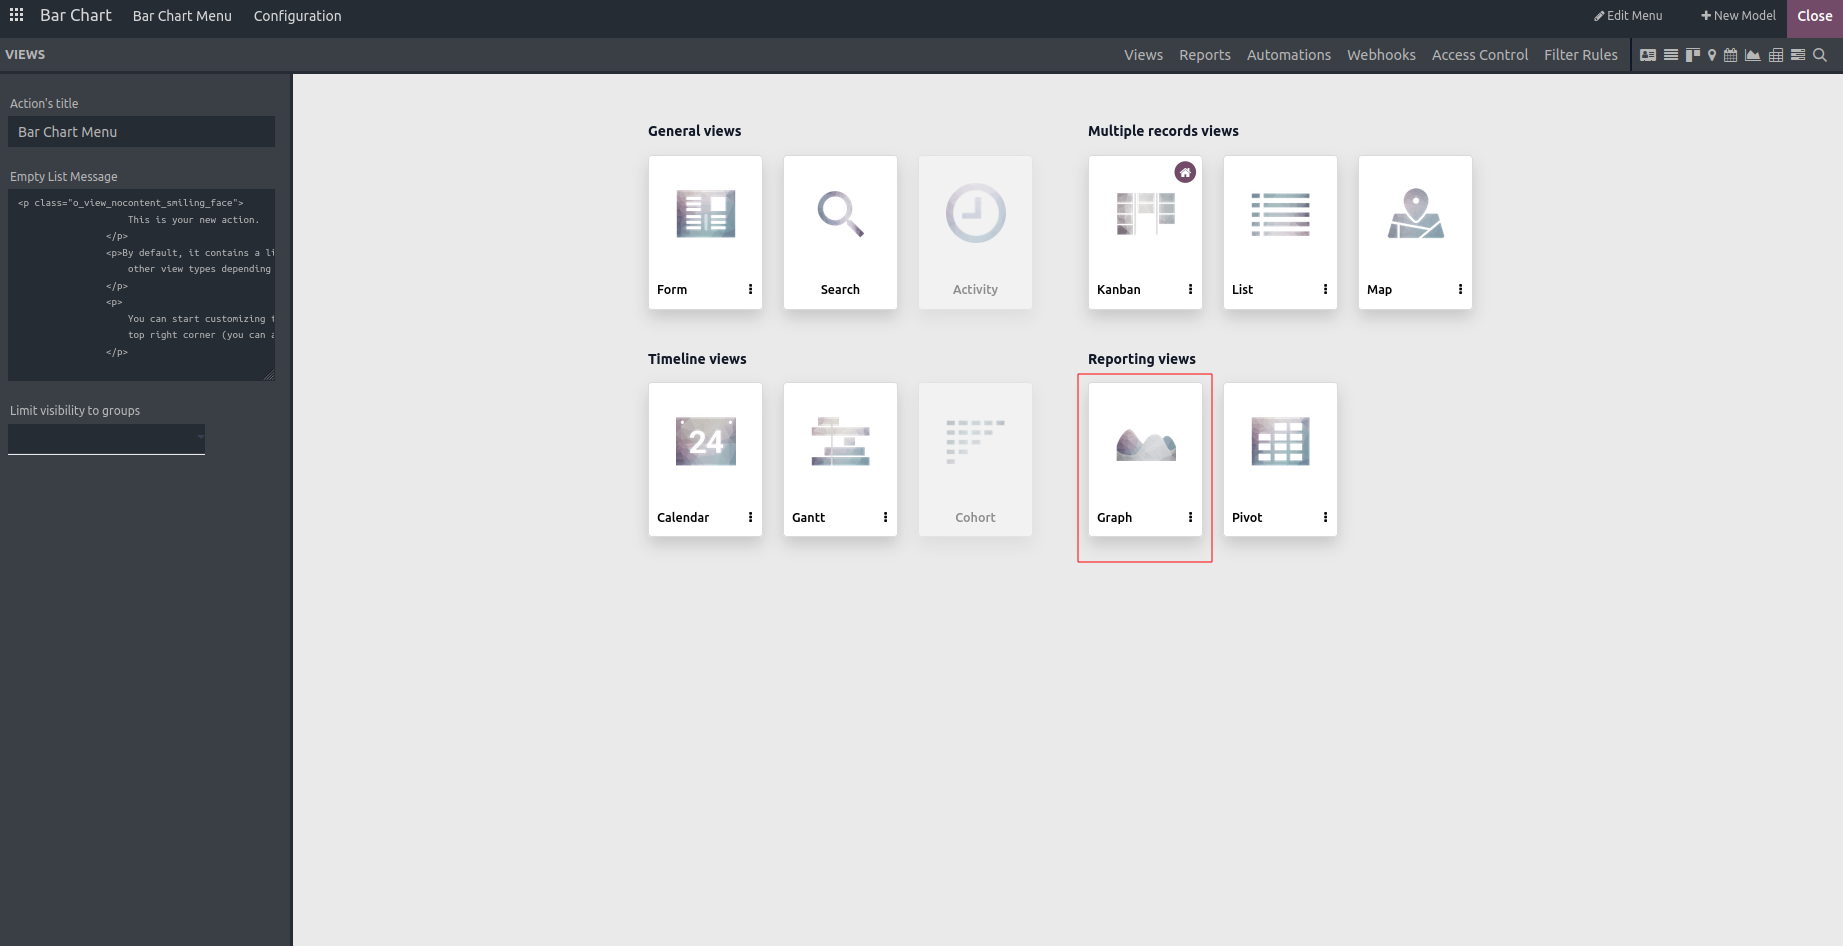
Select "Bar" as the type of chart.
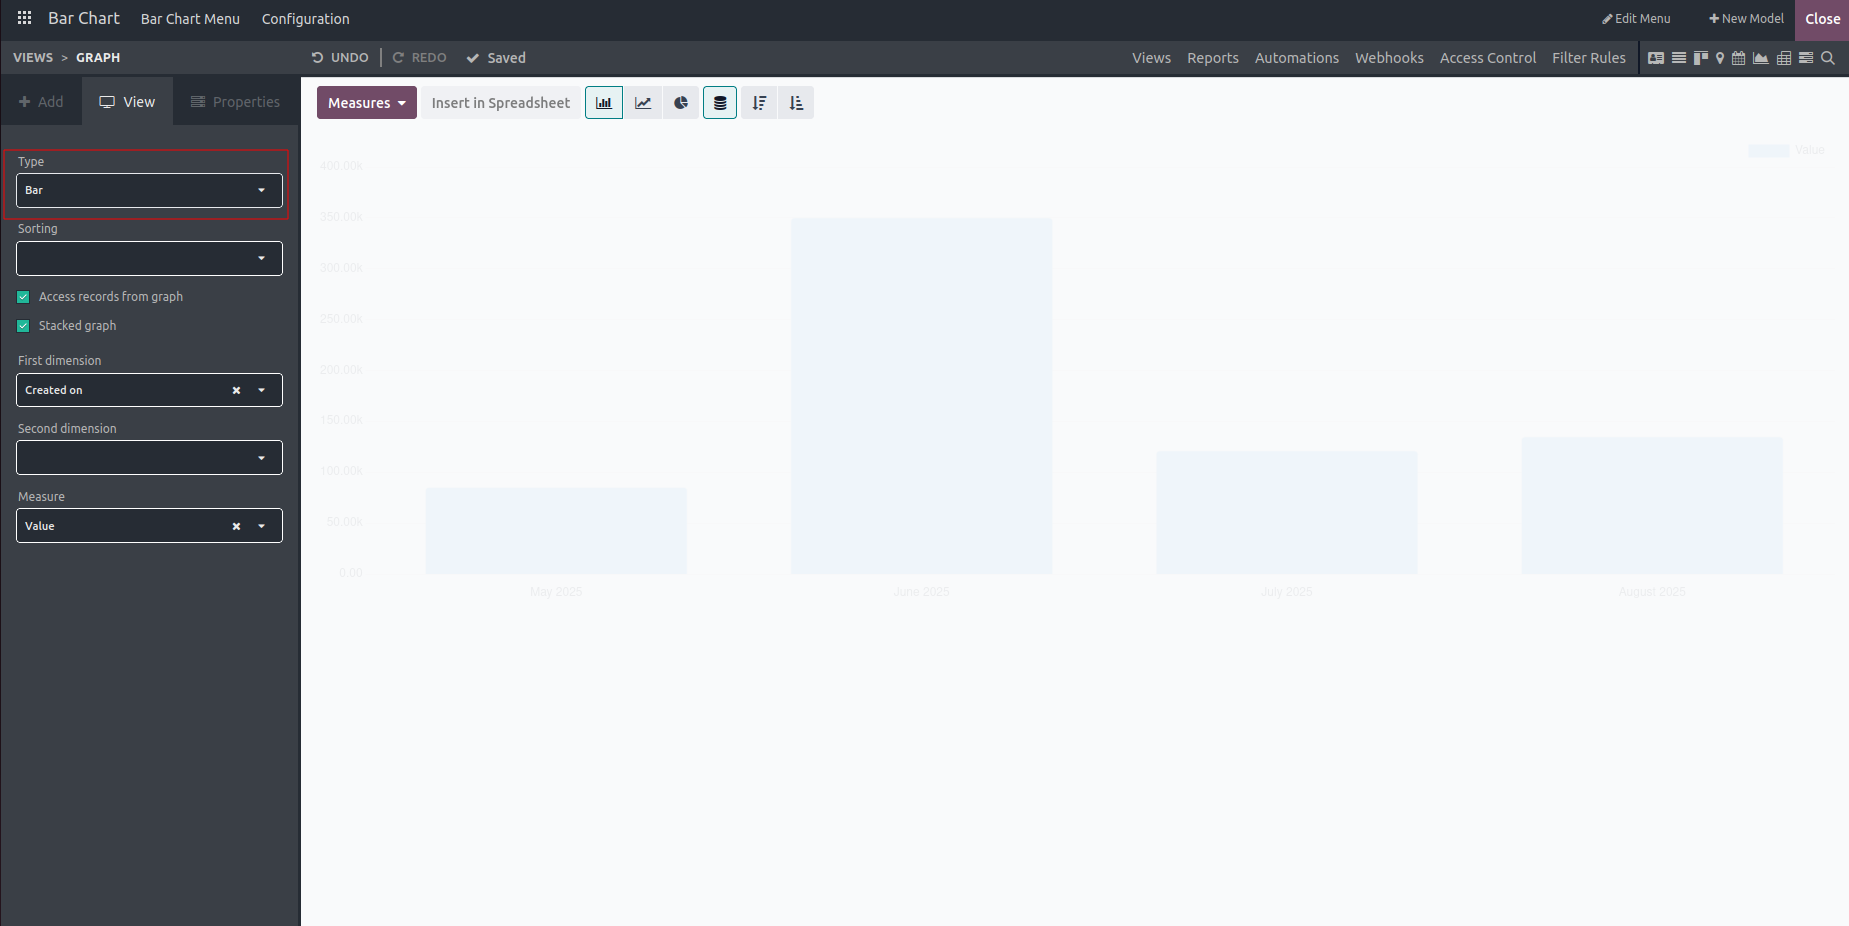
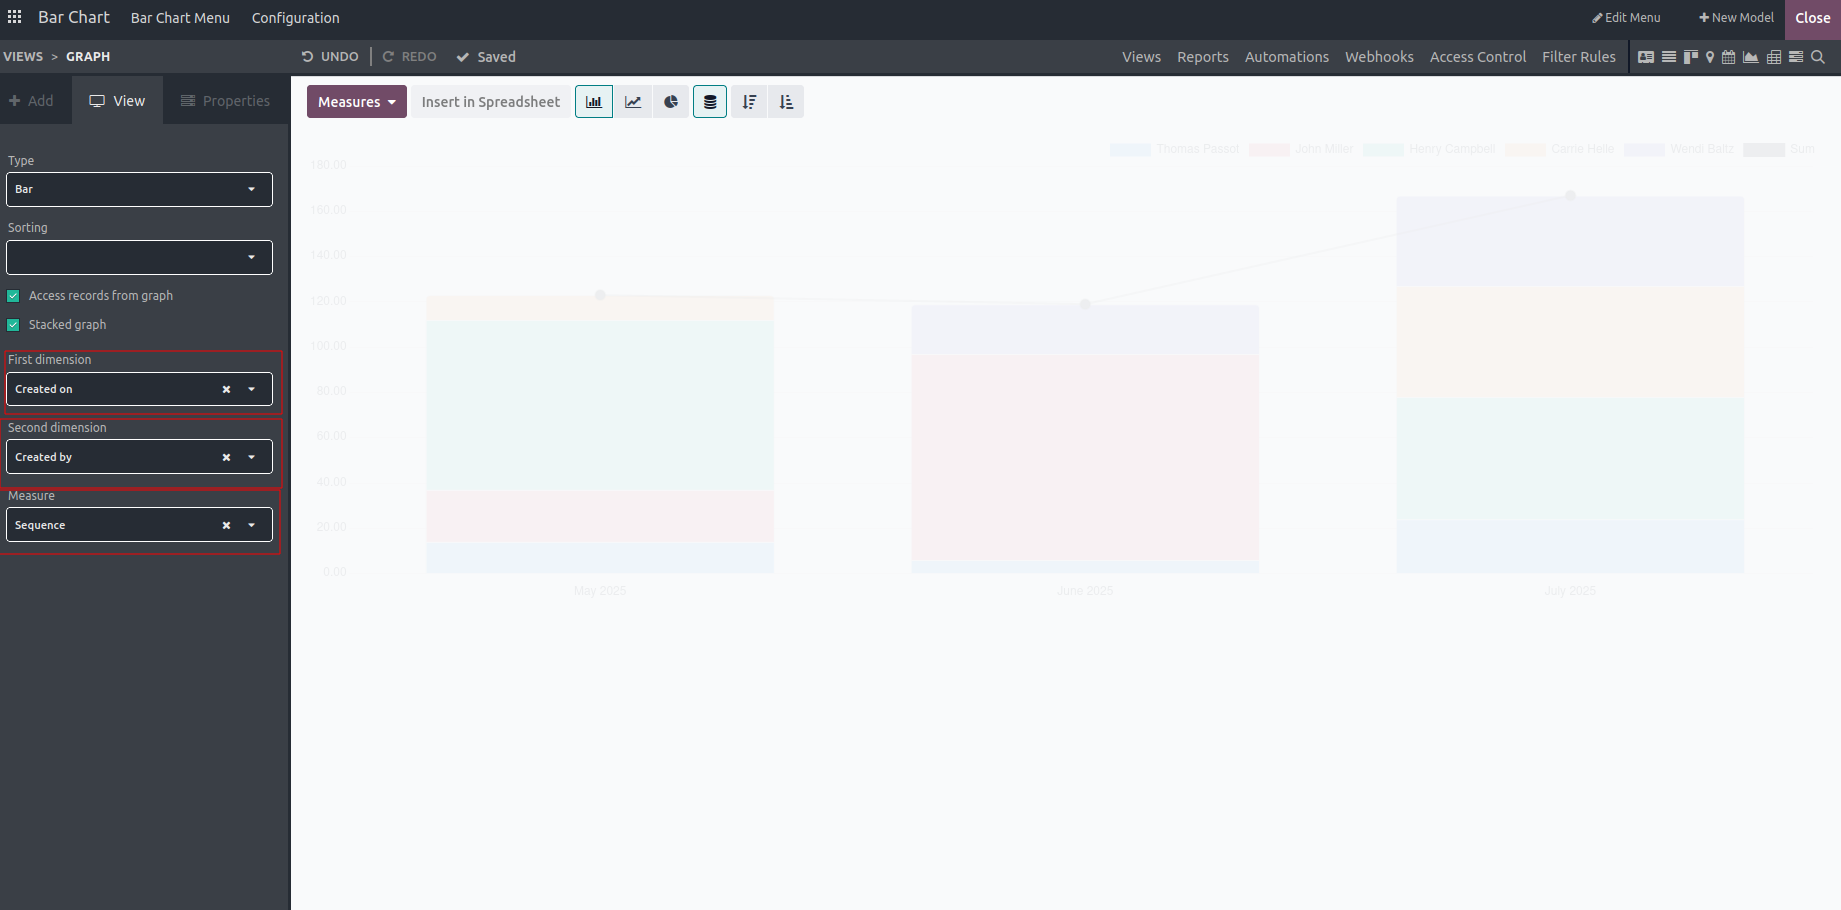
Select the first dimension, second dimension, and the measure field, these may vary depending on the model you’re working with.
- The first dimension defines the X-axis of the chart and is used to group data by a particular category or property.
- The second dimension typically aligns with the Y-axis and is used to represent the values or quantities being analyzed.
- The measure represents the actual value displayed on the Y-axis of the chart.
Allow Access to Records from the Graph
Users can define custom access rules to control which records are visible in the graph view.
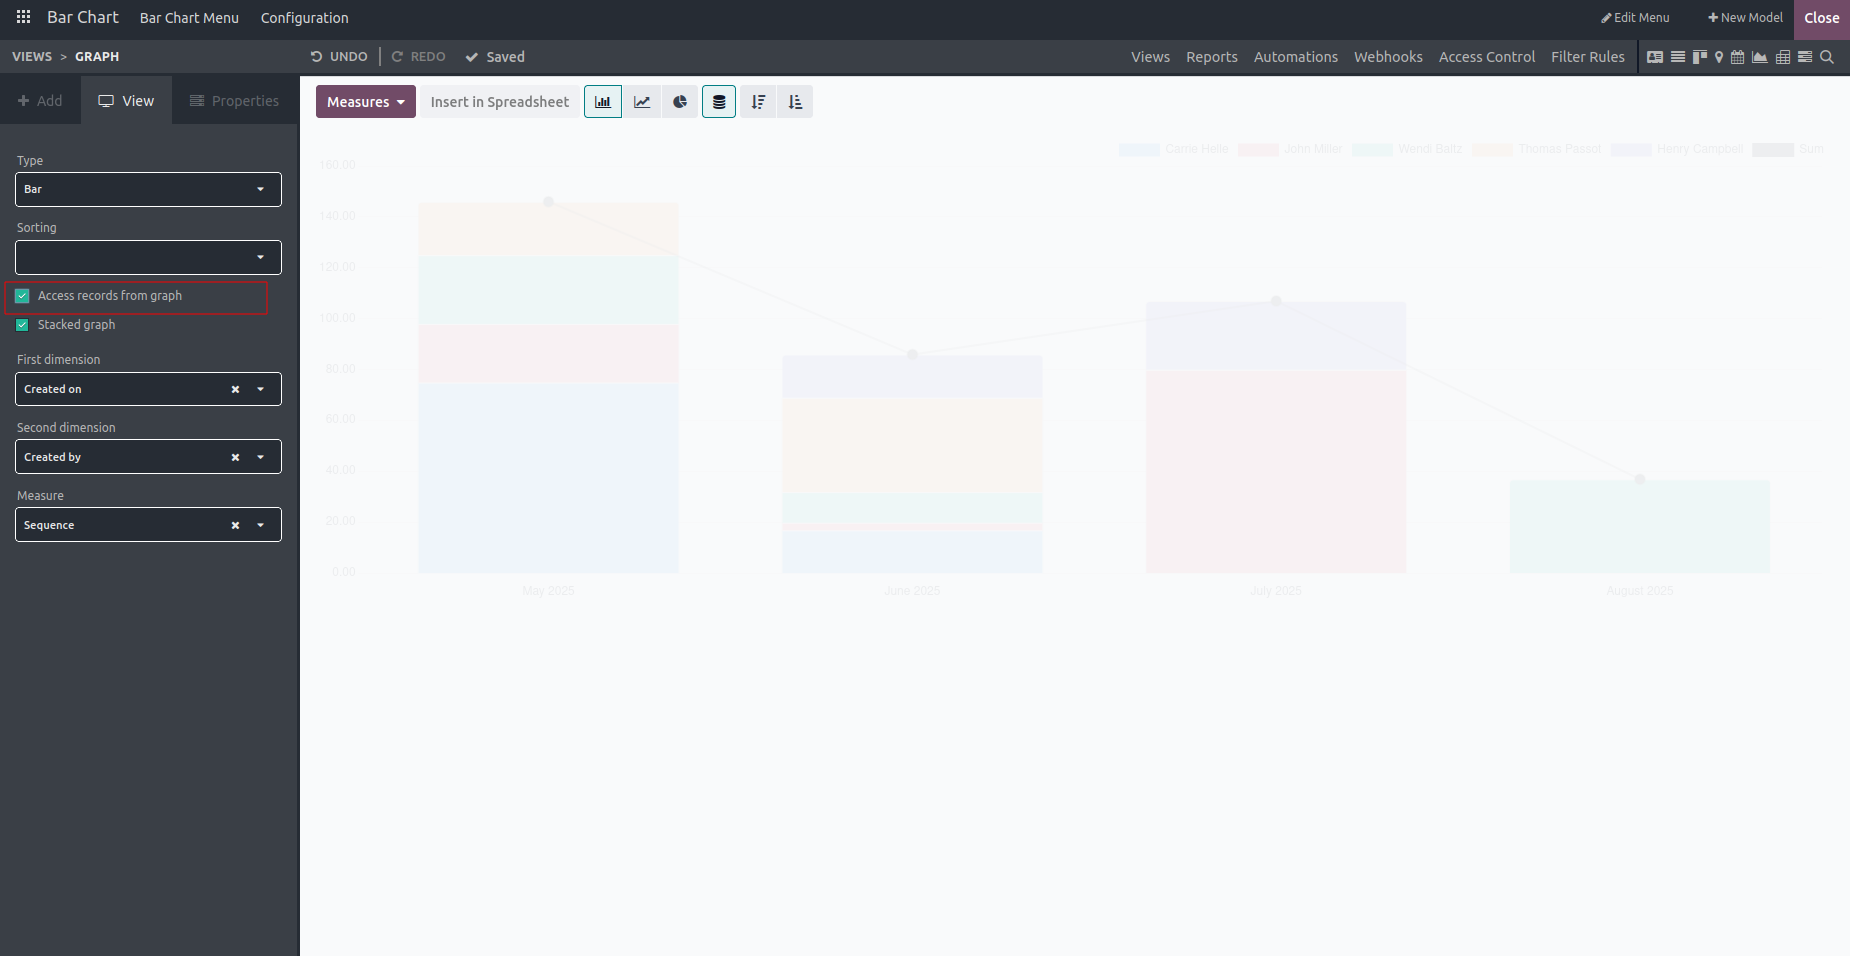
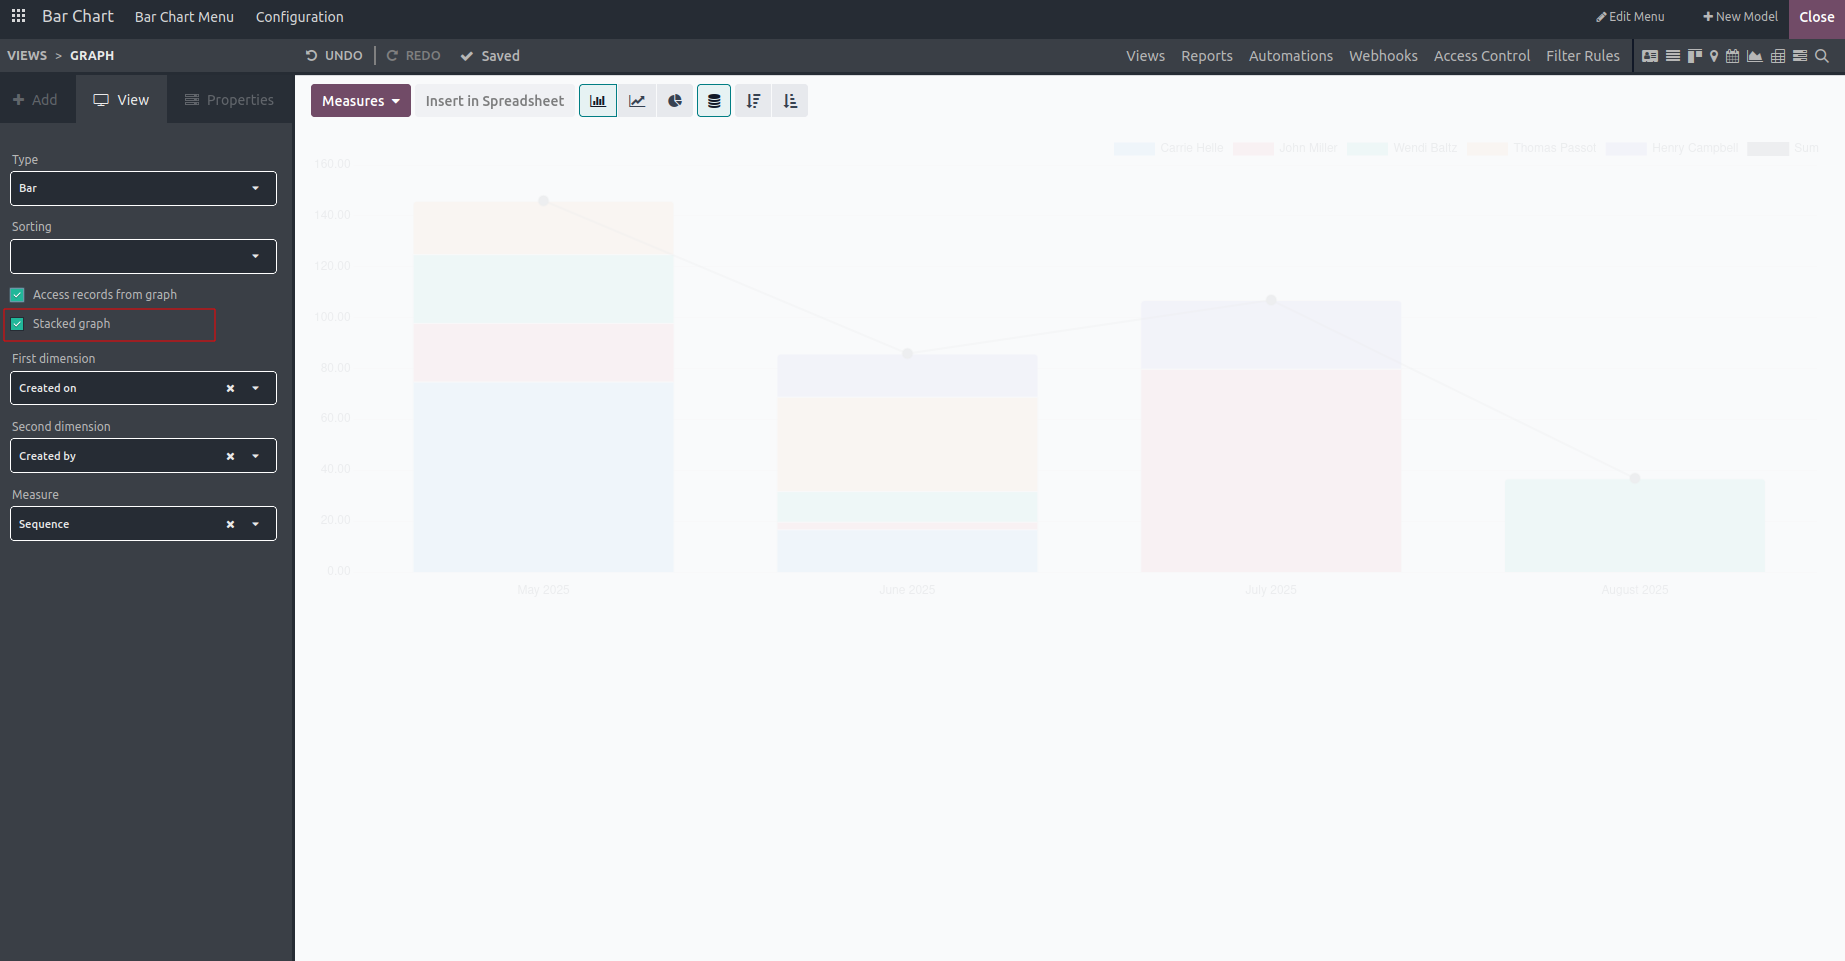
Enable Stacked Graph
This allows us to create a bar chart with stacked bars instead of displaying them side by side.
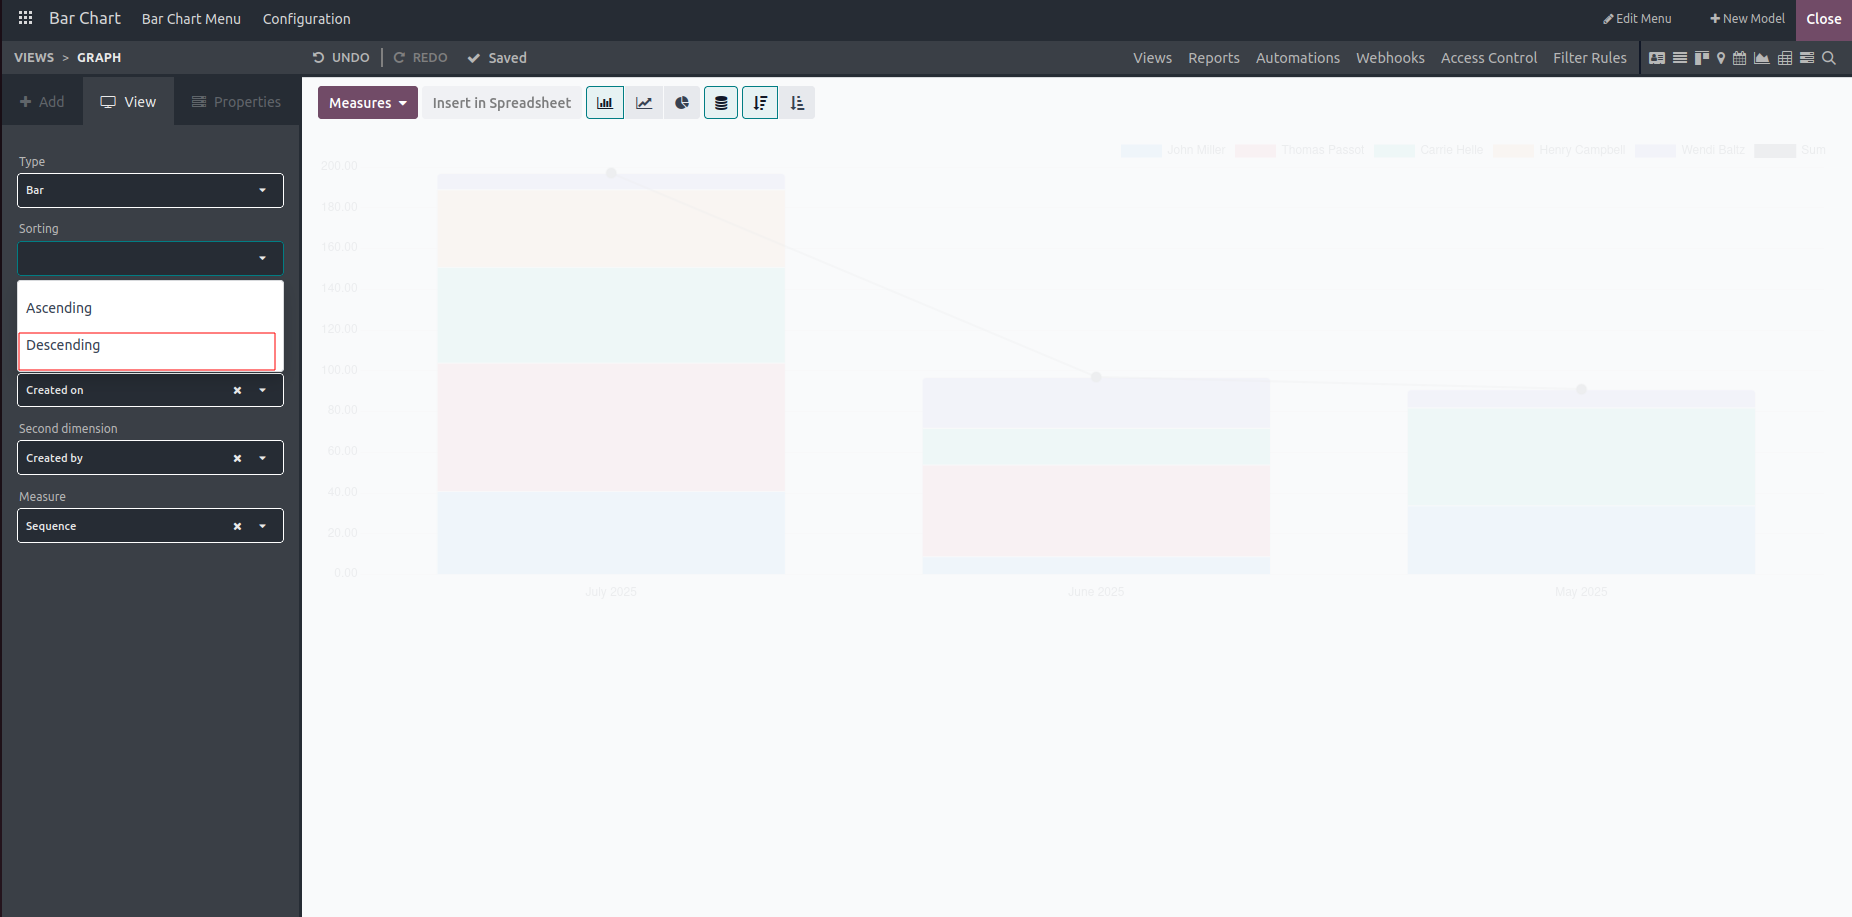
The Bar Chart can be sorted in ascending or descending order.

This is the view in descending order.
In conclusion, the bar chart feature in Odoo's Studio module enables users to present categorical or discrete data in a clear and accessible way, making it easier to identify patterns, trends, and comparisons. Whether analyzing sales performance, monitoring inventory levels, or tracking project progress, the bar chart offers a flexible and powerful tool for visualizing data and generating valuable insights.