Graphs in Odoo give you a powerful way to make sense of your business data. Whether you want to track sales, analyze expenses, or monitor performance trends, visual reporting helps you see the bigger picture, fast.
With Odoo Studio, creating and customizing graph views is easy and doesn’t require any technical background. You can build bar charts, pie charts, or line graphs to match the insights you want to highlight.
Accessing Graph View in Studio
To create a new graph view for a model:
- Open the Studio module.
- Navigate to the Views section.
- Under Reporting Views, click on Graph to activate it.
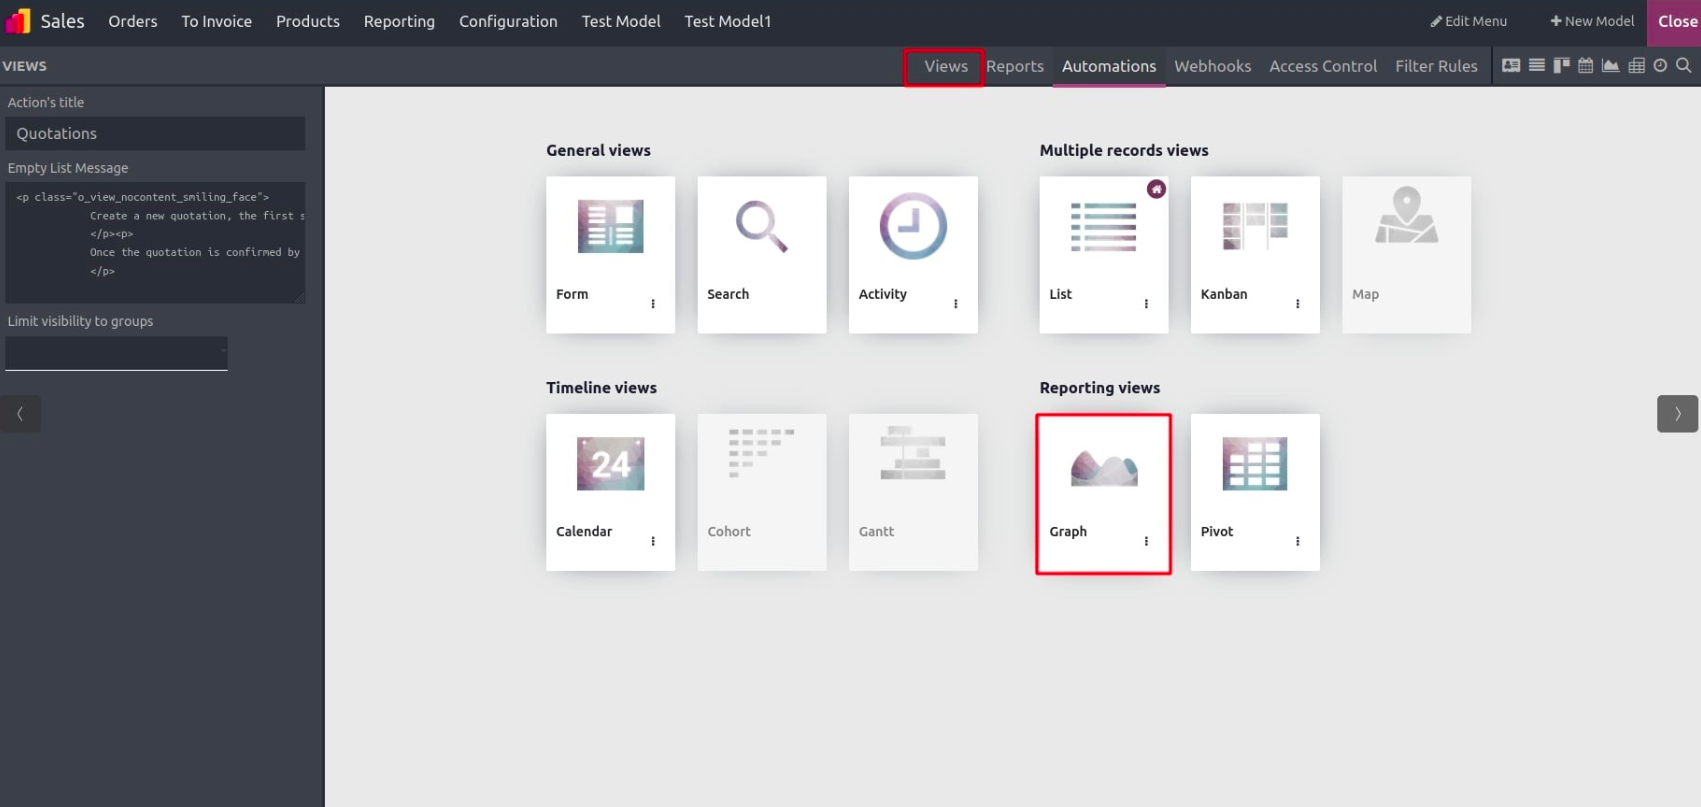
Once activated, a new interface appears, allowing you to fine-tune how your data will be displayed in the graph.
Accessing Graph View in Studio
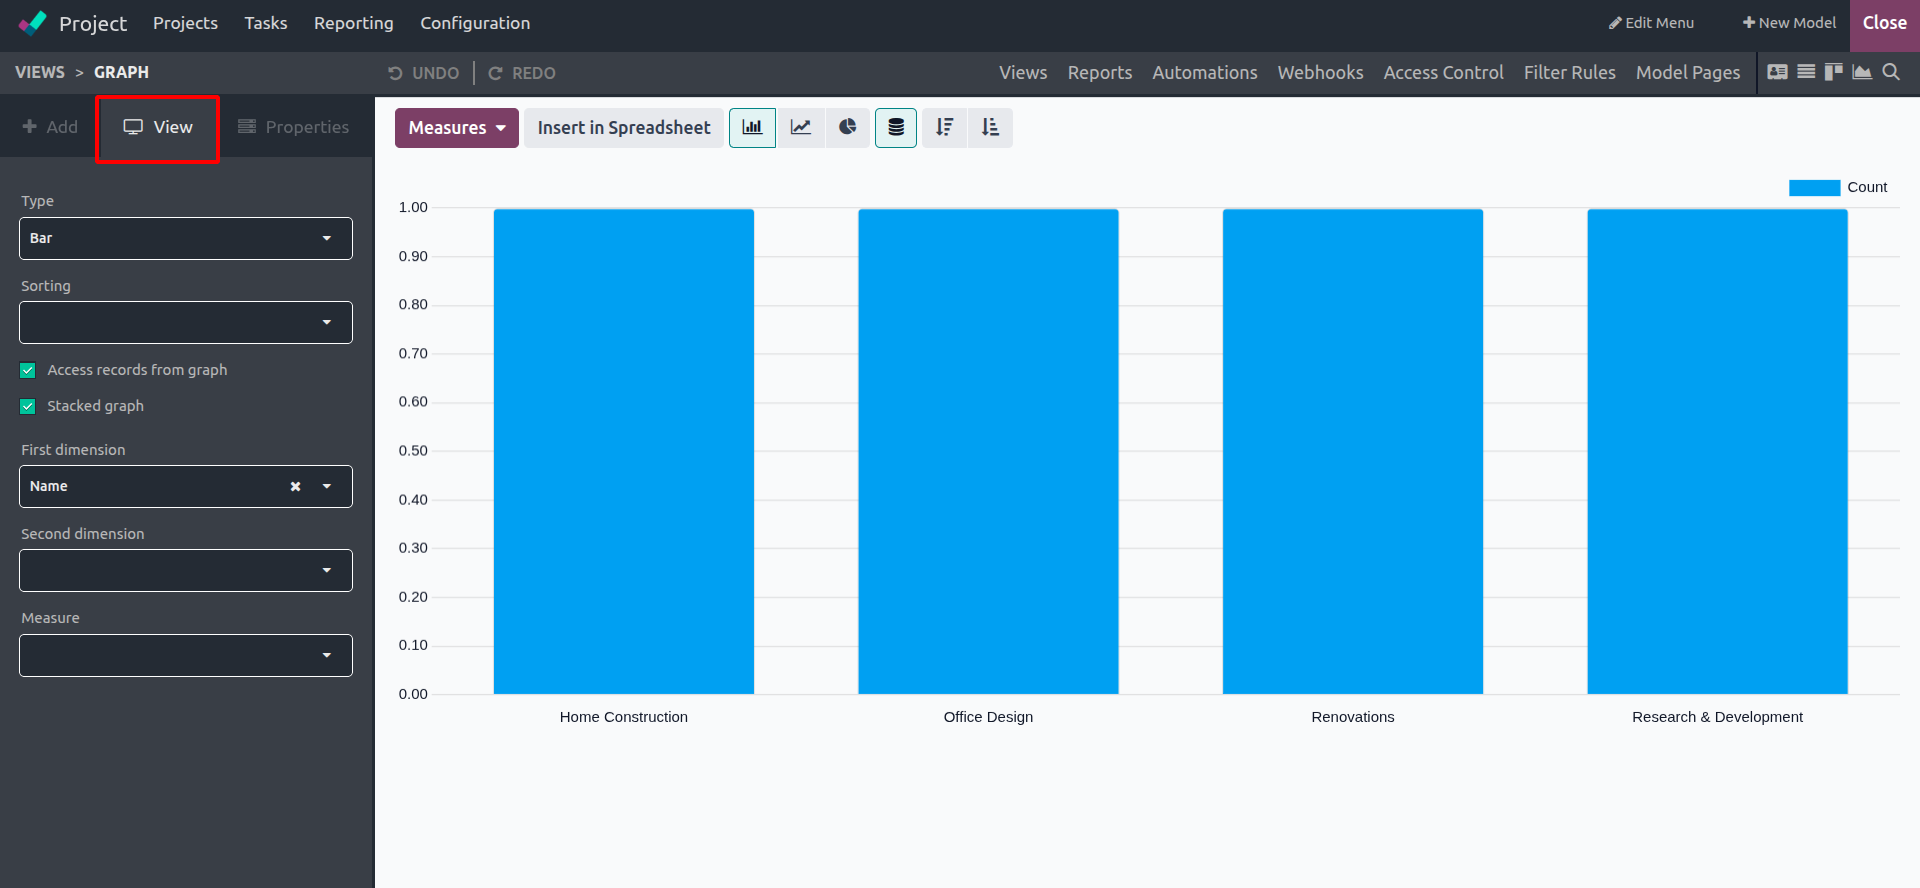
Inside the “View” tab of the Graph configuration panel, you’ll find several options that let you define the structure and behavior of your chart.
Here’s a breakdown of what each option does:
- Type: Choose the chart type, Pie, Bar, or Line. You can switch between these anytime depending on how you want to present your data.
- Sorting: For Bar and Line charts, choose how to sort the data: Ascending or Descending based on values.
- First Dimension: Select the main category to group your data by (e.g., by salesperson, region, or product).
- Second Dimension: (Optional) Add another grouping to compare across a second category.
- Measure: Define what kind of data should be calculated or displayed, like totals, counts, or averages.
- Access Records from Graph: Available for Bar and Pie charts, this lets users click a segment of the chart to view all records related to that category.
- Stacked Graph: Available only for Bar charts. If you use two groupings (dimensions), this stacks the bars for easier comparison instead of displaying them side by side.
Switching Chart Types
Changing the chart type is as simple as selecting your preference from the “Type” dropdown. Whether you want a clean bar chart or a circular pie chart, Odoo lets you preview the change instantly. The system remembers this as the default display for that view unless you change it again later.
Drill Down into Data
The Access Records from Graph option is a powerful feature available in Bar and Pie charts. When enabled, clicking on any portion of the chart (like a slice of the pie or a bar segment) opens up the related records. This makes it easier to dive deeper into the numbers behind your visuals, perfect for reviews and reports.
A Visual Edge in Decision-Making
With Odoo Studio’s Graph View, you’re not just creating dashboards—you’re unlocking the power to understand your data better. By turning raw numbers into visuals, your team can spot trends, act faster, and stay on top of business goals.
And the best part? It’s all code-free.