The Line Chart in Odoo is a simple yet powerful way to visualize how values change over time. By connecting data points with straight lines, it clearly shows patterns, trends, and fluctuations, whether you're monitoring monthly sales, tracking employee attendance, or measuring inventory turnover.
In a typical line chart:
- The horizontal axis (X-axis) represents a timeline or category,
- The vertical axis (Y-axis) displays the measured values.
Example of a Line Chart
Creating a Line Chart in Odoo Studio
To build your own line chart using Studio in Odoo 18:
- Open the Studio module.
- Navigate to the specific model (such as Sales Orders, Projects, or Invoices) you want to work with.
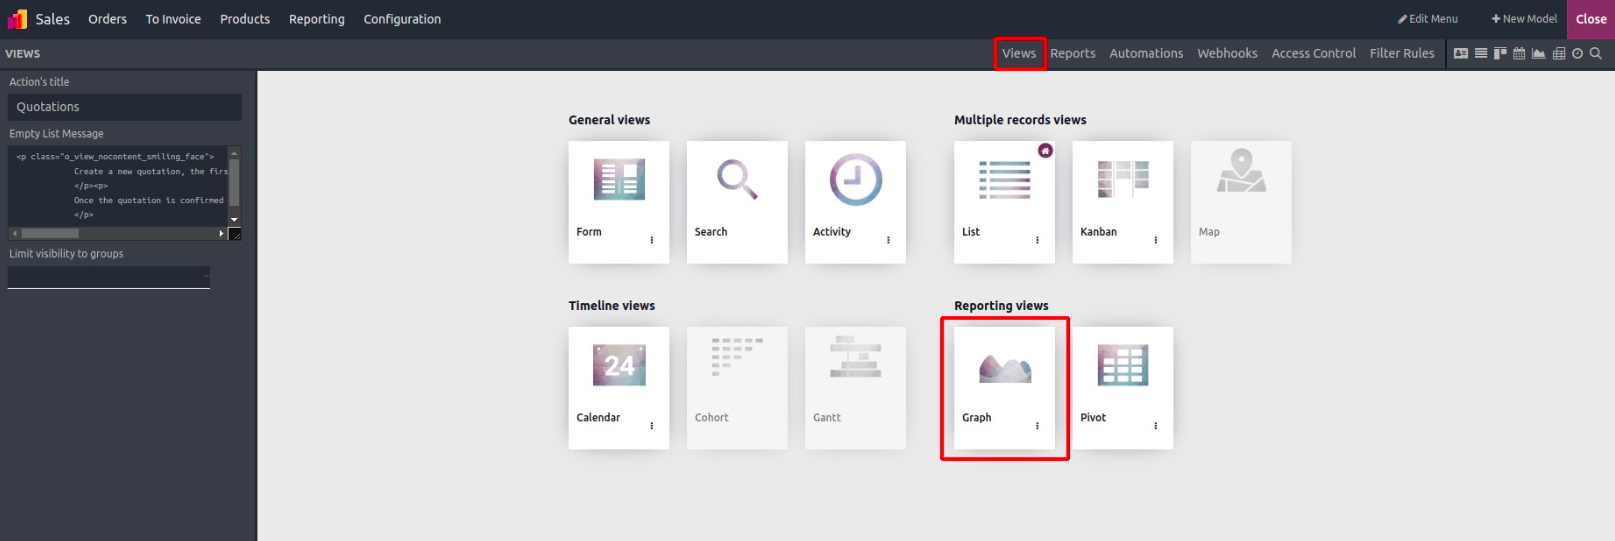
- From the ‘Views’ tab, click on “Graph View” to begin.
Choose Line as the Chart Type
Once you're inside the graph editor:
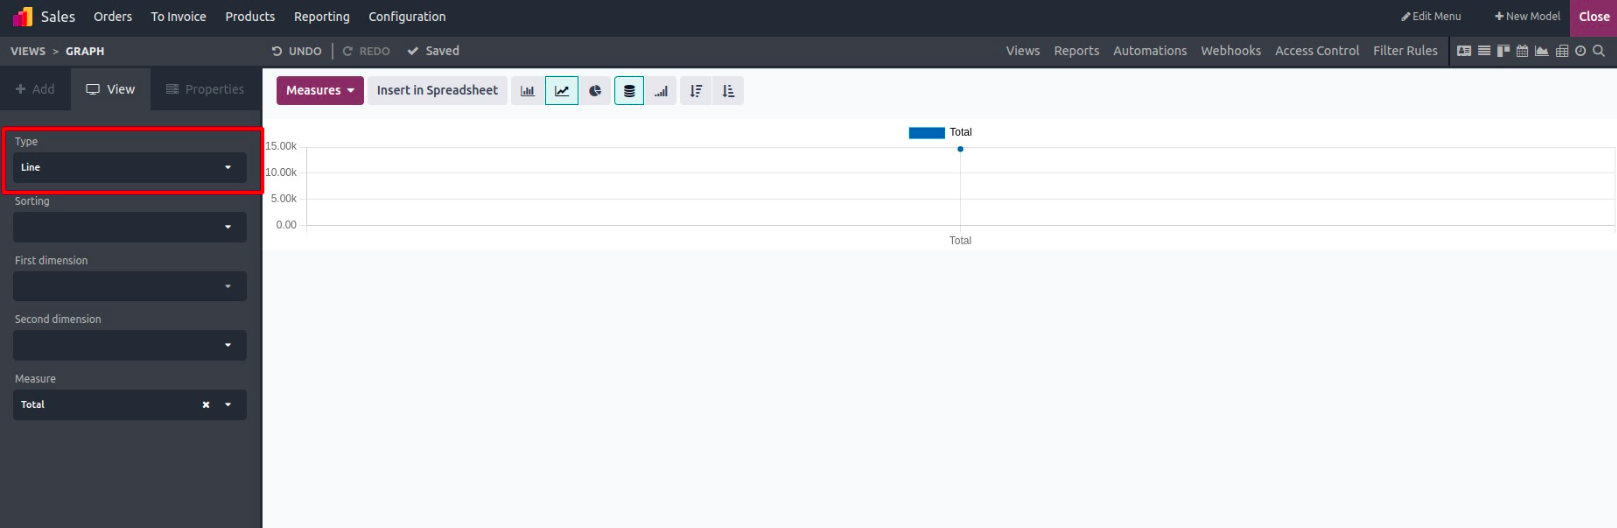
- Go to the View panel.
- Under Type, select “Line” from the available chart types (Pie, Bar, Line).
Set Up Your Chart Dimensions
To generate meaningful insights, configure the three core parts of your line chart:
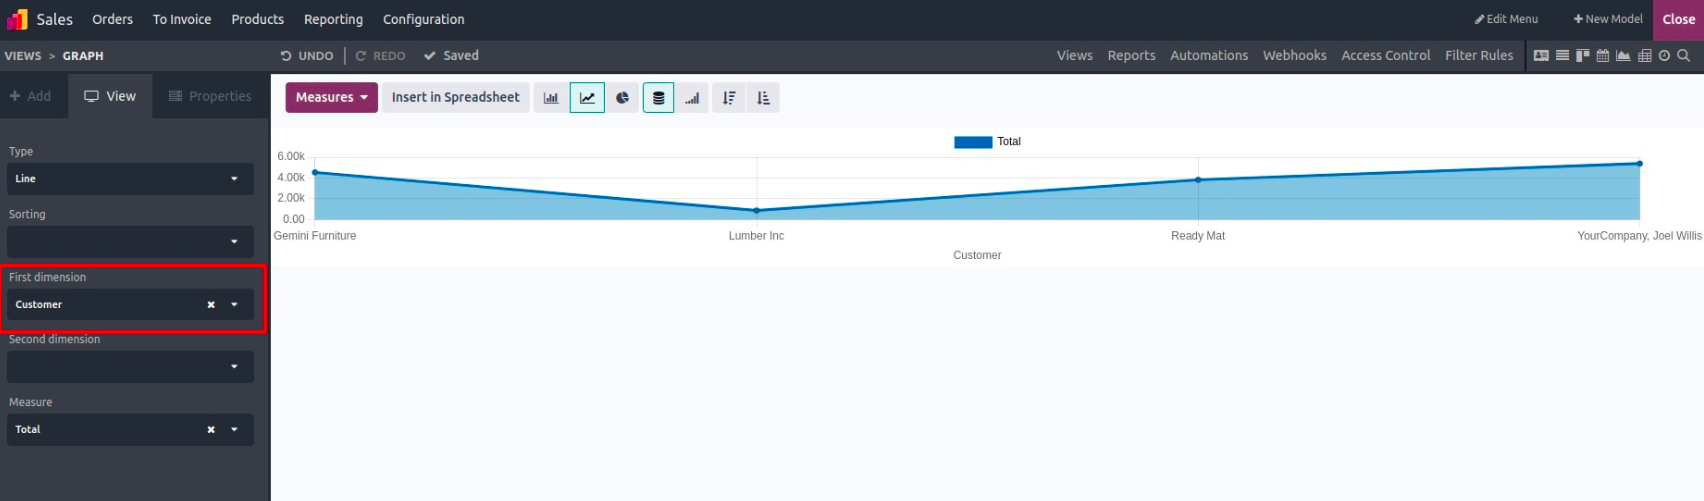
1. First Dimension – X-Axis (Category or Timeline)
This controls what appears on the horizontal axis. It could be:
- A date field (e.g., Order Date)
- A category (e.g., Salesperson, Department)
It organizes your data into logical groups.
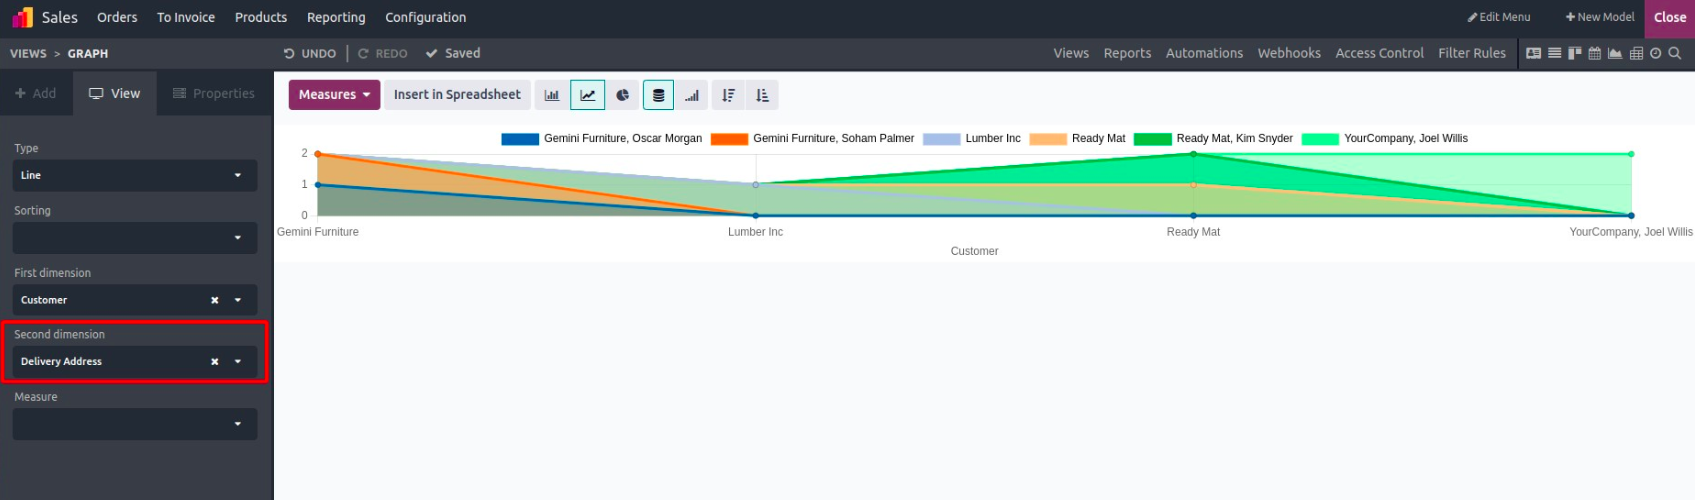
2. Second Dimension – Grouping (Optional)
This optional field allows further breakdown of data, perfect for comparisons within the same timeline.
Example: If First Dimension is Month, your Second Dimension could be Sales Region to show regional comparisons across time.
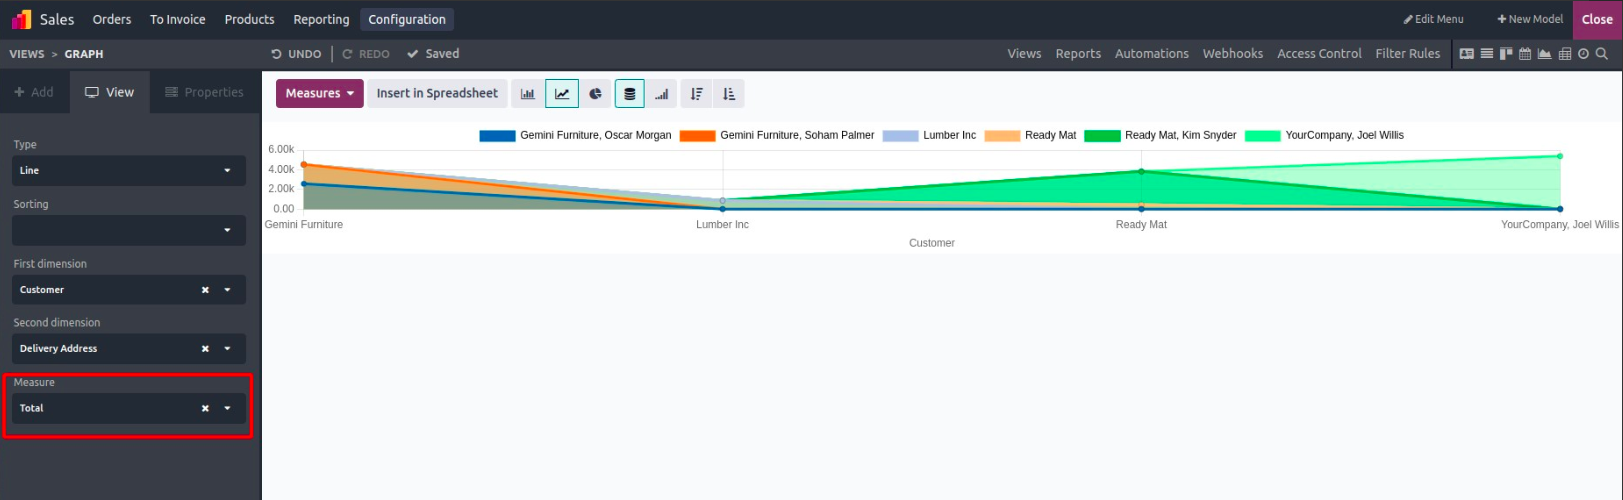
3. Measure – Y-Axis (Value to Track)
This defines what metric is displayed along the vertical axis, such as:
- Total revenue
- Number of records
- Quantity delivered
You can select a numerical field that represents the values you want to measure.
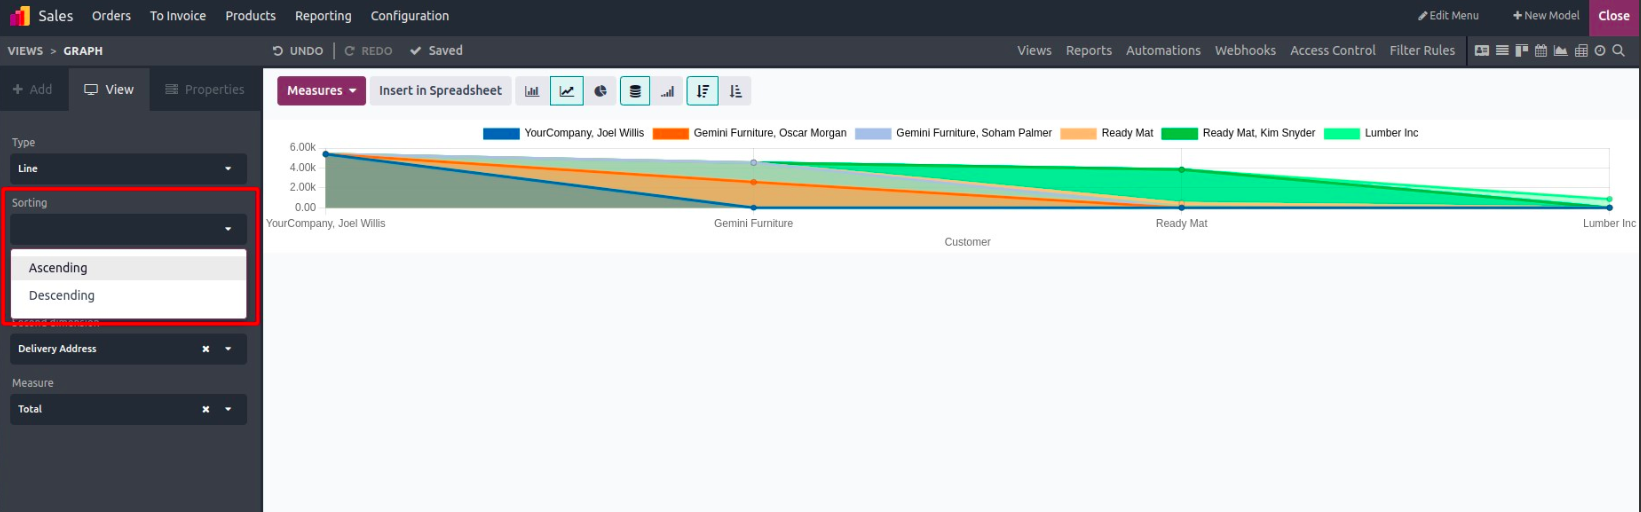
Sort Your Line Chart
In Odoo Studio, you can choose how your data is ordered:
- Ascending: From oldest to newest or lowest to highest
- Descending: From newest to oldest or highest to lowest,
Sorting options help make your trends easier to interpret.
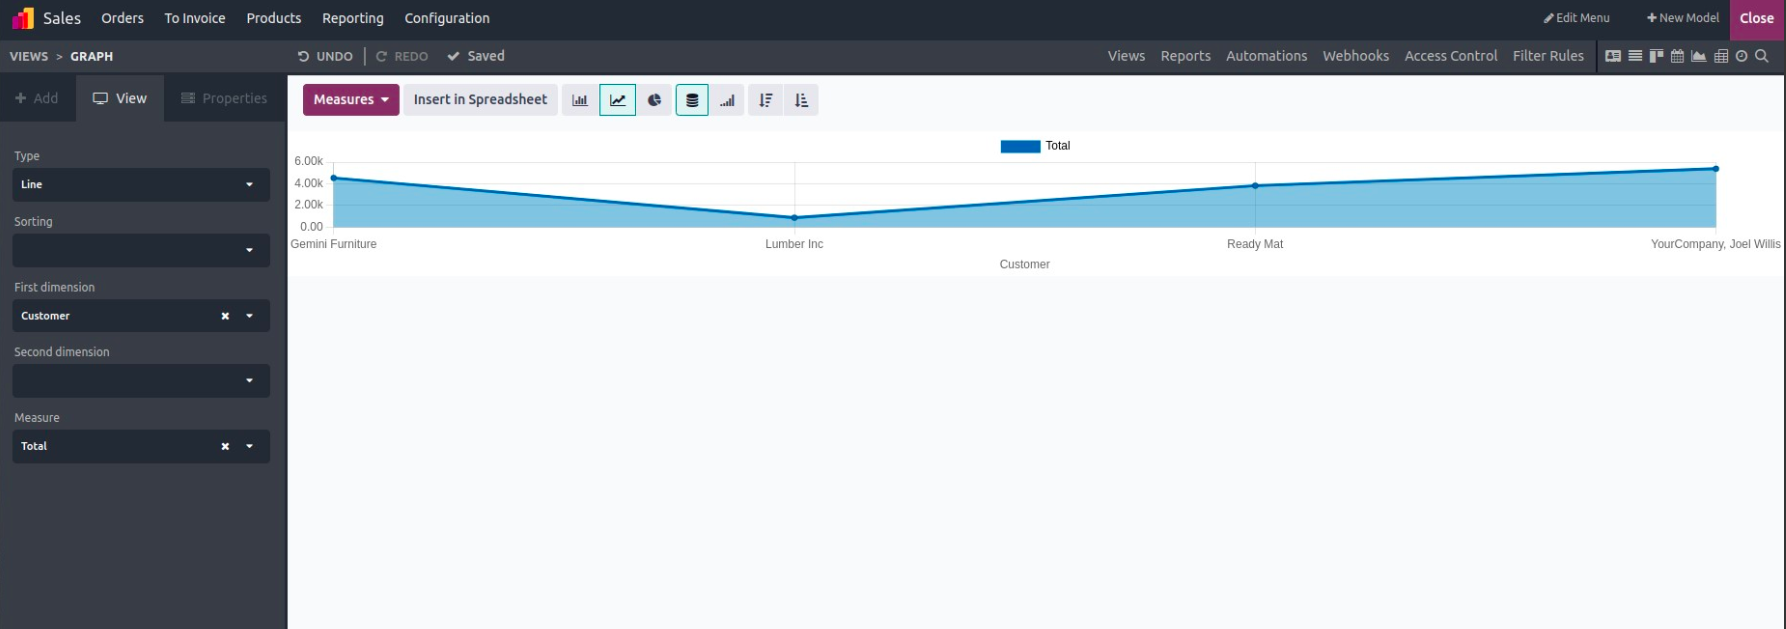
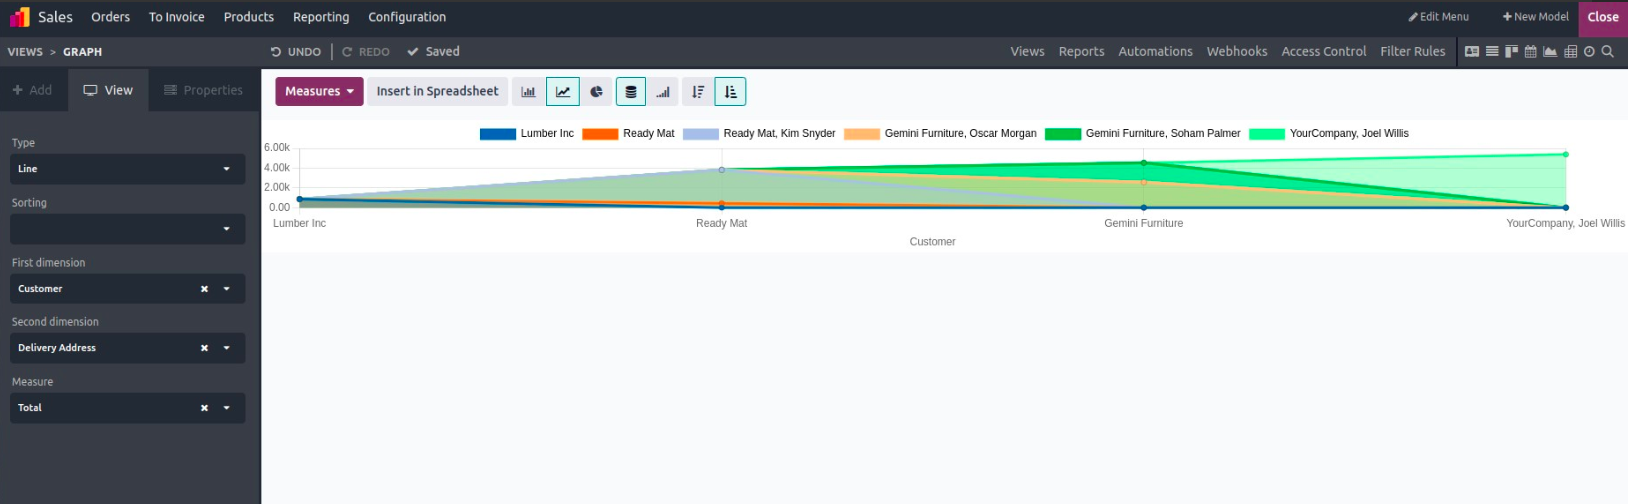
Example: Ascending Order View
Here's how a line chart looks when sorted in ascending order, making it easier to follow growth or decline over time.
Line charts are ideal for showcasing how your data evolves. And with Odoo 18 Studio, creating one is as simple as a few clicks, no code or advanced setup required.