A pie chart is a circular graph that displays data in segments, with each slice representing a percentage or fraction of the entire dataset. Access the Studio module in Odoo 18 and choose the model you want to use to create a pie chart.
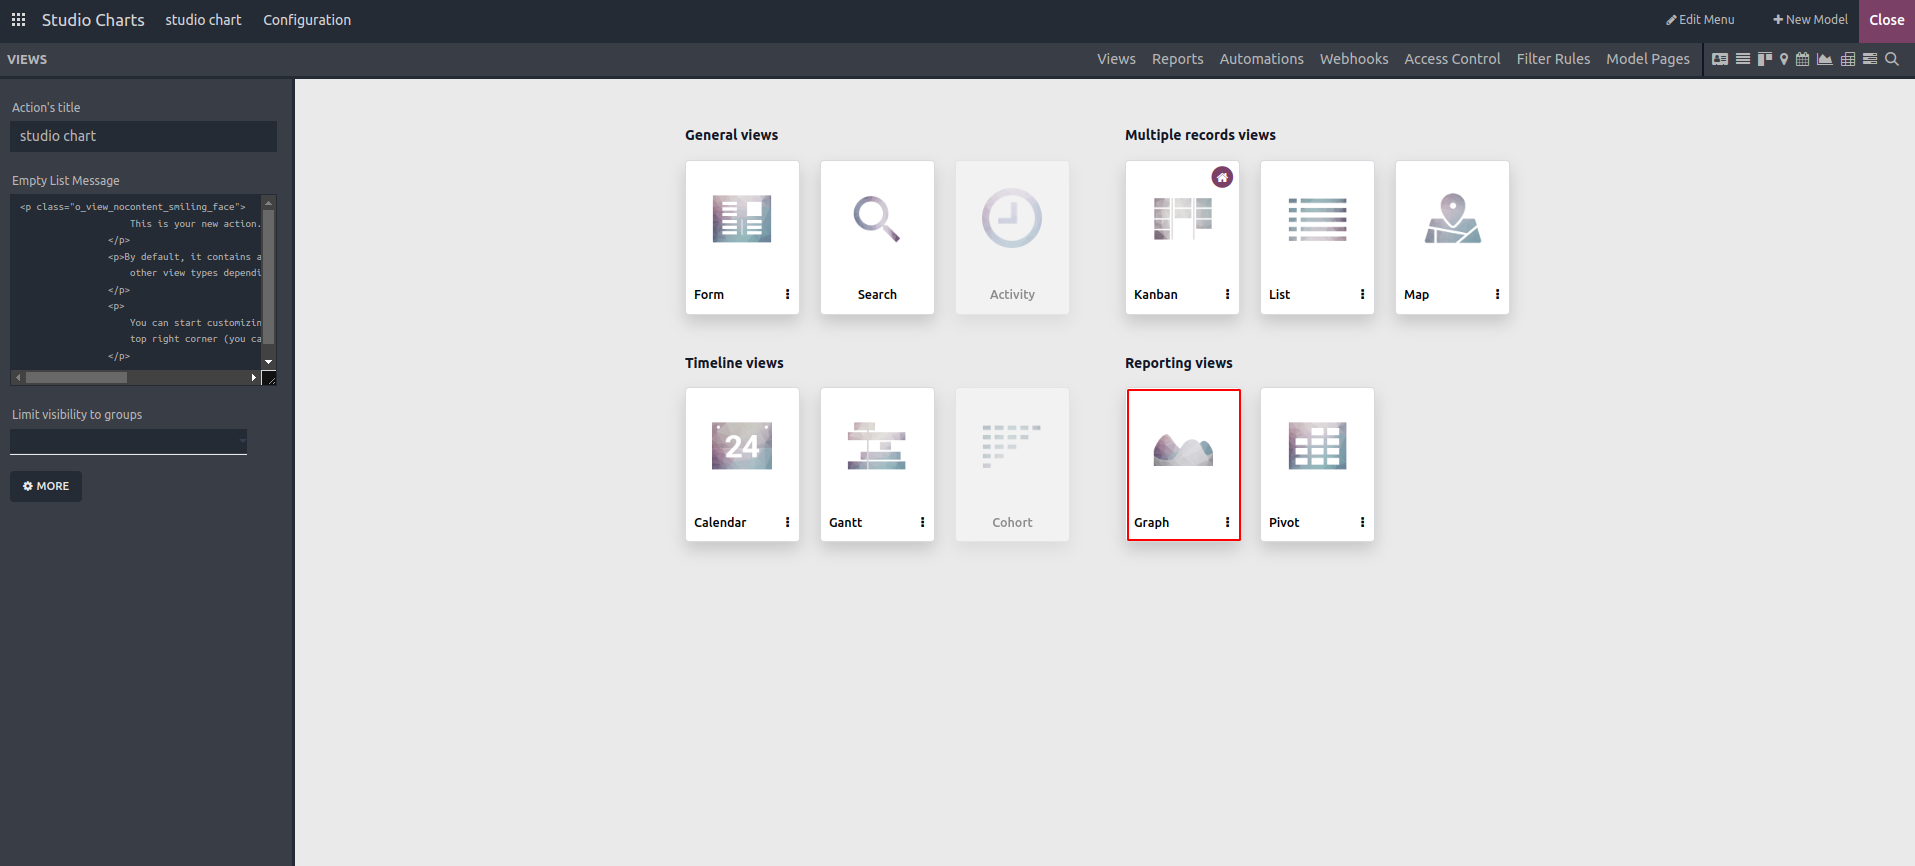
Navigate to the Views tab and click on "Graph View" from the available view options.
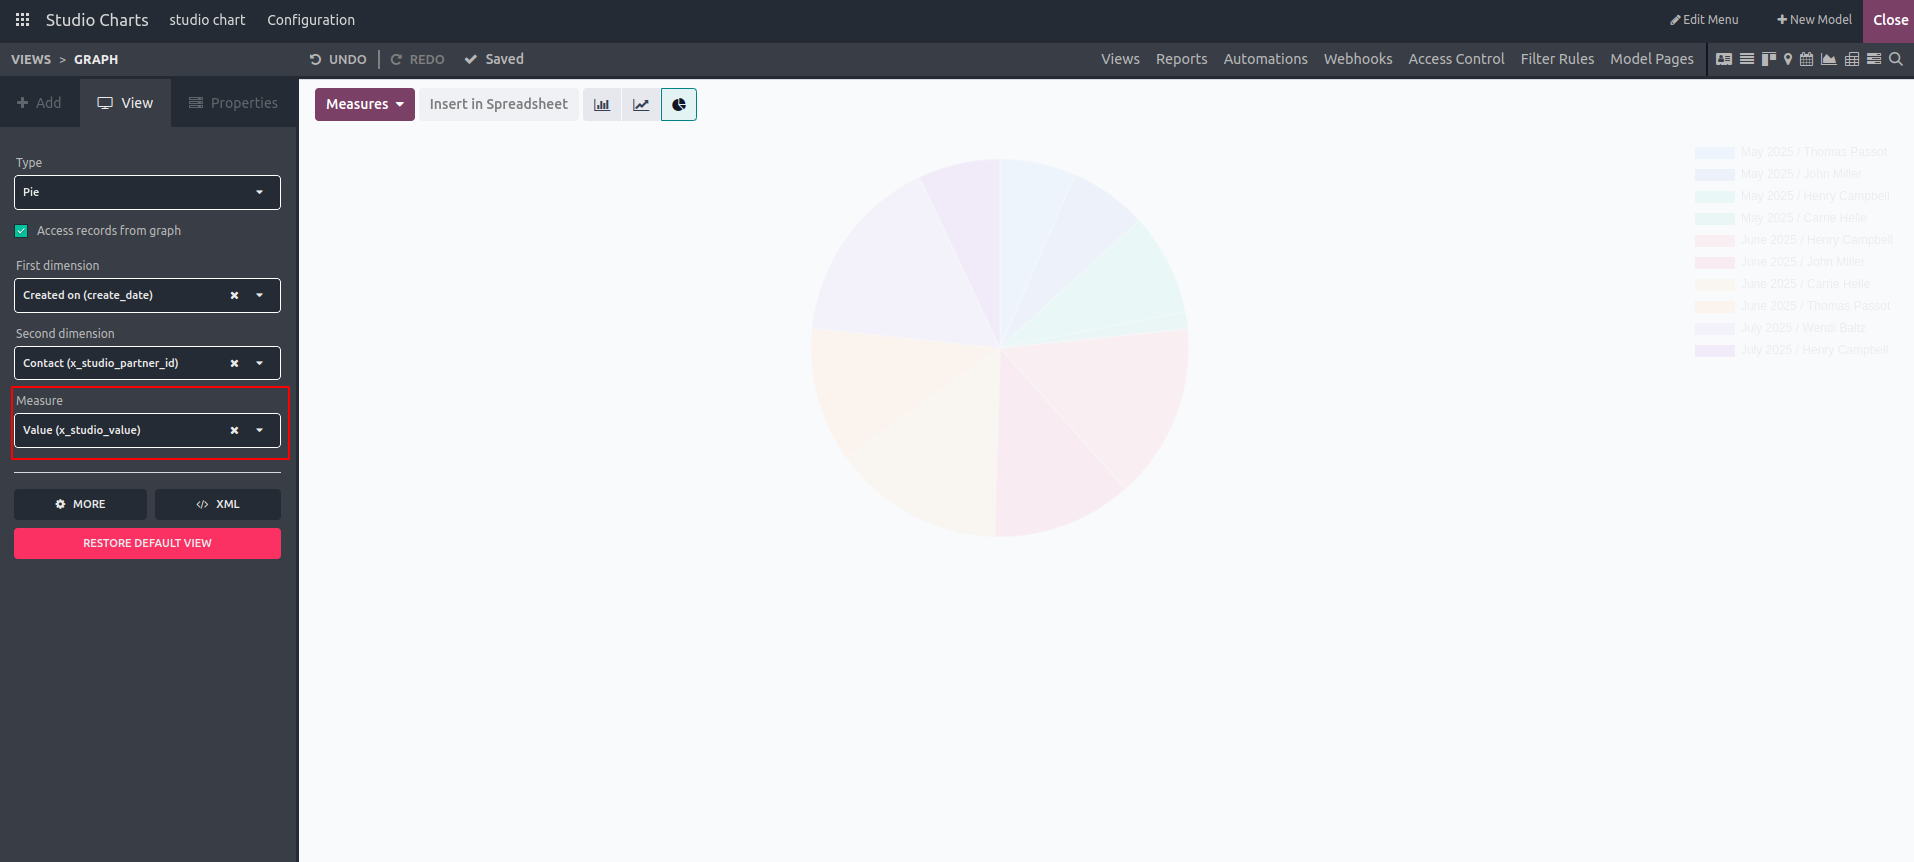
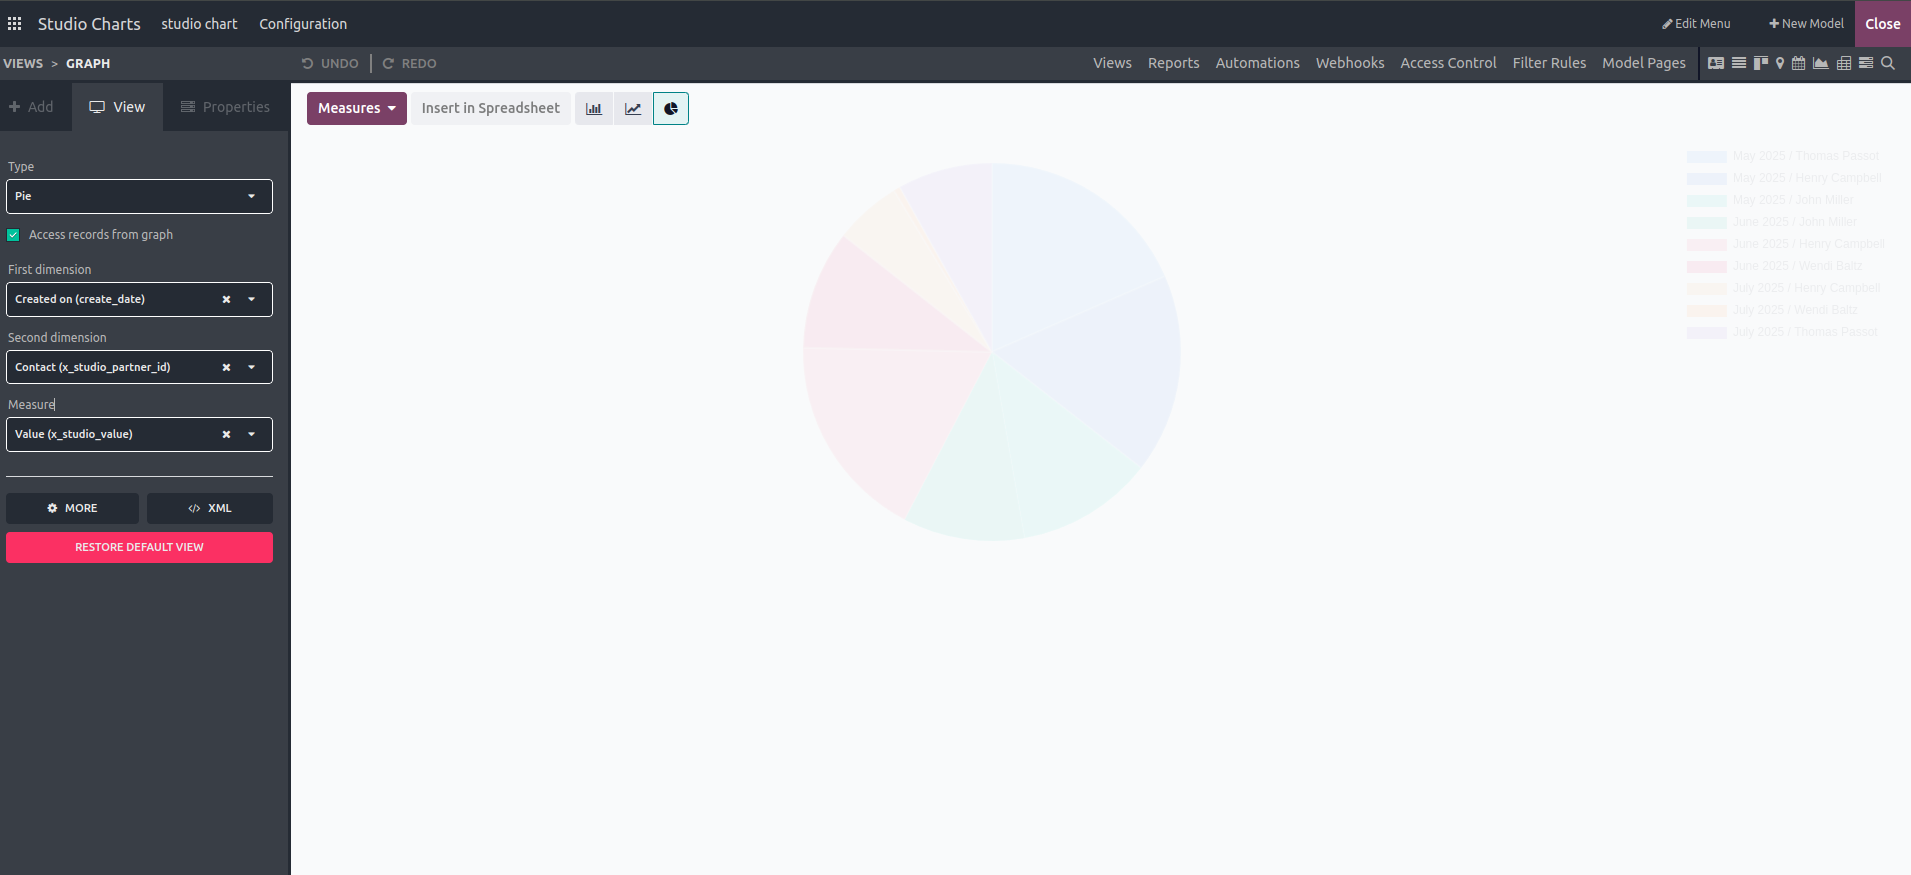
Under the View option, we can choose "Pie" as the chart type.
The user can choose from the following options within the view.
- Access records from the graph
- First Dimension
- Second Dimension
- Measures
By enabling the "Access records from the graph" option, the user can view records directly from the pie chart. Furthermore, the data dimensions can be defined using the "First Dimension" and "Second Dimension" settings.
Choose the Measure field to define the default data type that will be measured in the view.