The Pivot Table view in Odoo Studio is a powerful tool for analyzing and visualizing data. Whether you're building custom reports, breaking down financial metrics, or creating management dashboards, pivot tables let you organize data in a way that reveals patterns and trends.
With Odoo 18 Studio, you can create and customize pivot views for any custom model—no technical skills required.
Why Use Pivot Tables?
Pivot tables allow you to:
- Create custom data summaries tailored to your business models.
- Group and filter data dynamically using one or more fields.
- Aggregate values using built-in functions like sum, count, and average.
- Design views with flexible row and column groupings.
- Build graphs and charts on top of pivot views for easier visualization.
Accessing the Pivot View in Studio
To get started:
- Open the Studio module.
- Select the model you want to analyze.
In the Views section, go to Reporting Views and enable the Pivot view.
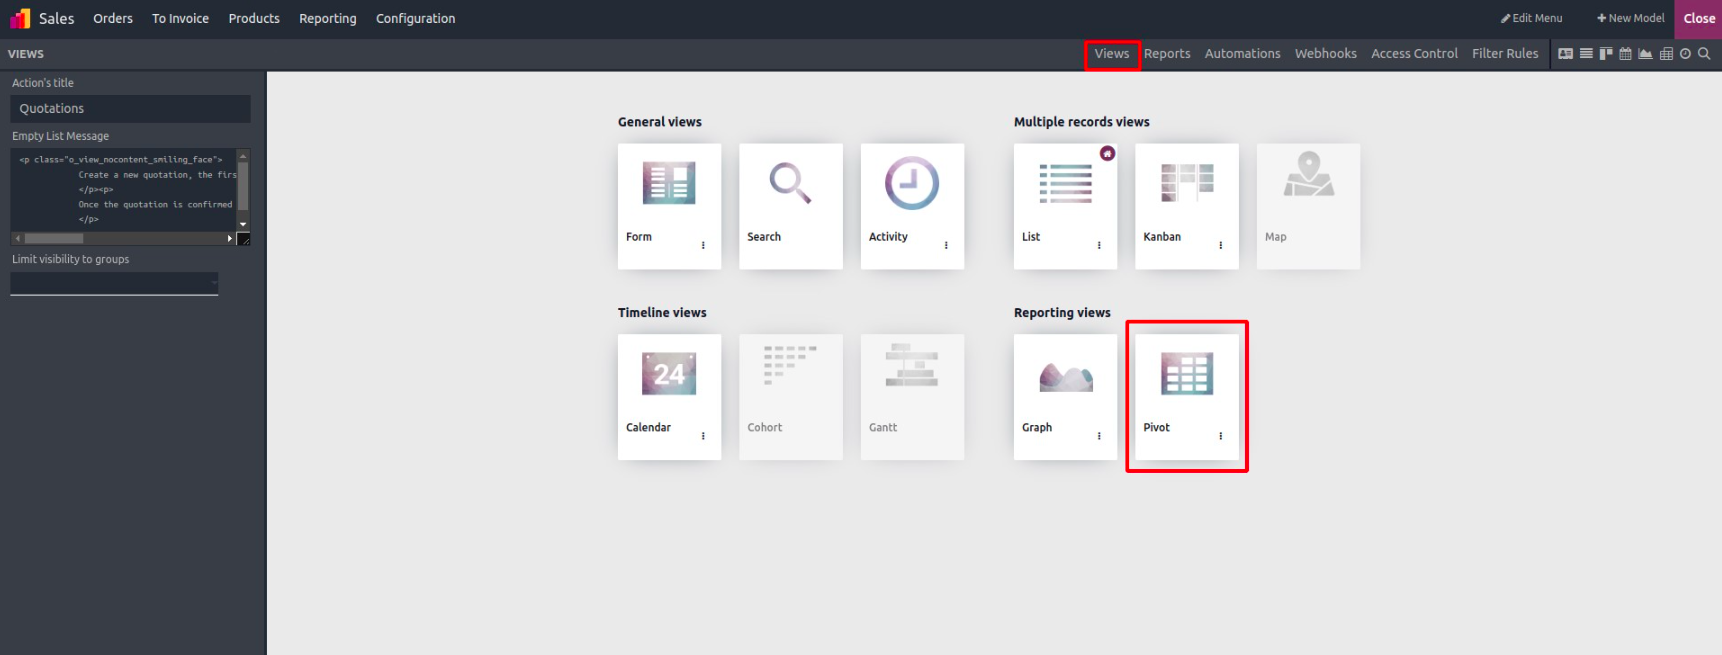
Once enabled, the pivot editor becomes available, and users can begin shaping their data into meaningful insights.
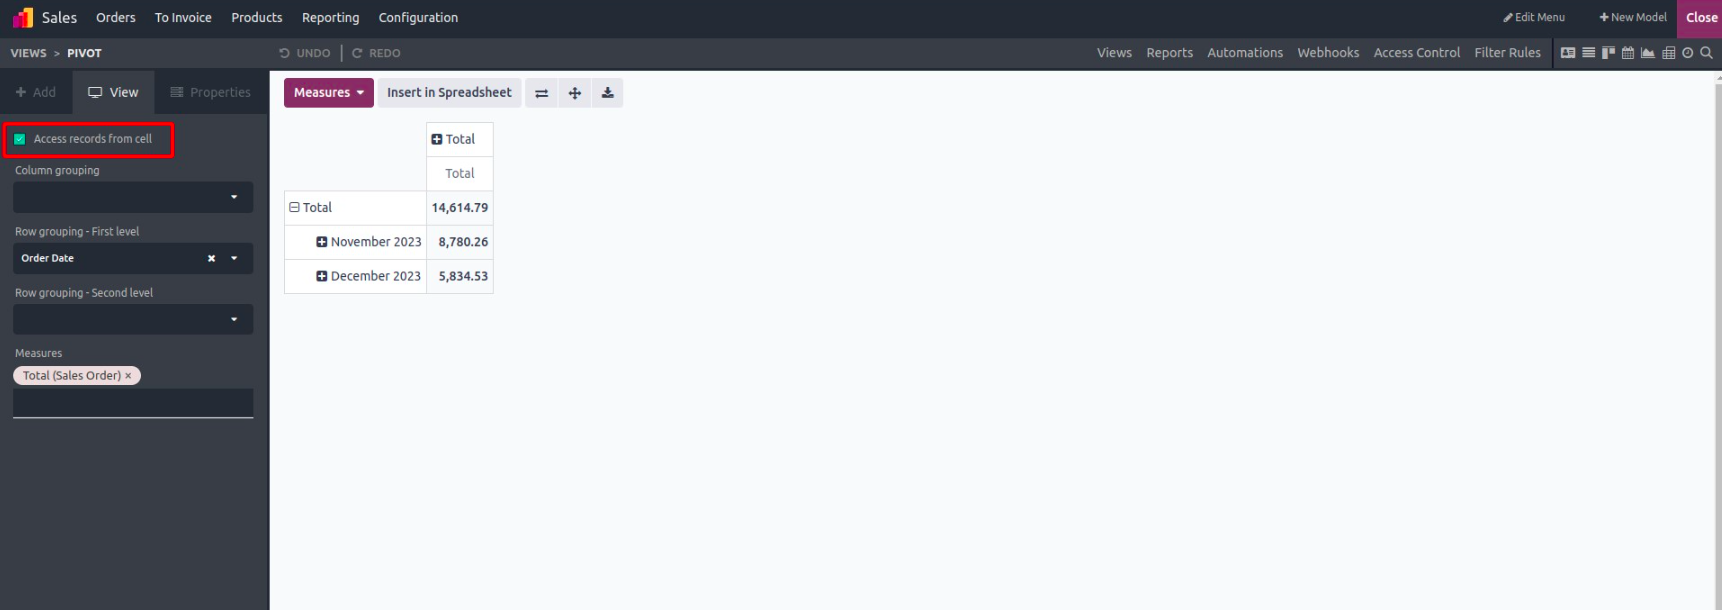
Exploring the Pivot Table View
After activating the pivot view, you'll be able to view and interact with data in a table format. You can expand, group, and explore records directly from this interface.
Grouping Data by Columns
Column grouping lets you organize data across the top of the table, often based on time periods (e.g., by month, quarter) or categories like product types or sales regions.
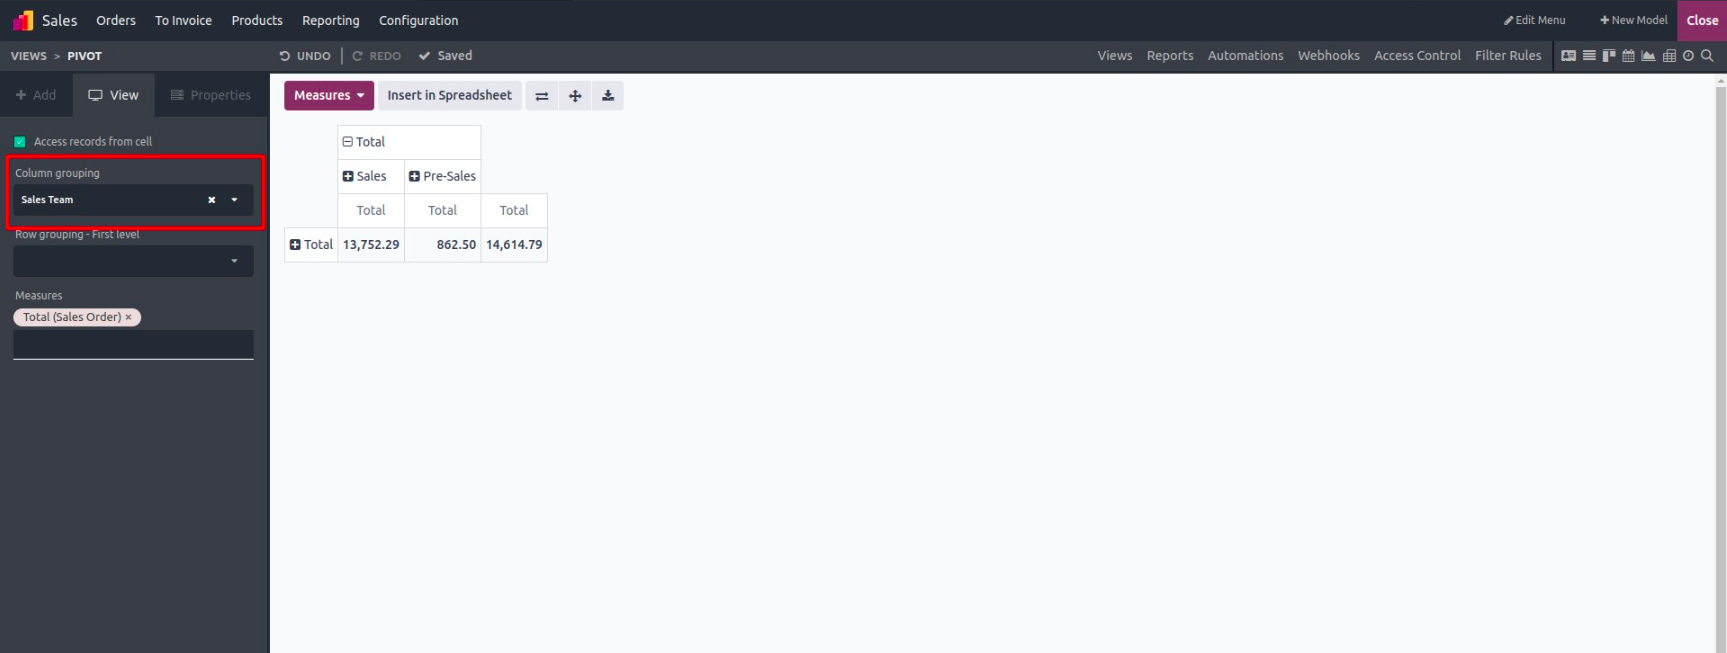
This helps in quickly comparing values across multiple categories.
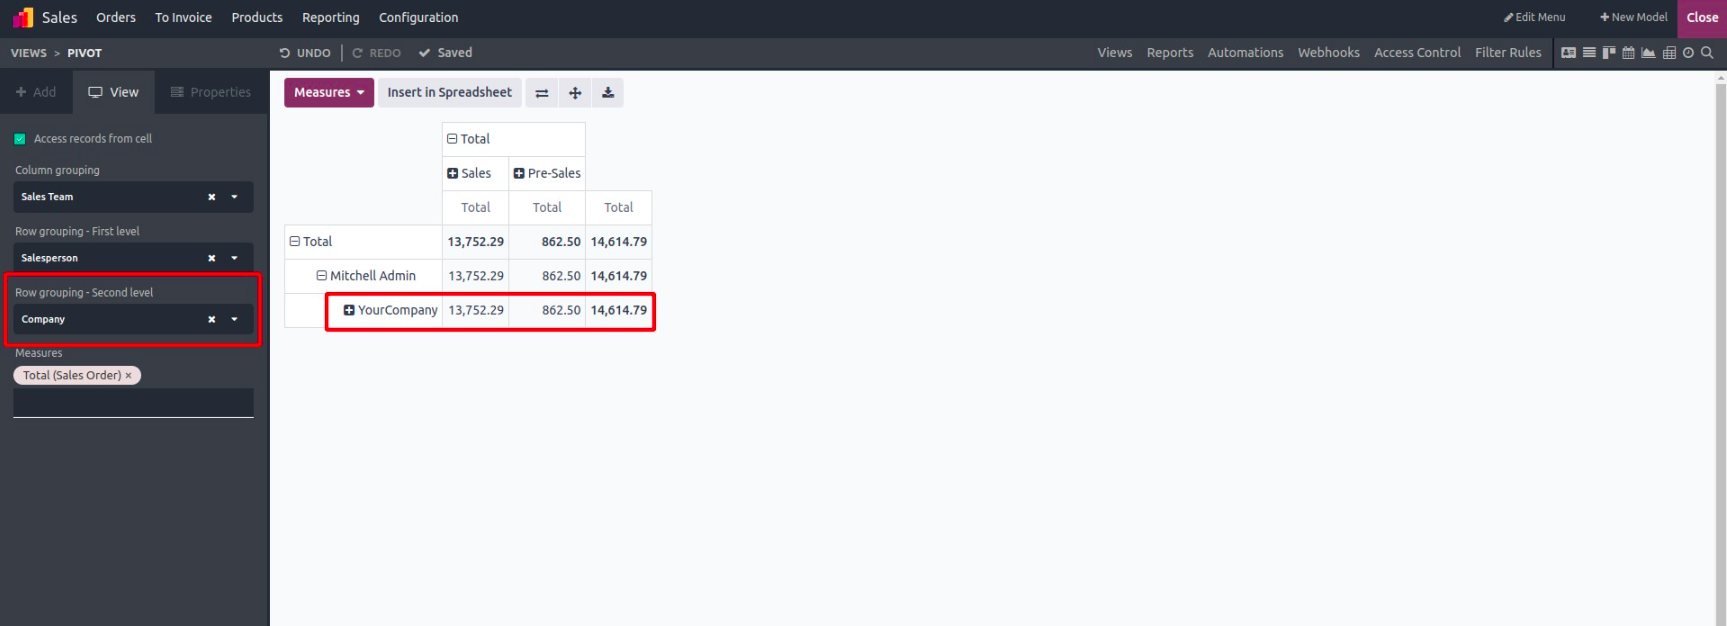
Grouping Data by Rows
Row grouping organizes your records vertically. This is helpful for building hierarchies, such as grouping by salesperson, then by customer.
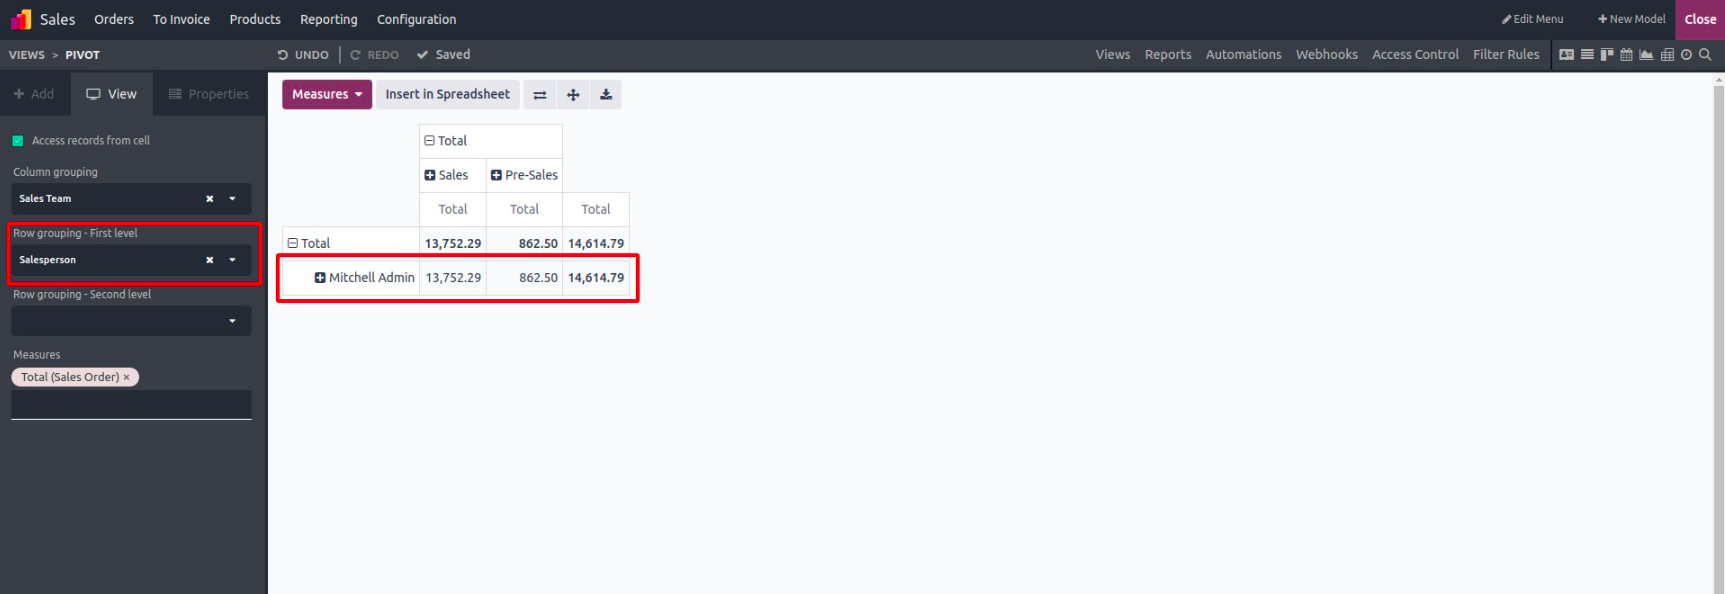
You can even apply nested row groupings by adding a second dimension. For example, first by region, then by salesperson, to drill down further.
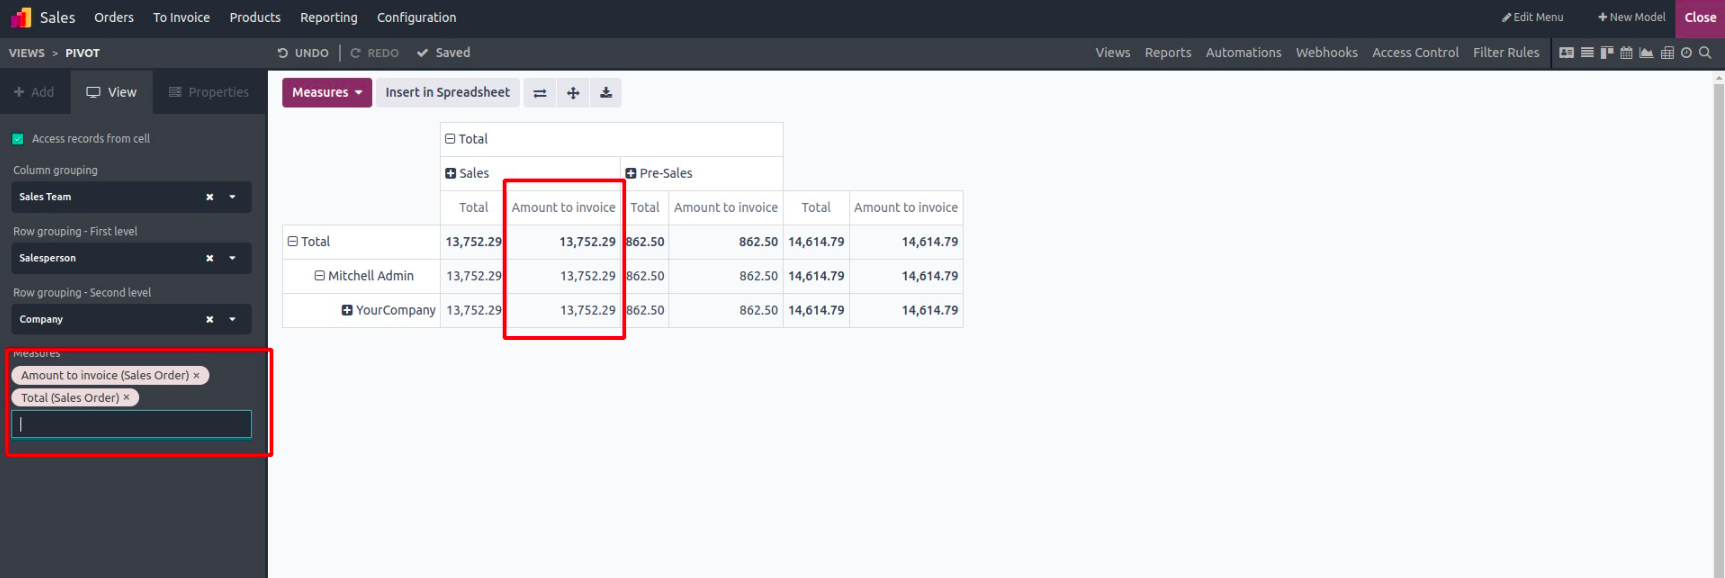
Adding Measures
Measures are the numeric fields being analyzed. These could include totals, quantities, or monetary values. You can add one or more measures depending on the business metric you’re tracking.
For example:
- Total Revenue
- Quantity Delivered
- Amount to Invoice
One of the great features of the pivot view is the ability to click on any value in the table to open the list of records behind that number. This allows you to move from high-level summaries to granular data with just a click.