Code profiling in Odoo can help you identify performance bottlenecks and optimize your code. It is a technique used to analyze the code execution time, complexity of the program, and memory usage of an application.
Profiling can prove as a helpful tool for finding performance issues and identifying which part of the code will affect performance. By using profiling techniques in Odoo, you can improve the overall performance and user experience of your application, making it faster and more efficient.
Now let us see how we can make use of code profiling in Odoo.
Some of the methods are Graph a method, Log a method, and Tracing code execution. In Odoo 16, we can check the profiling by using Enable the Profiler.
The profiler can be enabled from the User Interface and also through Code.
Enable from User Interface
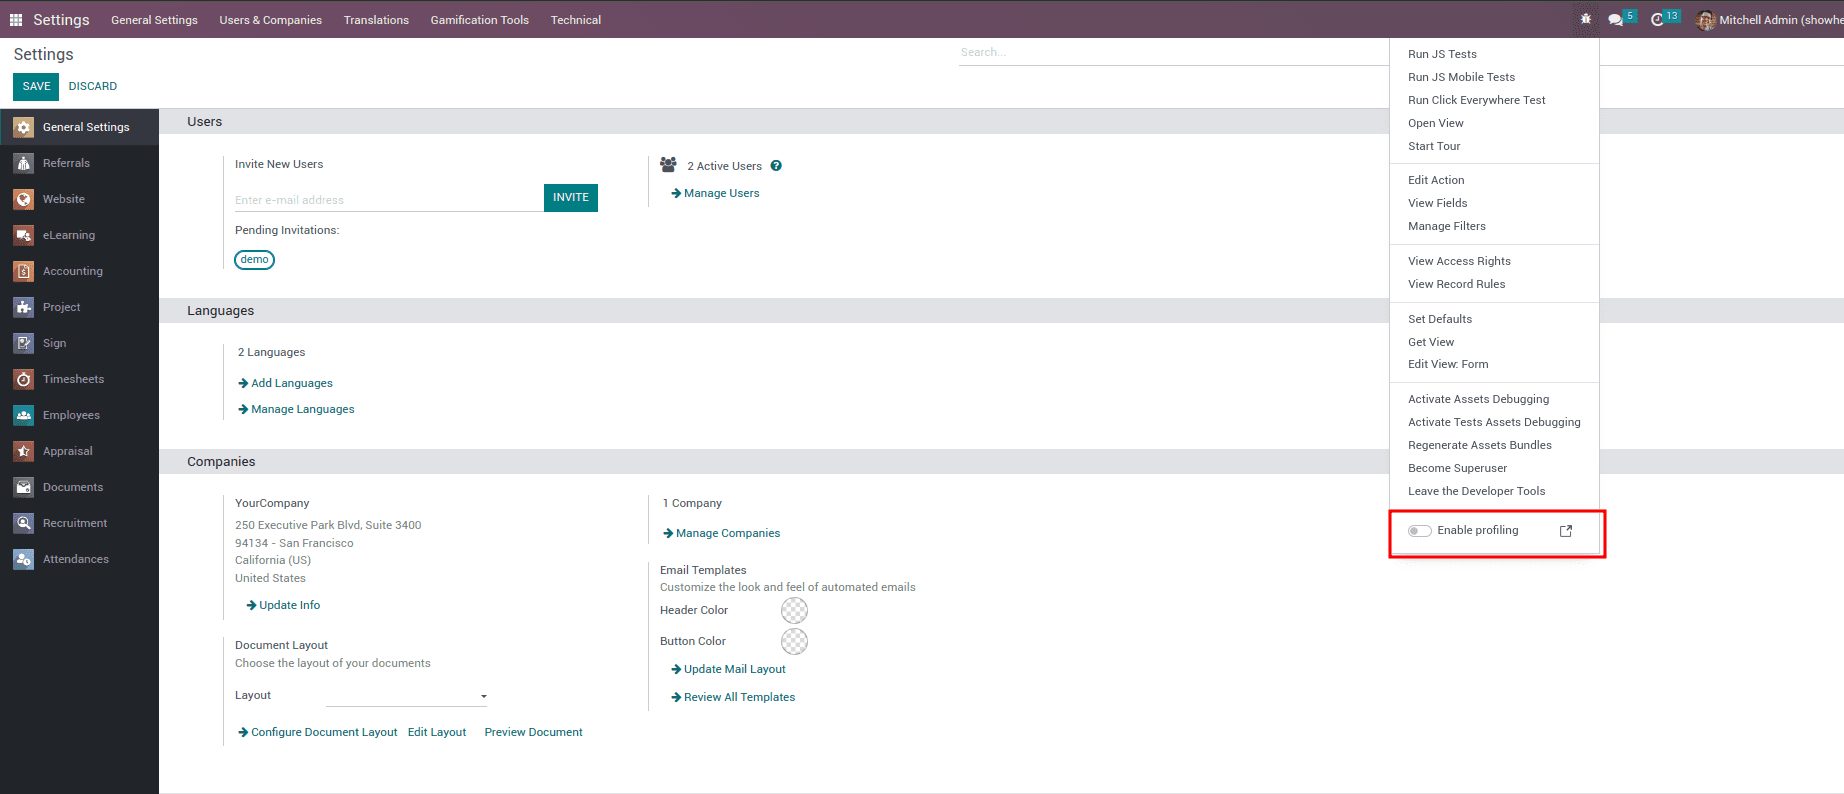
1. We need to enable developer mode.
2. Enable the profiling mode from debug icon in the systray.
When we activate this button, it prompts a wizard to appear, allowing us to adjust the profiling start time and end time.
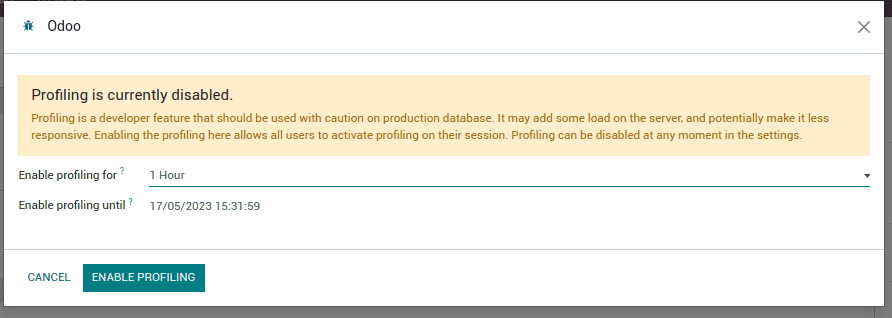
This will help to enable profiling in a database. When the profiler is enabled, users can enable it in their session.
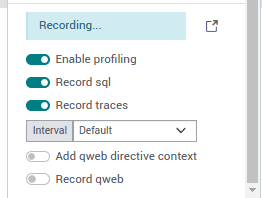
When the profiler is activated, it captures and stores detailed information about all the requests sent to the server, which are then saved as an "ir.profile" record. These records are organized into the ongoing profiling session, which starts when the profiler is enabled and continues until it is disabled.
Result Analysis of Profiler
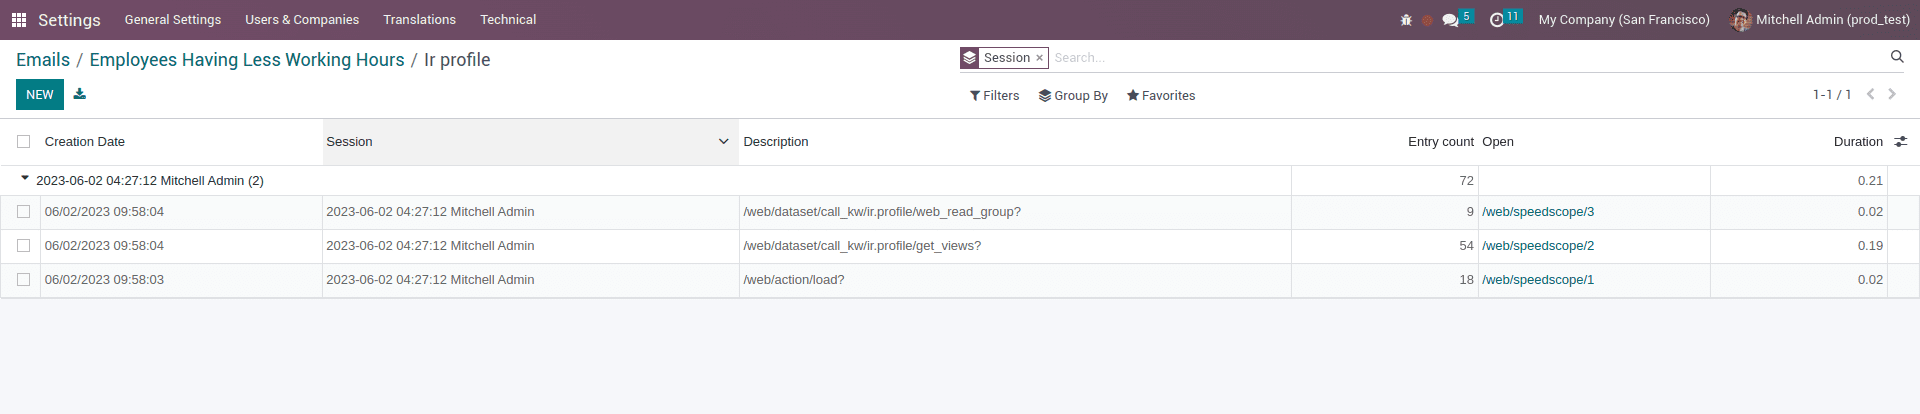
While accessing the debug mode and opening the external link for ir.profiler, we can analyze the profiling results. It opens the profiling view of ir.profile model with a list view. It contains data, including the session, creation date, entry count, and duration.
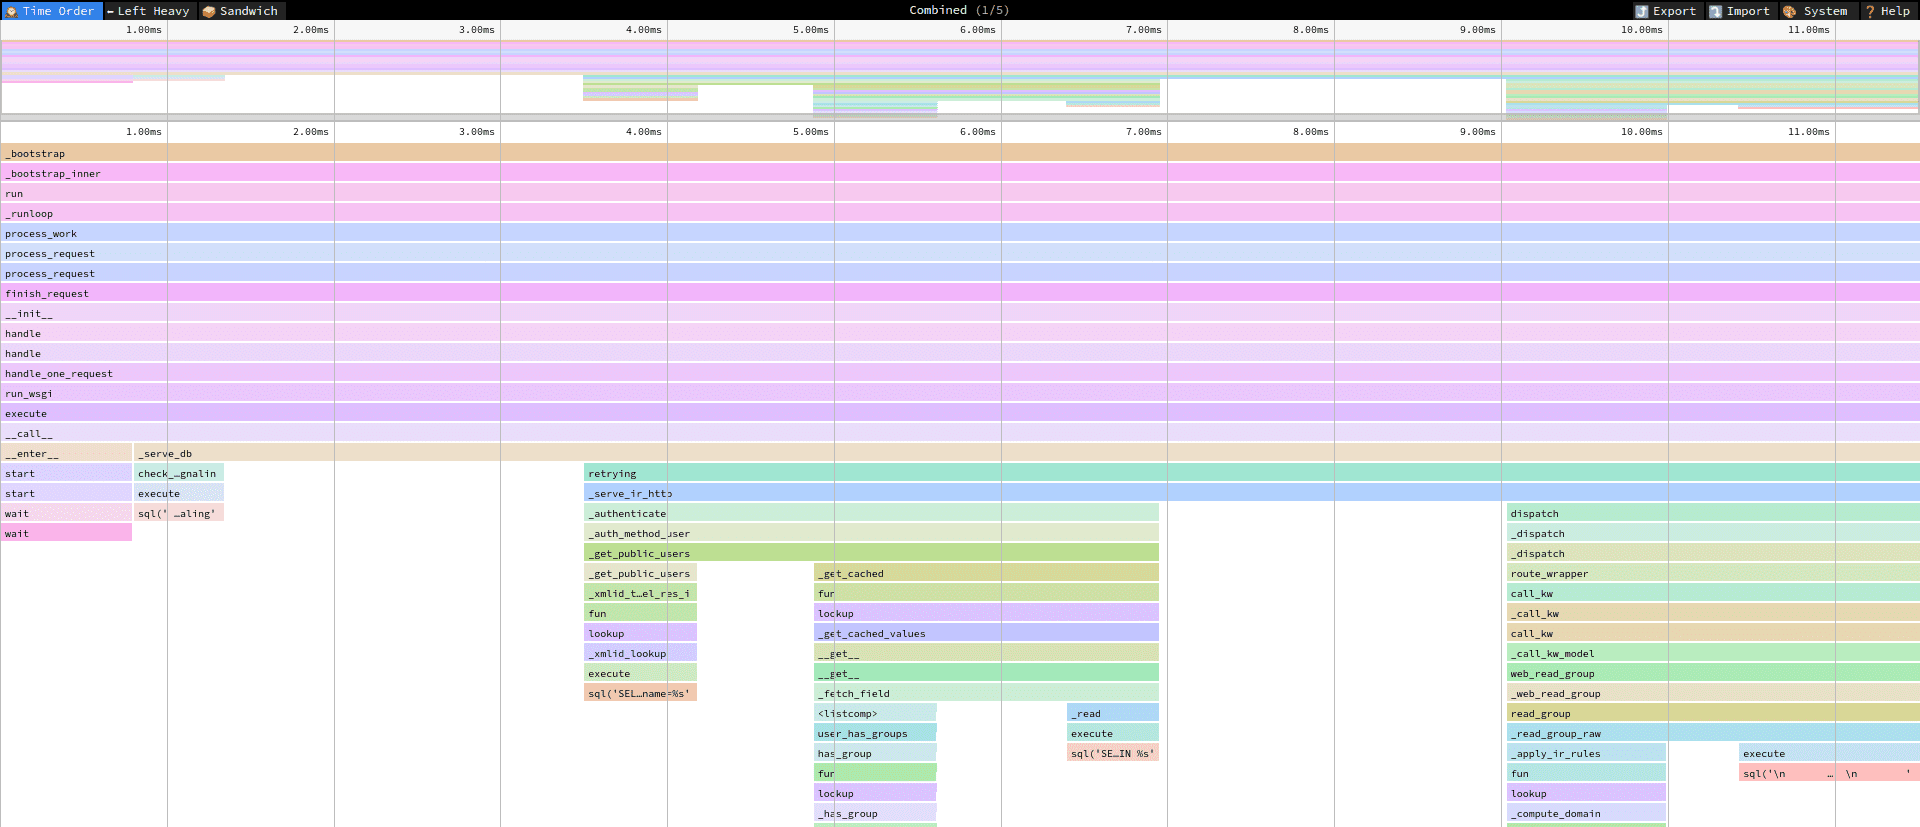
Furthermore, we have the ability to obtain Speedscope as our outcome.
Here are the speed scope results of profiler, which provides a powerful visual representation of profiling data, enabling you to understand and optimize the performance of your code
Using some other methods we can also check the performance of code using other methods like graph a method, tracing code execution, and log a method.
To read more about the importance of code profiling in Odoo, refer to our blog Code Profiling in Odoo