Code profiling is a dynamic analysis of a program that measures the complexity of a program, time is taken for code executions, frequency of function calls, and memory usage. The tool used for profiling code is known as a profiler. The profiling is done based on the performance analysis of source code or in its binary executable form.
In this blog let us discuss one of the major aspects of coding i.e code profiling.
The need for profilers is very important for programmers as it gives an analysis of how well their program works on different platforms. So it becomes easier to use profilers to identify the section of code that requires more time and thereby provide optimization for better performance. In short, we can say that profiling helps to identify bottlenecks of our program.
Profilers are mainly of two types server-side and desktop. In server-side profilers, it makes note of the transaction request time like how much time the web request takes, see the errors, etc. In desktop profilers, it keeps track of the performance of each line of code. In short, it keeps track of memory utilization and garbage collection.
Now let us see how we can make use of code profiling in Odoo.
Here we will discuss few methods to perform the profiling :
Graph a method:
Odoo embeds a profiler in code that generates graphs of calls triggered in the program, time is taken, memory used, etc.
For that, you can add the below code to the function for which you need to perform the analysis.
from odoo.tools.misc import profile
[...]
@profile('/temp/prof.profile')
def mymethod(...)
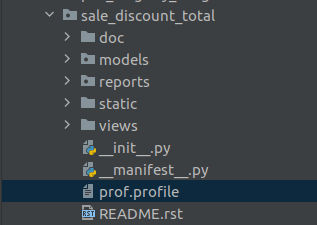
The @profile('/temp/prof.profile') should consist of the path where you need your file prof.profile because adding the above code produces a file prof.profile.
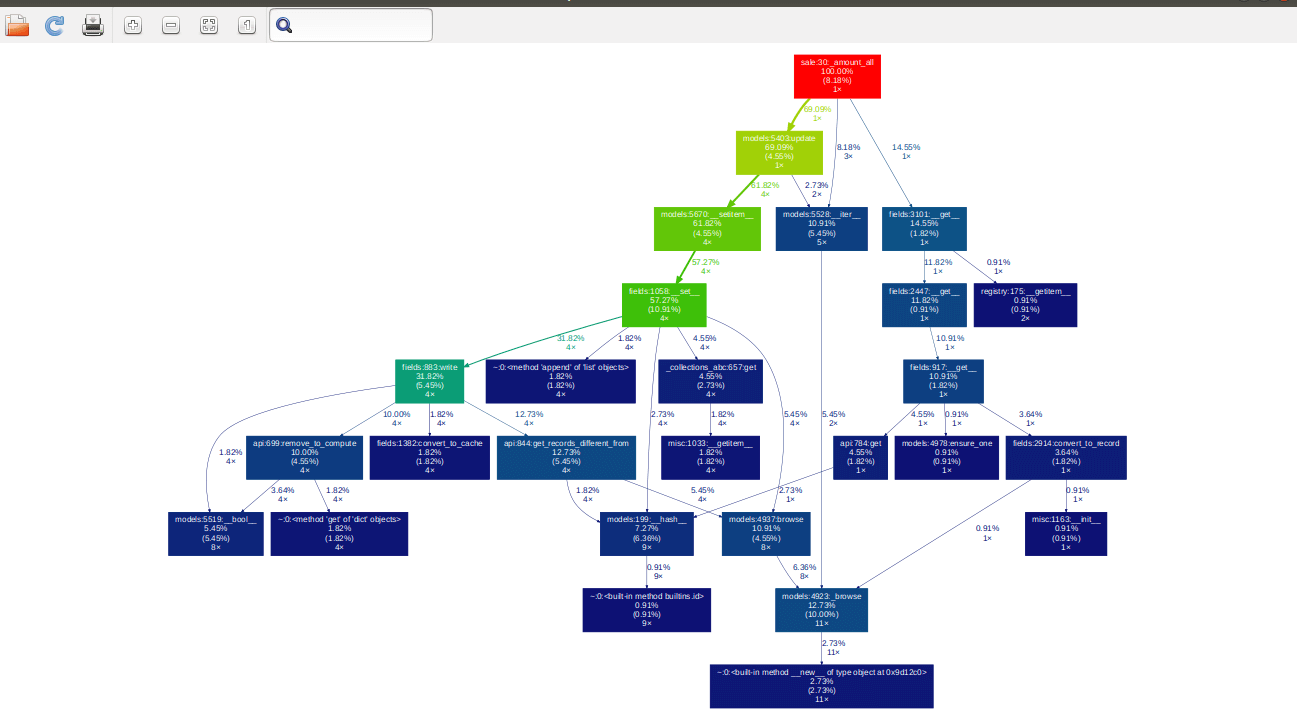
Now you can use the tool gprof2dot to produce a graphical analysis.
Run the below command in terminal:
gprof2dot -f pstats -o /temp/prof.xdot /temp/prof.profile
/temp/prof.profile, /temp/prof.xdot should be replaced with your file path.
To see the graphical analysis run the below command:
xdot /temp/prof.xdot
Here in order to see the graphical analysis, we use the tool xdot which will provide the description as mentioned below.
Log a method
Another strategy to log the statistical data on a method using another profiler can be done using the following code:
from odoo.tools.profiler import profile
[...]
@profile
@api.model
def mymethod(...):
Adding the above code produces the following data in the log:
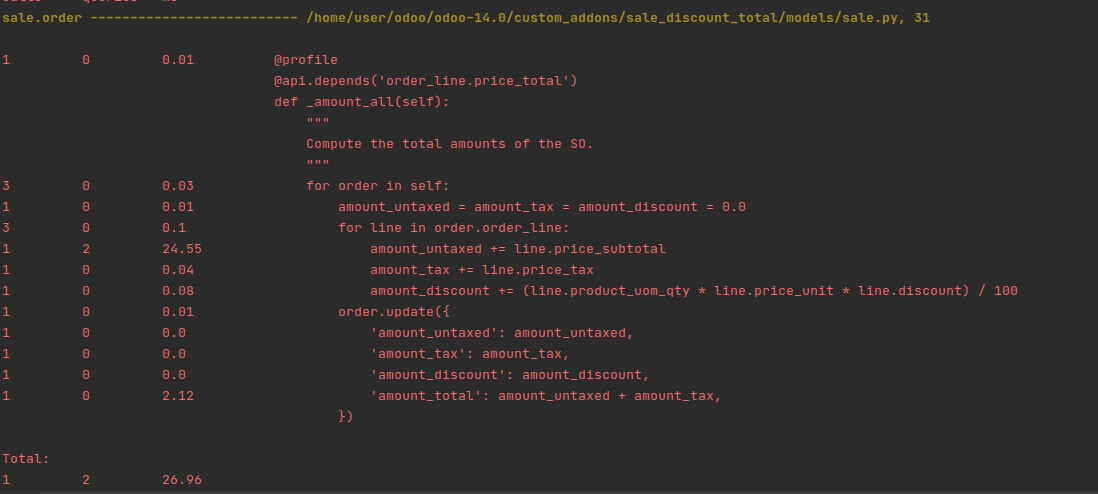
So from the above information, we will get information like time taken to execute functions and optimize code accordingly.
Tracing Code Execution
In order to analyze the poor process performance a tool called pyflame can be used.
In order to use this first of all we need to install pyflame and flamegraph
The flamegraph helps us to analyse the result using the graphical view.
In short, we can say the flamegraph provides the visual representation of the call stack.
Run the below commands to install the packages:
sudo apt install autoconf automake autotools-dev g++ pkg-config python-dev python3-dev libtool make
git clone https://github.com/uber/pyflame.git
git clone https://github.com/brendangregg/FlameGraph.git
cd pyflame
./autogen.sh
./configure
make
sudo make install
The pyflame tool traces the processing from time to time and produces the graph.
pyflame --exclude-idle -s 3600 -r 0.2 -p <PID> -o test.flame
Here the PID is the process id. Using the result of the above command produces an svg graph.
flamegraph.pl ./test.flame > ~/mycode.svg
The above discussed are some of the methods you can follow for profiling your code, which thereby increases the quality of your code, and helps to optimize the memory usage, code performance.