Dashboards of a software tool can play a very significant role in improving and supporting the business the same way the reports do. Both play a key role in disseminating and highlighting important information pertaining to various business operations. Both the dashboard and the reports help the management with insightful information totrigger fast and quick business decisions.
This blog explains how one can create the Dashboard using XML, d3js, BBJS, python in Odoo.
We know Odoo is one of the fastest-growing business applications with immense possibilities of customization and integration around. It is a virtual sea that can be tweaked to any extent matching the exact requirement of the business.
With each version release, Odoo is expanding its plethora of functions, making it more intrinsically practical to answer all your queries regarding business operations.
With no further stretch, let us see how Dashboard can be created in Odoo using packages and aforesaid languages.
Basic setups for building an Odoo Dashboard which contains the following folders and files.
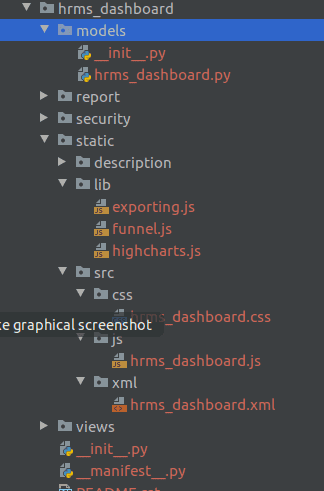
a folder name like hrms_dashboard this is what we call as the technical name of this dashboard module.
And we need to add to files named __init__.py and __manifest__.py. Note: These two files are mandatory.
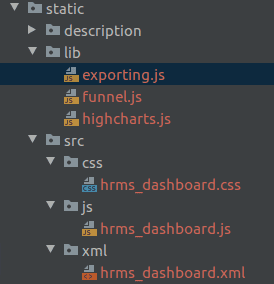
css/js/img/, lib/ XML template ,etc are contained in the static folder. This folder acts as the right place for your style, images, libraries, and js code.
The view folder contains the views and the asset files of the dashboard.
First of all, we need to create actions, menu item, and assets in an XML file that contained in views
Example:
The next step is to create a new XML Template like The example given below:
Here I’m creating a dashboard for Showing Client Wise Employee Details as Piechart.
In the same dashboard, we can add lots of information and different types of graphs and charts.
For creating graphs and charts we have some packages such as:-
1. D3 js
2. Chart js
3. Chartist js
4. Highchart js etc..
The next step is to create a new js file to return values to the XML template that we created before.
From js file, we can also return Charts and Graphs to XML template
This is a sample code for returning a pie graph to the XML template
render_client_employee_graph:function(){
var self = this;
var w = 200;
var h = 200;
var r = h/2;
var elem = this.$('.client_graph');
var colors = ['#70cac1', '#659d4e', '#208cc2', '#4d6cb1', '#584999', '#8e559e', '#cf3650', '#f65337', '#fe7139',
'#ffa433', '#ffc25b', '#f8e54b'];
var color = d3.scale.ordinal().range(colors);
rpc.query({
model: "hr.employee",
method: "get_client_employee",
}).then(function (data) {
var segColor = {};
var vis = d3.select(elem[0]).append("svg:svg").data([data]).attr("width", w).attr("height", h).append("svg:g").attr("transform", "translate(" + r + "," + r + ")");
var pie = d3.layout.pie().value(function(d){return d.value;});
var arc = d3.svg.arc().outerRadius(r);
var arcs = vis.selectAll("g.slice").data(pie).enter().append("svg:g").attr("class", "slice");
arcs.append("svg:path")
.attr("fill", function(d, i){
return color(i);
})
.attr("d", function (d) {
return arc(d);
});
var legend = d3.select(elem[0]).append("table").attr('class','legend');
// create one row per segment.
var tr = legend.append("tbody").selectAll("tr").data(data).enter().append("tr");
// create the first column for each segment.
tr.append("td").append("svg").attr("width", '16').attr("height", '16').append("rect")
.attr("width", '16').attr("height", '16')
.attr("fill",function(d, i){ return color(i) });
// create the second column for each segment.
tr.append("td").text(function(d){ return d.label;});
// create the third column for each segment.
tr.append("td").attr("class",'legendFreq')
.text(function(d){ return d.value;});
});
},
In this function, we are calling values from python using the RPC query then assigning it to Graph, Rpc query is used for fetching values from the backend.
rpc.query({
model: "hr.employee",
method: "get_client_employee",
})
Here we are calling python function named as get_client_employee from the model hr.employee
After calling the python function, we need to assign values to Graph.
.then(function (data) {
var segColor = {};
var vis = d3.select(elem[0]).append("svg:svg").data([data]).attr("width", w).attr("height", h).append("svg:g").attr("transform", "translate(" + r + "," + r + ")");
var pie = d3.layout.pie().value(function(d){return d.value;});
var arc = d3.svg.arc().outerRadius(r);
var arcs = vis.selectAll("g.slice").data(pie).enter().append("svg:g").attr("class", "slice");
arcs.append("svg:path")
.attr("fill", function(d, i){
return color(i);
})
.attr("d", function (d) {
return arc(d);
});
var legend = d3.select(elem[0]).append("table").attr('class','legend');
// create one row per segment.
var tr = legend.append("tbody").selectAll("tr").data(data).enter().append("tr");
// create the first column for each segment.
tr.append("td").append("svg").attr("width", '16').attr("height", '16').append("rect")
.attr("width", '16').attr("height", '16')
.attr("fill",function(d, i){ return color(i) });
// create the second column for each segment.
tr.append("td").text(function(d){ return d.label;});
// create the third column for each segment.
tr.append("td").attr("class",'legendFreq')
.text(function(d){ return d.value;});
});
Before rendering the graph, we need to declare or assign packages and the widget that is needed for creating the template.
For example:
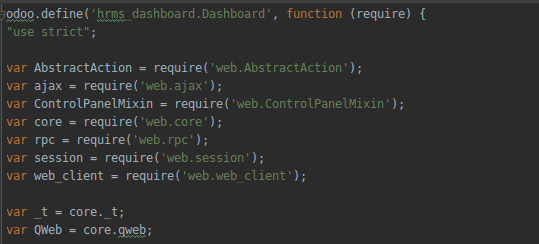
And also we need to use usual functions and methods, in this blog I am not explaining the basic structure of Odoo js.
Check the below link to study the basics of Odoo js: javascript_reference.
Hope the blog was useful.