A dashboard can make it easier to keep track of important information without opening different menus and views. For example, a sales team may need to check the number of quotations, confirmed orders, and total sales regularly. Instead of checking each of these separately, the information can be displayed together on a single dashboard. Odoo provides several standard views for working with records, such as list, form, kanban, graph, and pivot views. However, there are situations where a custom screen is more suitable for a particular requirement. In such cases, developers can create a custom dashboard using the Odoo web framework.
In Odoo 20, dashboards can be created using client actions, OWL components, and QWeb templates. The client action opens the custom screen, the OWL component handles its logic, and the QWeb template defines the content displayed to the user. In this blog, we will create a simple Sales Dashboard in Odoo 20. The dashboard will display the total number of quotations, confirmed sales orders, and the total sales amount. The values will be retrieved from the sale.order model.
One important change to keep in mind when working with Odoo 20 is that it uses OWL 3. The reactive state handling used in earlier OWL versions is different in OWL 3. In this example, we will use the signal() API to keep the dashboard values reactive.
Creating the Client Action
The first step is to create a client action for the dashboard. A client action allows Odoo to open a custom JavaScript-based interface instead of a standard model view.
Create an XML file inside the views directory:
views/sales_dashboard_views.xml
<?xml version="1.0" encoding="UTF-8"?>
<odoo>
    <record id="sales_dashboard_action" model="ir.actions.client">
        <field name="name">Sales Dashboard</field>
        <field name="tag">sales_dashboard</field>
    </record>
    <menuitem
        id="sales_dashboard_menu"
        name="Sales Dashboard"
        sequence="10"
        action="sales_dashboard_action"
        parent="sale.sale_menu_root"/>
</odoo>
Here, the ir.actions.client record creates the client action. The name field defines the name of the action:
<field name="name">Sales Dashboard</field>
The tag is used to connect the client action with the JavaScript component:
<field name="tag">sales_dashboard</field>
The menu item makes the dashboard accessible from the Sales application:
<menuitem
    id="sales_dashboard_menu"
    name="Sales Dashboard"
    sequence="10"
    action="sales_dashboard_action"
    parent="sale.sale_menu_root"/>
The important part here is that the tag value, sales_dashboard, will also be used when registering the OWL component.
Creating the OWL Component
Once the client action is created, we need an OWL component to handle the dashboard.
static/src/js/sales_dashboard.js
/** @odoo-module **/
import { Component, signal } from "@odoo/owl";
import { registry } from "@web/core/registry";
import { useService } from "@web/core/utils/hooks";
class SalesDashboard extends Component {
    setup() {
        this.orm = useService("orm");
        this.quotationCount = signal(0);
        this.orderCount = signal(0);
        this.salesAmount = signal(0);
        this.loadDashboardData();
    }
    async loadDashboardData() {
        const data = await this.orm.call(
            "sale.order",
            "get_dashboard_data",
            []
        );
        this.quotationCount.set(data.quotation_count);
        this.orderCount.set(data.order_count);
        this.salesAmount.set(data.sales_amount);
    }
}
SalesDashboard.template = "sales_dashboard.SalesDashboard";
registry.category("actions").add(
    "sales_dashboard",
    SalesDashboard
);
First, the required OWL and Odoo modules are imported:
import { Component, signal } from "@odoo/owl";
import { registry } from "@web/core/registry";
import { useService } from "@web/core/utils/hooks";
The Component class is used to create the OWL component, while registry is used to register the component as a client action. The useService hook allows the component to access Odoo's ORM service.
Using Signals in Odoo 20
This is one of the important differences to keep in mind when creating dashboards in Odoo 20. Odoo 20 uses OWL 3, where signals are used for reactive values. In this example, three signals are created inside the setup() method:
this.quotationCount = signal(0);
this.orderCount = signal(0);
this.salesAmount = signal(0);
Each signal stores one value that will be displayed on the dashboard. The initial value of each signal is 0. When the values are received from the server, they are updated using the signal's set() method:
this.quotationCount.set(data.quotation_count);
this.orderCount.set(data.order_count);
this.salesAmount.set(data.sales_amount);
So, when working with signals in this Odoo 20 example, the basic pattern is:
Create:
signal(0)
Update:
signal.set(value)
Read:
signal()
This is different from the useState() pattern commonly seen in older OWL examples. For example, code written using an older OWL state pattern may look like this:
this.state = useState({
    quotationCount: 0,
});
With the Odoo 20 implementation used in this dashboard, we instead use:
this.quotationCount = signal(0);
The signal is then updated with:
this.quotationCount.set(value);
And its current value is read by calling it as a function:
this.quotationCount()
This difference is important when following older Odoo dashboard examples while working with Odoo 20.
Connecting the Component to the Client Action
The component is connected to the QWeb template using:
SalesDashboard.template = "sales_dashboard.SalesDashboard";
The component is then registered under the sales_dashboard action tag:
registry.category("actions").add(
    "sales_dashboard",
    SalesDashboard
);
This matches the tag that was defined earlier in the client action:
<field name="tag">sales_dashboard</field>
Therefore, when the Sales Dashboard menu is selected, Odoo loads the SalesDashboard component.
Creating the QWeb Template
The next step is to create the template that defines the dashboard layout.
static/src/xml/sales_dashboard.xml
<?xml version="1.0" encoding="UTF-8"?>
<templates xml:space="preserve">
    <t t-name="sales_dashboard.SalesDashboard">
        <div class="container-fluid p-4">
            <div class="mb-4">
                <h2>Sales Dashboard</h2>
                <p class="text-muted">
                    Overview of quotations and confirmed sales.
                </p>
            </div>
            <div class="row g-4">
                <div class="col-lg-4 col-md-6">
                    <div class="card shadow-sm p-4">
                        <h5>Total Quotations</h5>
                        <h2 t-esc="this.quotationCount()"/>
                    </div>
                </div>
                <div class="col-lg-4 col-md-6">
                    <div class="card shadow-sm p-4">
                        <h5>Confirmed Orders</h5>
                        <h2 t-esc="this.orderCount()"/>
                    </div>
                </div>
                <div class="col-lg-4 col-md-6">
                    <div class="card shadow-sm p-4">
                        <h5>Total Sales</h5>
                        <h2 t-esc="this.salesAmount()"/>
                    </div>
                </div>
            </div>
        </div>
    </t>
</templates>
The t-name defines the name of the QWeb template:
<t t-name="sales_dashboard.SalesDashboard">
This must match the template name specified in the JavaScript component:
SalesDashboard.template = "sales_dashboard.SalesDashboard";
The template contains three cards.
The first card displays the number of quotations:
<h5>Total Quotations</h5>
<h2 t-esc="this.quotationCount()"/>
The second displays the confirmed orders:
<h5>Confirmed Orders</h5>
<h2 t-esc="this.orderCount()"/>
The third displays the total sales:
<h5>Total Sales</h5>
<h2 t-esc="this.salesAmount()"/>
The third displays the total sales:
<h5>Total Sales</h5>
<h2 t-esc="this.salesAmount()"/>
Reading Signals in the QWeb Template
There is another important Odoo 20 detail here. Since quotationCount, orderCount, and salesAmount are signals, their values are read by calling them as functions.
For example:
t-esc="this.quotationCount()"
The this. is important because these values belong to the component instance.
The same pattern is used for the other values:
t-esc="this.orderCount()"
and:
t-esc="this.salesAmount()"
Therefore, the signal pattern used in this example is:
| Operation | Odoo 20 OWL 3 |
| Create | this.quotationCount = signal(0) |
| Update | this.quotationCount.set(value) |
| Read in JavaScript | this.quotationCount() |
| Read in QWeb | this.quotationCount() with this. |
This is useful to remember when converting an older dashboard example to Odoo 20.
Adding the Assets to the Manifest
The JavaScript and XML files need to be included in the module's asset bundle so that Odoo can load them in the backend.
Open the module's __manifest__.py file and add:
'assets': {
    'web.assets_backend': [
        'sales_dashboard/static/src/js/sales_dashboard.js',
        'sales_dashboard/static/src/xml/sales_dashboard.xml',
    ],
},
The web.assets_backend bundle loads the files required by the Odoo backend. The JavaScript file contains the OWL component, while the XML file contains the QWeb template.
The module structure will now look like this:
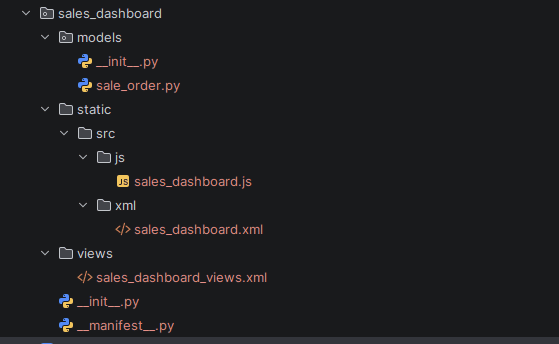
At this point, the dashboard structure is ready. The remaining part is to retrieve the actual Sales data.
Fetching Data Using the ORM Service
The dashboard gets its data from the sale.order model. In the OWL component, the ORM service is obtained using:
this.orm = useService("orm");The loadDashboardData() method then calls the Python method on the sale.order model:
const data = await this.orm.call(
    "sale.order",
    "get_dashboard_data",
    []
);
- sale.order is the model being called.
- get_dashboard_data is the Python method.
- [] contains the method arguments. In this example, no arguments are required.
The returned data is then assigned to the corresponding signals:
this.quotationCount.set(data.quotation_count);
this.orderCount.set(data.order_count);
this.salesAmount.set(data.sales_amount);
Now, we need to create the Python method that returns these values.
Getting Sales Data from Python
models/sale_order.py
from odoo import api, models

class SaleOrder(models.Model):
    _inherit = "sale.order"
    @api.model
    def get_dashboard_data(self):
        quotation_count = self.search_count([
            ("state", "in", ["draft", "sent"])
        ])
        order_count = self.search_count([
            ("state", "in", ["sale", "done"])
        ])
        orders = self.search([
            ("state", "in", ["sale", "done"])
        ])
        total_sales = sum(orders.mapped("amount_total"))
        return {
            "quotation_count": quotation_count,
            "order_count": order_count,
            "sales_amount": total_sales,
        }
The get_dashboard_data() method collects the three values required by the dashboard.
First, it counts quotations:
quotation_count = self.search_count([
    ("state", "in", ["draft", "sent"])
])
This searches for sales orders in the draft and sent states. Next, it counts confirmed sales orders:
order_count = self.search_count([
    ("state", "in", ["sale", "done"])
])
The sale and done states are used for the confirmed orders in this example. The sales orders are then retrieved:
orders = self.search([
    ("state", "in", ["sale", "done"])
])
The total amount is calculated from those records:
total_sales = sum(orders.mapped("amount_total"))Finally, the values are returned as a dictionary:
return {
    "quotation_count": quotation_count,
    "order_count": order_count,
    "sales_amount": total_sales,
}
The JavaScript component receives this dictionary and updates the three signals.
Viewing the Sales Dashboard
After upgrading the module, open the Sales application. The new Sales Dashboard menu will be available under the Sales application. The dashboard will contain three cards:
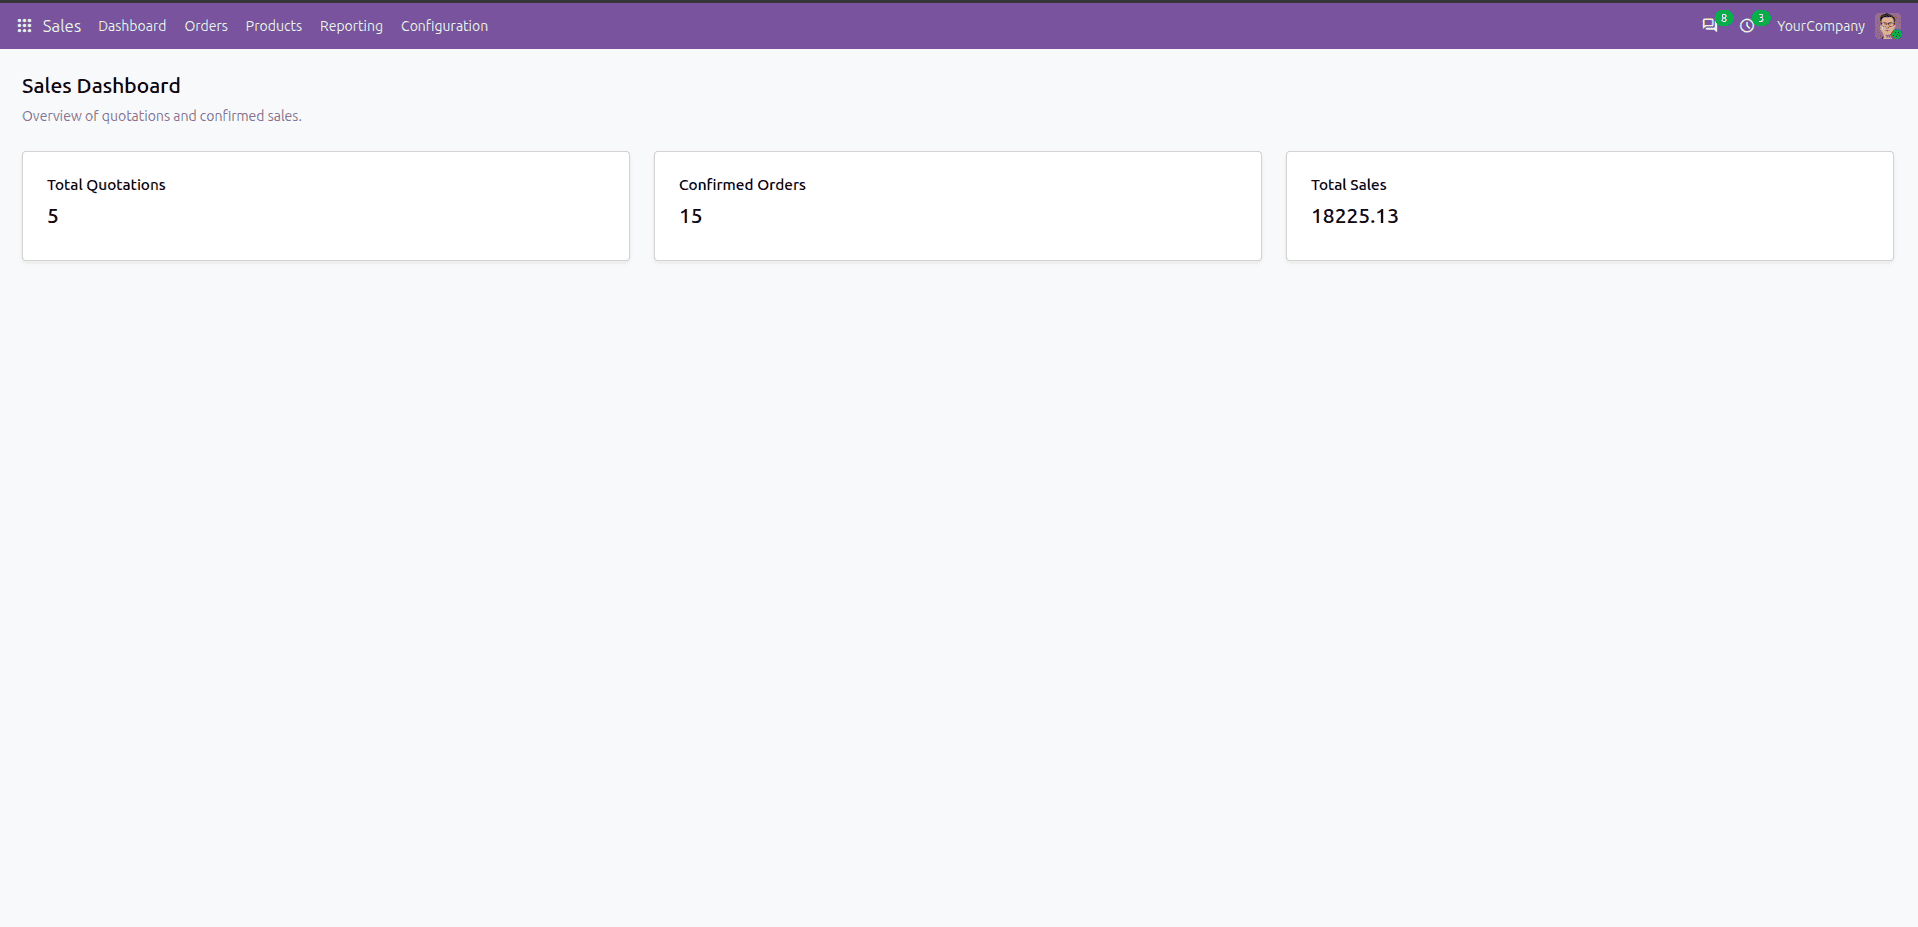
The actual numbers will depend on the sales records available in the database.
When the dashboard is opened, the OWL component calls get_dashboard_data() through the ORM service. The Python method retrieves the required information, and the returned values are assigned to the signals. Since the values are reactive, updating the signals causes the corresponding parts of the dashboard to update.
Creating a custom dashboard in Odoo 20 involves connecting several parts of the Odoo web framework. A client action opens the dashboard, an OWL component handles its logic, and a QWeb template defines how the information is displayed. In this example, we created a Sales Dashboard with three simple values: total quotations, confirmed orders, and total sales. The values are retrieved from the sale.order model using the ORM service and displayed through an OWL component.
When working with Odoo 20, it is also important to consider the changes introduced with OWL 3. Instead of relying on the older useState() pattern, the example uses signal() for reactive values. The signals are updated using .set() and read by calling the signal as a function, such as this.quotationCount(). Once this basic structure is understood, the same approach can be used to create dashboards for other Odoo applications. Additional cards, charts, filters, buttons, and other interactive elements can be added depending on the business requirement.
To read more about How to Create Dashboard or QWeb Views in Odoo 19, refer to our blog How to Create Dashboard or QWeb Views in Odoo 19.