Odoo is enterprise resource management software that is beneficial for all kinds of business domains. This is simply amazing because it covers all business requirements such as sale, purchase, billing, accounting, manufacturing, warehouse, project management, etc… in a single software. Also, they are integrated into each other.
All data of the Odoo programs are stored as objects. Views are defined to expose these objects to the user. Odoo uses a dynamic user interface, which means it is not statically built by some codes, it is dynamically built from XML descriptions. And these screen descriptions are called views.
In Odoo, views define the way by which the models/objects displayed to the user-end. Views is of several types, each view represents a mode of visualization. They make the modules more user-friendly and can vary according to the need. In Odoo we use several types of views such as tree, form, search, calendar, graph, pivot, Kanab, etc. As the name suggests each kind of view is different, the ‘tree’ view provides the list view of objects, the ‘Form’ view displays a single object, the ‘Search’ view helps to filter the objects, etc.
Here we are going to discuss mainly
- Calendar View
- Graph View
- Pivot View
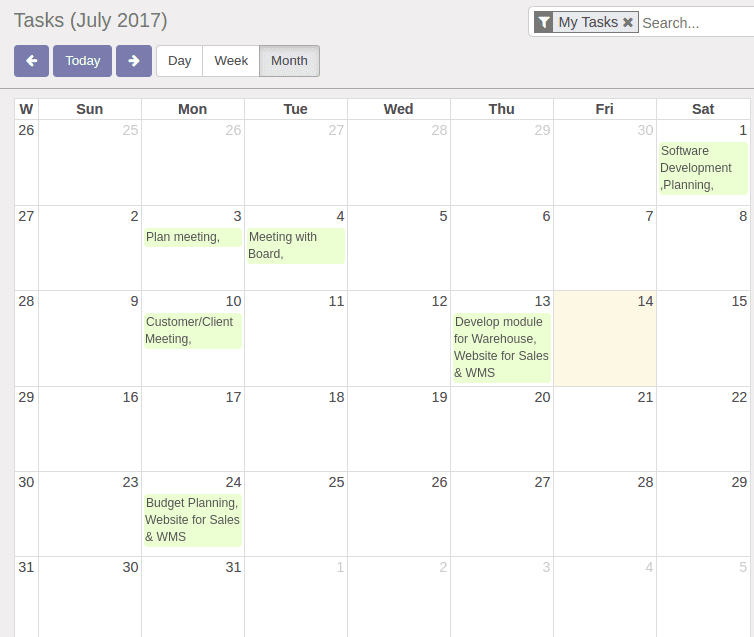
Calendar View:
As the name indicates, this view type represents the records in a calendar type. Therefore it can be viewed as month, week, or days. In application part, this view more implemented to set appointments, schedule day, To-do etc… Calendar view provides timeline/schedule view for the data.
<record id="view_task_calendar" model="ir.ui.view">
   <field name="name">project.task.calendar</field>
   <field name="model">project.task</field>
   <field eval="2" name="priority"/>
   <field name="arch" type="xml">
       <calendar color="user_id" date_start="date_deadline" string="Tasks" mode="month">
           <field name="name"/>
           <field name="project_id"/>
       </calendar>
   </field>
</record>
string
The title string for the view.
date_start
It is a datetime field to specify the starting date for the calendar item. This attribute is required.
date_stop
A datetime field to specify the end date. Ignored, if date_delay attribute is specified.
date_delay
A numeric field to specify the time in hours for a record. This attribute will get preference over date_stop and date_stop will be ignored.
day_length
An integer value to specify working day length. The default is 8 hours.
color
A field, generally many2one, to colorize calendar/gantt items.
mode
A string value to set default view/zoom mode. For calendar view, this can be one of following (default is a month):
- Day
- Week
- Month
Mode: Month
Mode: week
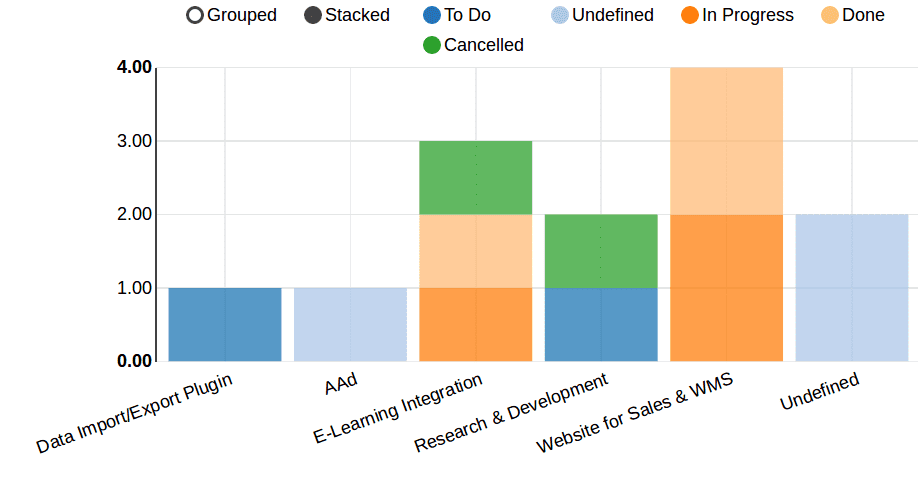
Graph View:
Graph views provide a graphical view of the data, in the form of Bar chart, Pie chart, and Line chart. The graph view is an aggregation of all the records in a model, which is generally visualized in bar, pie, and line. The default type of the graph is a pie chart - to change it to a bar chart, we need to specify the type. You also may change the orientation. The first field is the X-axis. The second one is the Y-axis and the optional third one is the Z-axis for 3-dimensional graphs.
<record id="view_project_task_graph" model="ir.ui.view">
   <field name="name">project.task.graph</field>
   <field name="model">project.task</field>
   <field name="arch" type="xml">
       <graph string="Project Tasks">
           <field name="project_id"/>
           <field name="stage_id"/>
       </graph>
   </field>
</record>
types
Bar(default)
Pie: Circular Representation
Line: Linear Representation
interval
‘interval’ is meaningful for date fields, and is the time interval used to group time data by ‘day’, ‘week’, ‘month’, ‘quarter’, or ‘year’
name
‘name’ is always required, it is the name of the fields used for graphing. It is used more likely used for grouping rather than aggregating.
Type: Bar
Type: Line
Pivot View:
In the Pivot view, data can be represented as tables, a dynamic analysis matrix. Pivot tables were already available in version 8.0, but from 9.0 onwards, they moved into their own view type. Along with this, it improved the UI features of Pivot tables and optimized the retrieval of pivot table data greatly.
<record id="view_project_task_pivot" model="ir.ui.view">
   <field name="name">project.task.pivot</field>
   <field name="model">project.task</field>
   <field name="arch" type="xml">
       <pivot string="Project Tasks">
           <field name="project_id" type="row"/>
           <field name="stage_id" type="col"/>
       </pivot>
   </field>
</record>
Type
row (default): Groups the row by the specified field. In pivot view, each group gets its own row.
col: Creates column-wise groups
Pivot view repeatedly generates table dynamically, while changing the field or row or column. The user can select the row and column field to represent the table. Each time when a user changes the fields, it calls corresponding SQL queries and produces tables accordingly. So Pivot tables are called as dynamic analysis matrix.
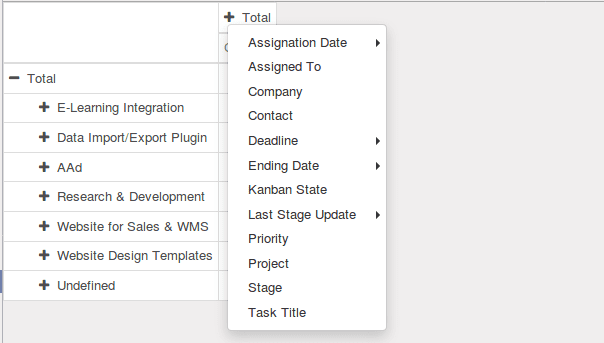
Here, by clicking ‘+’ we can add a user-specific field in the column, similarly at the row side. Then pivot view will generate the table based on that field. The following table with rows as project and columns as Assignation date > Day. Each time user can make his own customized tables.
Window Action:
We need to define these views in action in order to view them. In Odoo action renders all the views such as form, tree, pivot, graph, calendar, etc.
<record id="action_view_task" model="ir.actions.act_window">
   <field name="name">Tasks</field>
   <field name="res_model">project.task</field>
   <field name="view_mode">kanban,tree,form,calendar,pivot,graph</field>
   <field name="context">{'search_default_my_tasks': 1}</field>
   <field name="search_view_id" ref="view_task_search_form"/>
</record>
view_mode
A comma-separated list of view types (Kanban, tree, and form) as a string. All of these types will be present in the generated views list. By clicking on the below-shown buttons, we can easily get different view types of the same objects.