If you are looking for agile and flexible management of your business projects, it is advised that you opt for Odoo Project Management module. The project module offers a different set of functionalities that a business company desires, for effective task management. The application helps the end user to be on wheels, helping with timely monitoring of the progressions and evading of the misfortunes.
If one needs to setup a solitary project/task under a specific deadline, there is no worry. The forecasting feature in Odoo Project Management helps in setting projects under a specific deadline. One can seamlessly schedule their tasks under forecasting and the feature helps with analyzing or estimating the time needed for each task by different employees.
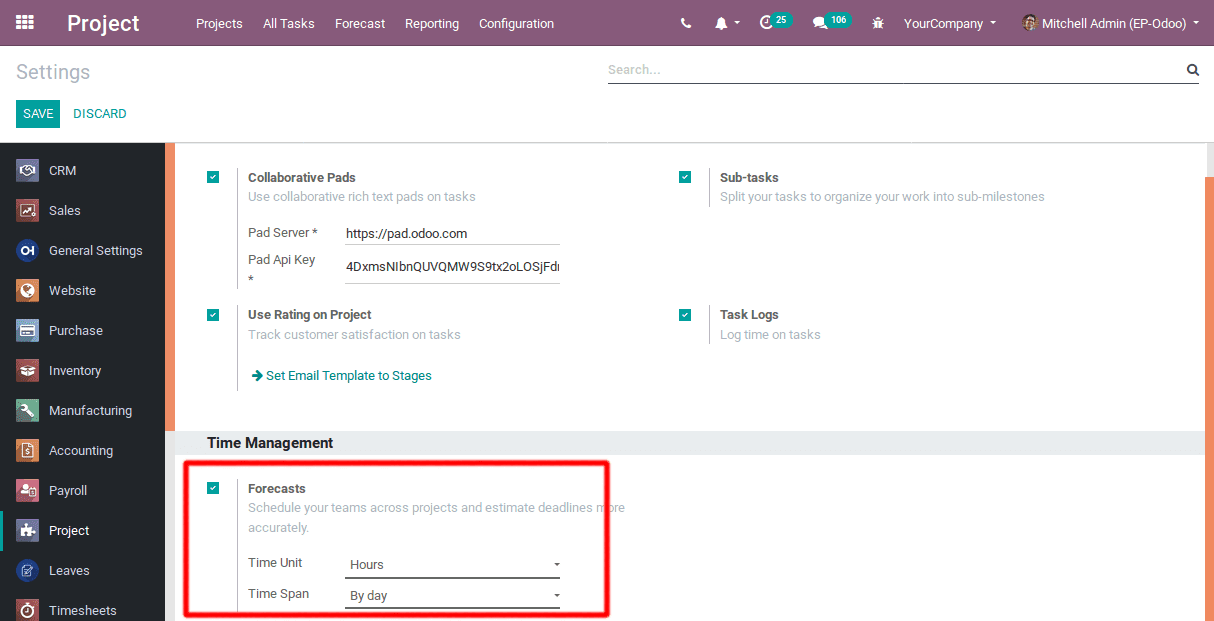
In order to activate the forecast option, one must go to the General Settings in Odoo.
Go to Project -> Configuration -> Settings, tick the Forecasts option and Save the changes.

Create a project:
While creating a new project, one must select the “Allow forecast” option. The action triggers Forecast option and the end user can see the forecast button at the top menu.
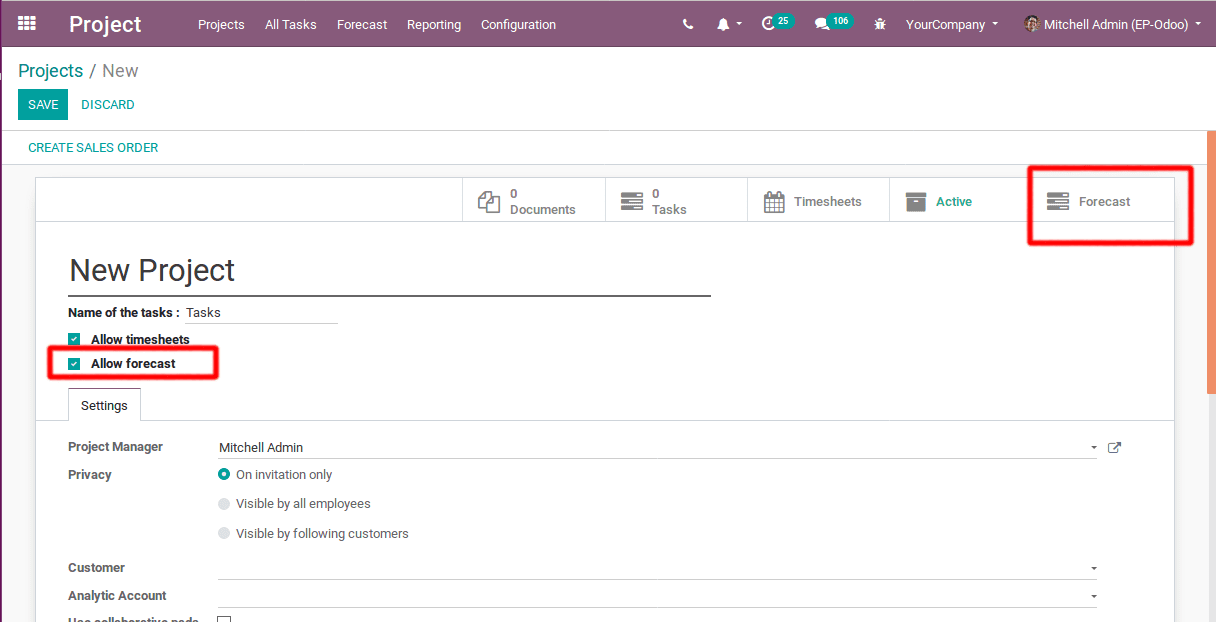
Later, one can create new tasks under the project and can also forecast these tasks by clicking on the Forecast option listed in the menu on top.
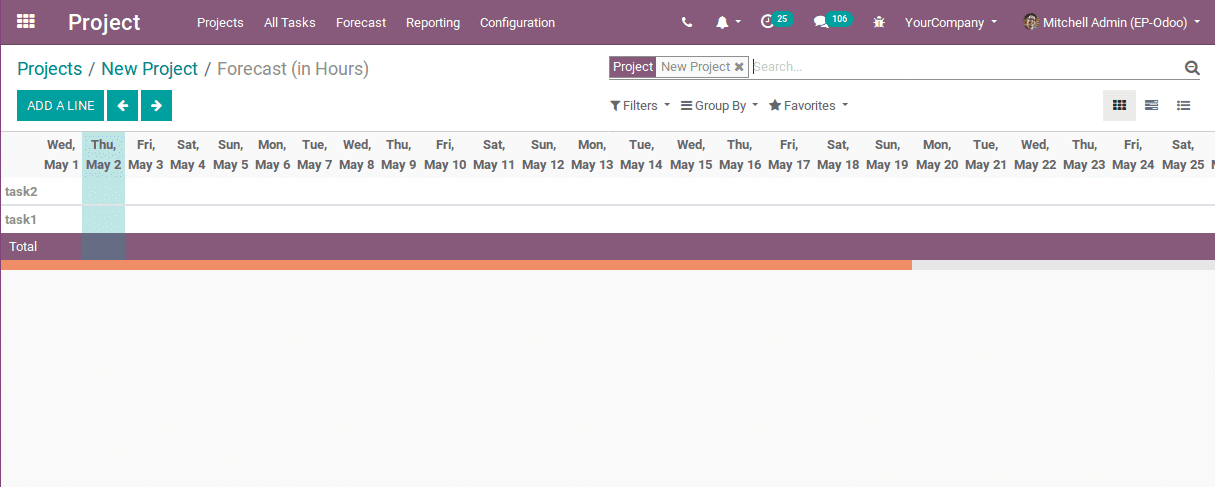
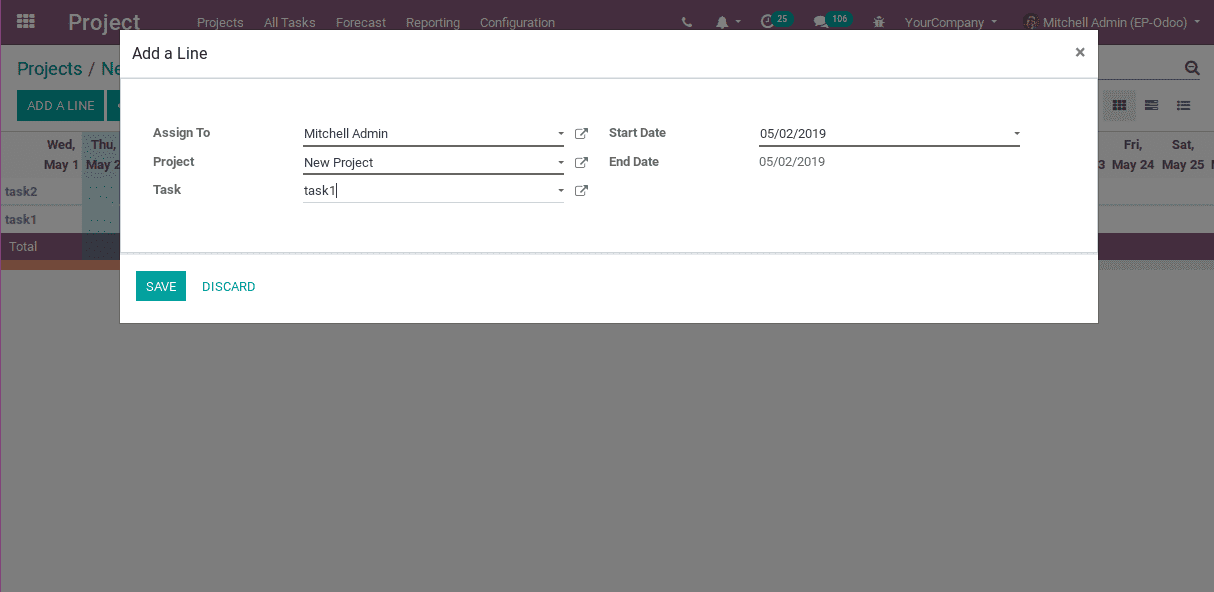
In order to forecast the tasks, click on the button ADD A LINE. Here, one can add the desired attributes in the creation form.
The line provisions to give forecast hours for each day. One can also set forecast dependent on weeks and months. From the configuration -> settings, one can set the forecast option.
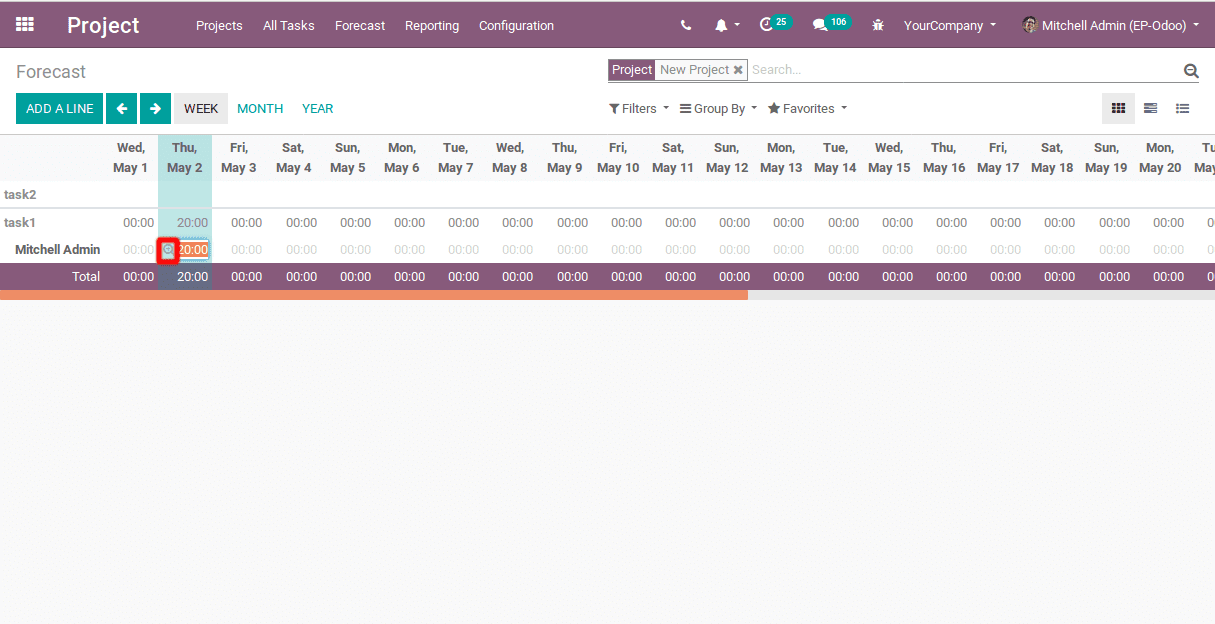
Upon clicking on the plus button, one can see all records aggregated in the particular cell. From these records, one can seamlessly manage the task forecasting.
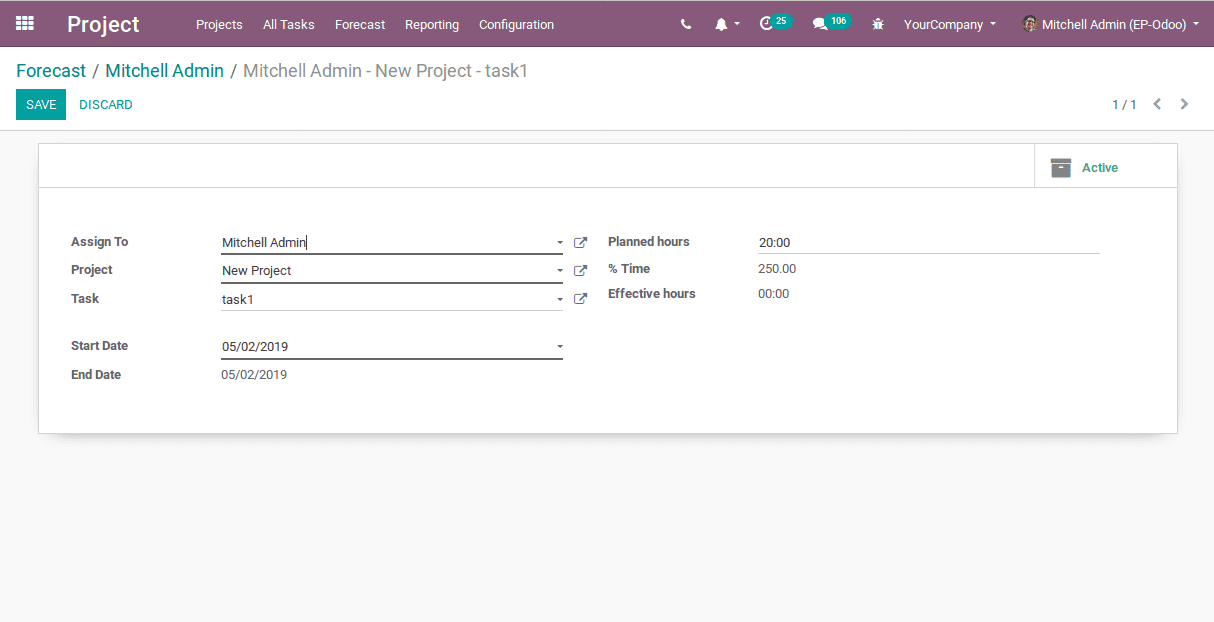
Planned hours means the forecasted hours of the task. Effective hours are related to the timesheet and whenever an employee adds his/her working hours or timesheet for this particular task, it will display ineffective hours. %Time is the percentage of working time.
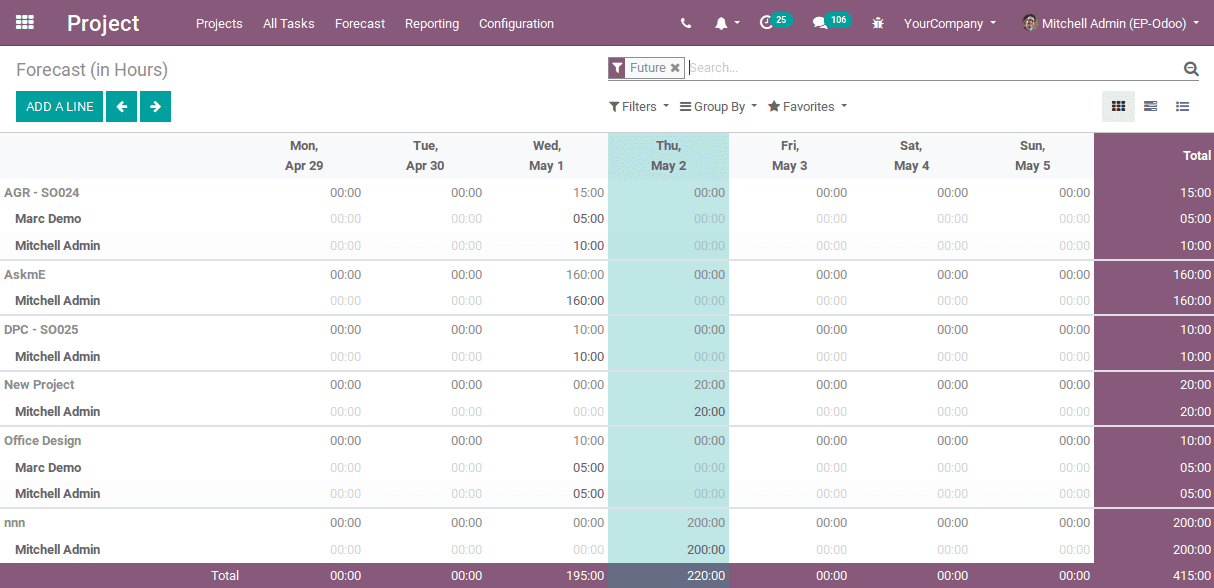
One can see the project forecasts at a different point of view:
For that go to Project -> Forecast, there will be two options: By Employee and By Project.
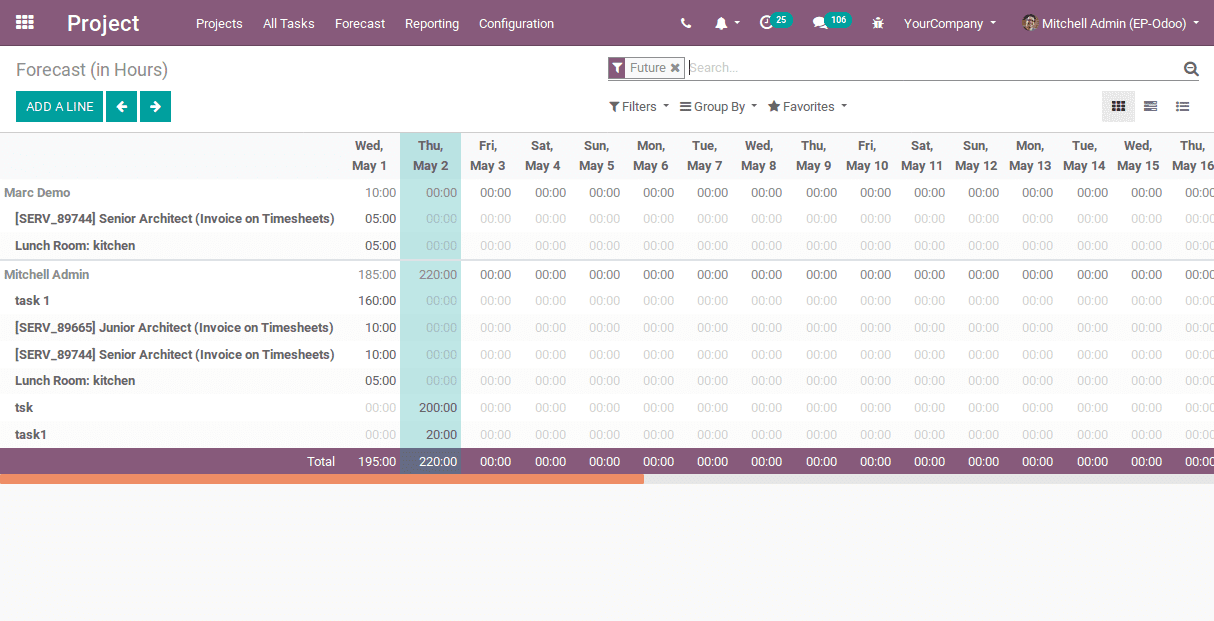
By Employee
Under the option, one can see different employees and their consecutive planned working hours. And this information can be easily filtered and viewed under different categories like Week, Month or Year. However, one can’t directly see the project related to an employee, but can see the details via clicking the plus button provided on cells.
By Project
Under the option, one can view different projects and their planned hours. Again the information can be filtered on the basis of Week, Month and Year. One can view the details by clicking on the plus button provided on cells.
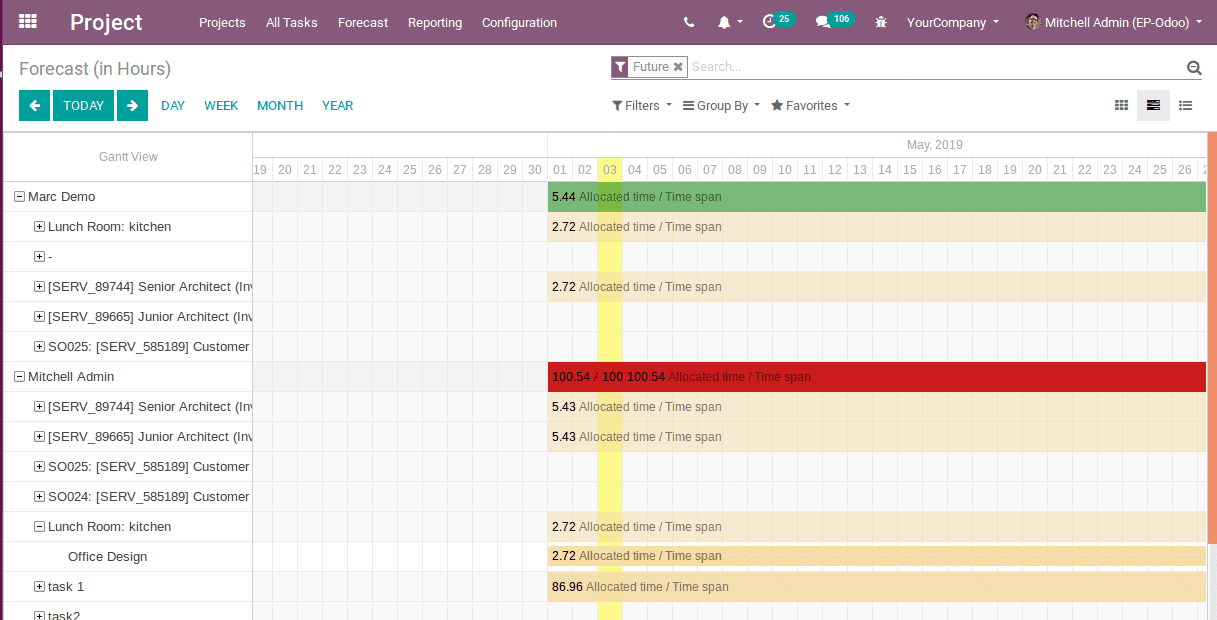
Gantt View
Gantt View is a view in which a series of rectangles shows the %Time of the projects. It simply gives a big picture of the project. Gantt view is also used in two views: By Employee and By Project.
By Employee
This will display the Gantt chart along with assigned people. On the left side, the first level, one can see which all users are involved. Following, on the second level, one can view which tasks are assigned to whom. Moving on to the third level, one can view which projects are running. Each project is represented by a rectangle and it shows the % Time of the project. One can view them in different timelines such as year, month, week, or day- wise.
Each task is represented by a colored rectangle. The top rectangle on the first level displays the sum of all the projects compiled from the third level. If the rectangle turns green, it denotes that the total time allocated to that user is less than 100%. While it turns red, it denotes that this user is assigned with multiple tasks, which totaled to more than 100% of his/her time.
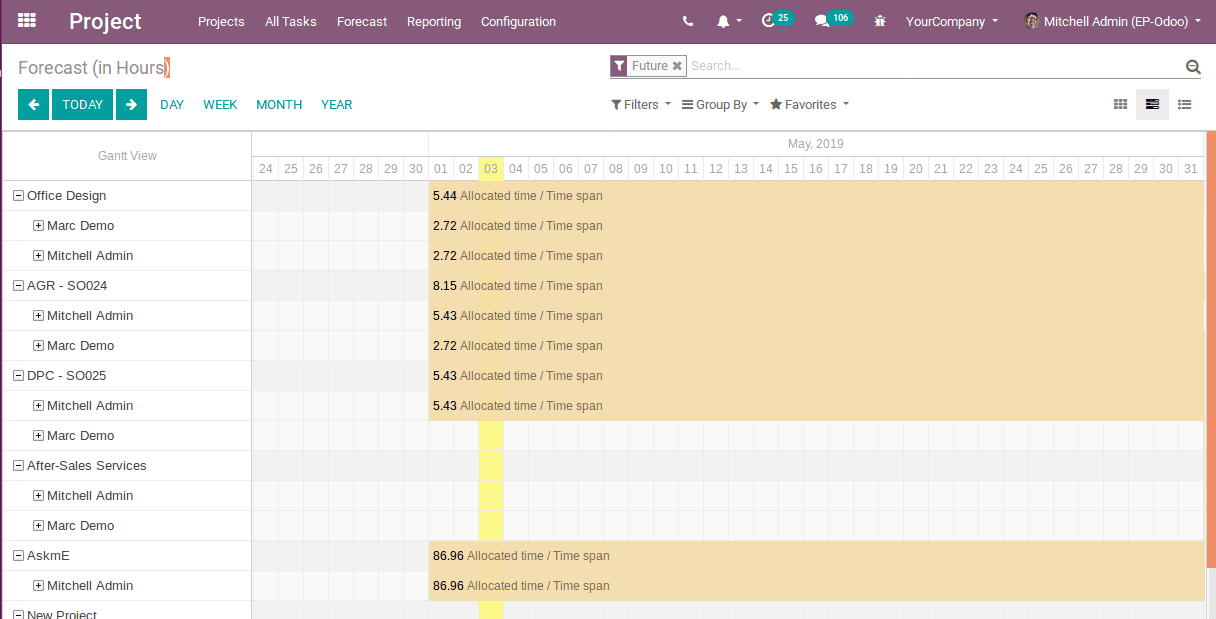
By Project
This displays the Gantt chart by showing the projects. The project and their %Time can be seen under different timelines like Week, Month, Year or Daily.
On the left side, at the first level, one can see the projects. Moving on to the second level, one can see which users are assigned. And finally on the third level, one can see which tasks they're on.
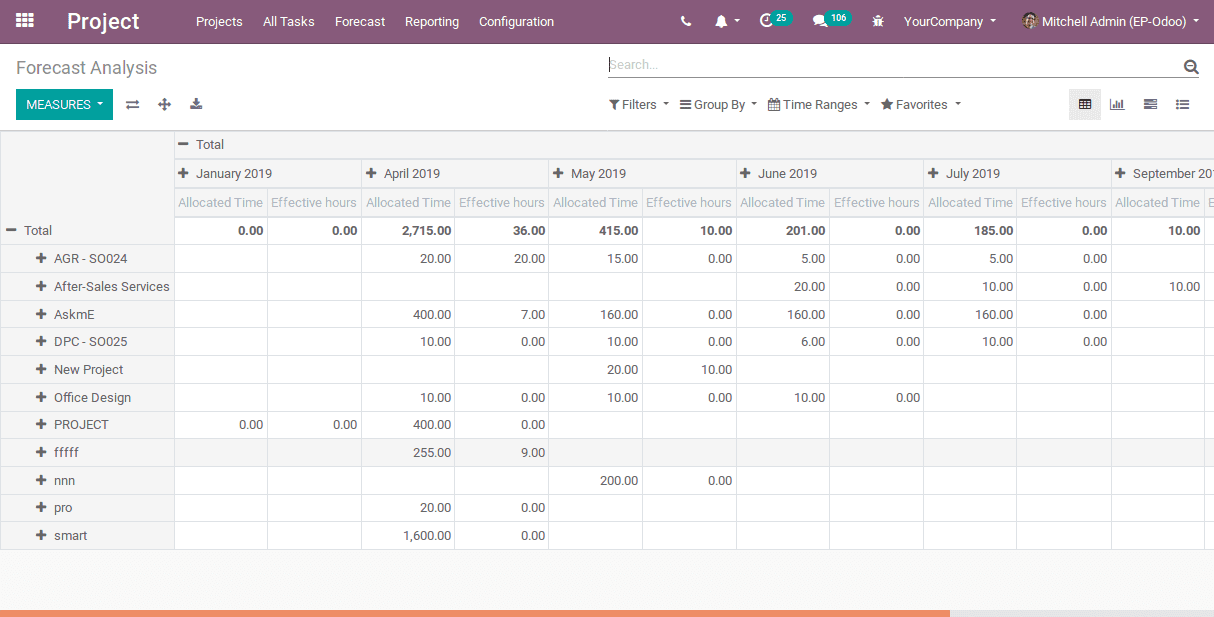
Forecast Analysis:
Forecast analysis is actually a comparison of the allocated time and effective hours. Allocated time is the forecasted time of the project and effective hours are related to the timesheet. One can analyze the allocated time and effective hours using different measures.