As teams collaborate on complex tasks and tight deadlines, project managers must ensure that every task is progressing in alignment with the overall schedule. This is where visual project tracking tools become indispensable, tools that not only provide raw data but also offer intuitive and real-time insights into how a project is performing. One such invaluable tool is the Burndown Chart.
In Odoo 18, the Burndown Chart feature is seamlessly integrated into the Project module, giving users a clear and immediate picture of their project’s progress. Whether you are managing internal tasks or working with external teams, the chart enables you to visually monitor task completion, compare it against your planned timeline, and quickly identify areas of concern.
In this blog, we’ll take a closer look at how the Burndown Chart in Odoo 18 works, how to access it, and why it's an essential tool for teams looking to improve their time management and project delivery.
What is a Burndown Chart?
A Burndown Chart is a graphical representation that shows the amount of work remaining versus time. It is commonly used in agile project management to predict when a project will be completed based on current progress. In the chart, the vertical axis typically represents the remaining work, usually in the form of tasks or story points, while the horizontal axis represents time, broken down into days, weeks, or months.
The essence of a Burndown Chart is its simplicity. At a glance, it tells you whether you are ahead of schedule, on track, or falling behind. It eliminates the need for lengthy status meetings or complex calculations and provides every stakeholder, be it a team member, project manager, or client, with a clear visual of project health. If the line on the chart descends steeply, it indicates rapid task completion; if it flattens, it suggests delays or stagnation.
Burndown Chart in Odoo 18 Project Module
Odoo 18 has significantly improved its Project module to offer more robust project visualization tools, one of which is the Burndown Chart. This feature allows you to assess your team’s productivity over time and make informed decisions based on visual performance indicators.
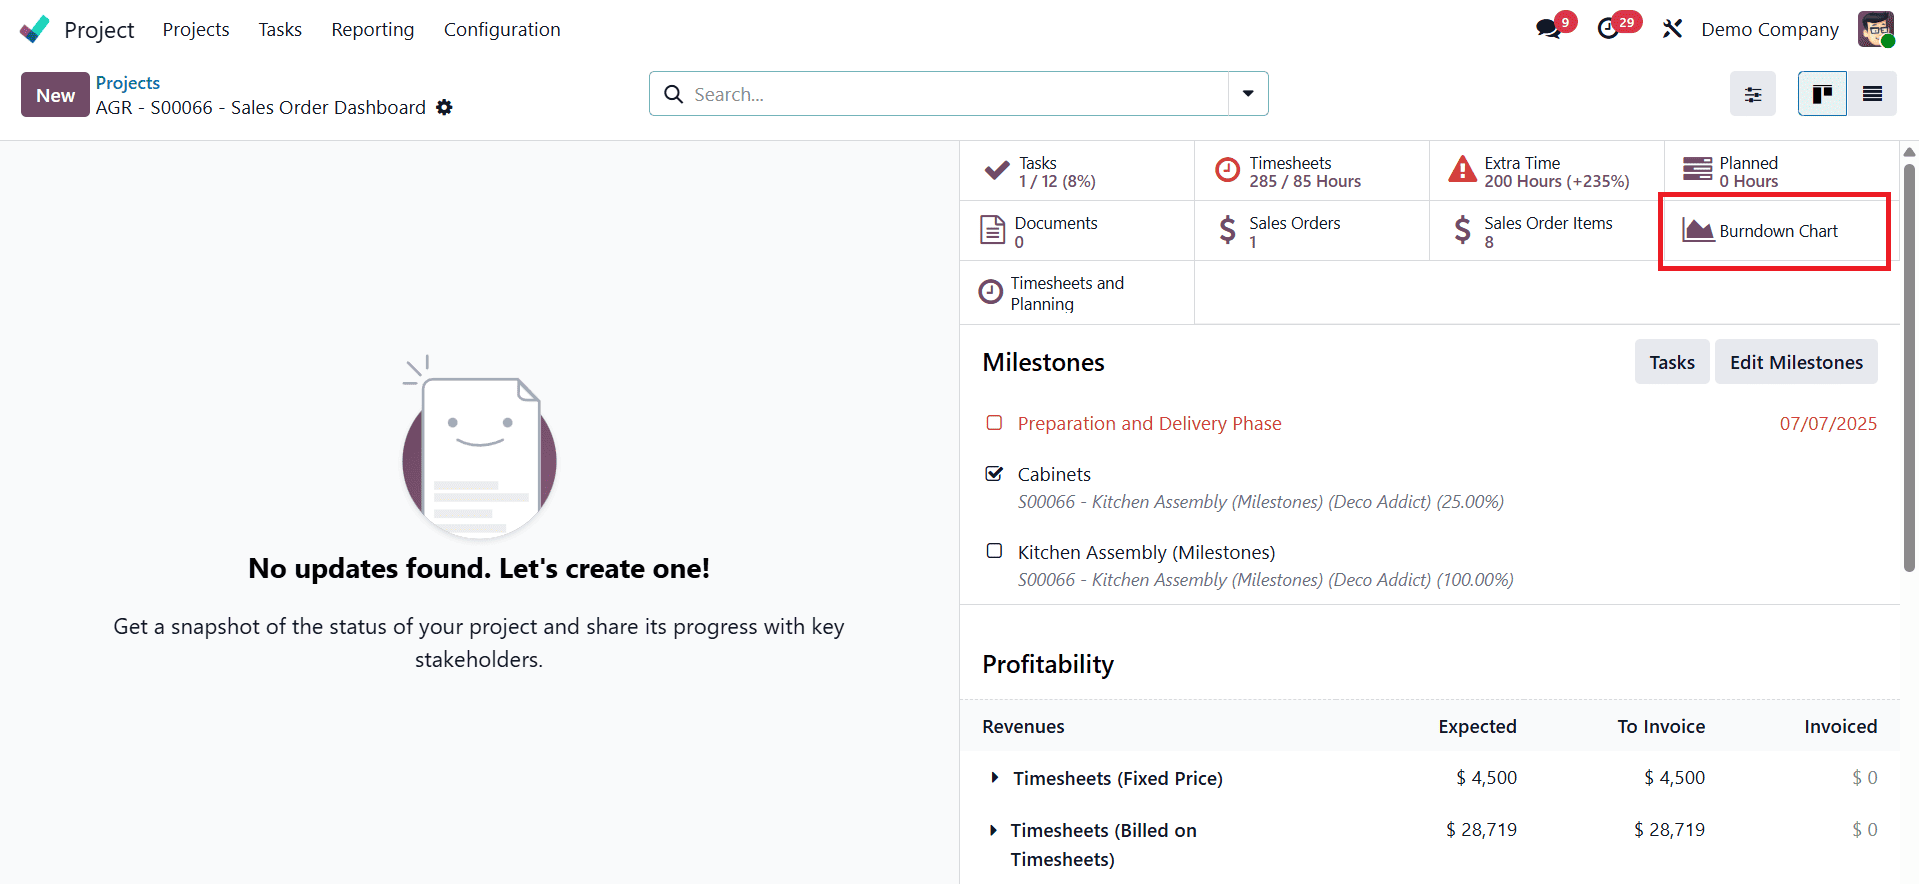
To access the Burndown Chart in Odoo 18, begin by navigating to the Project module and opening the project for which you want to track progress. On the top-right section of the project dashboard, you’ll find a set of smart buttons. Click on the Burndown Chart smart button to open the chart.
Alternatively, you can directly access the Burndown Chart by clicking on the three vertical dots located at the top-right corner of the specific project page.
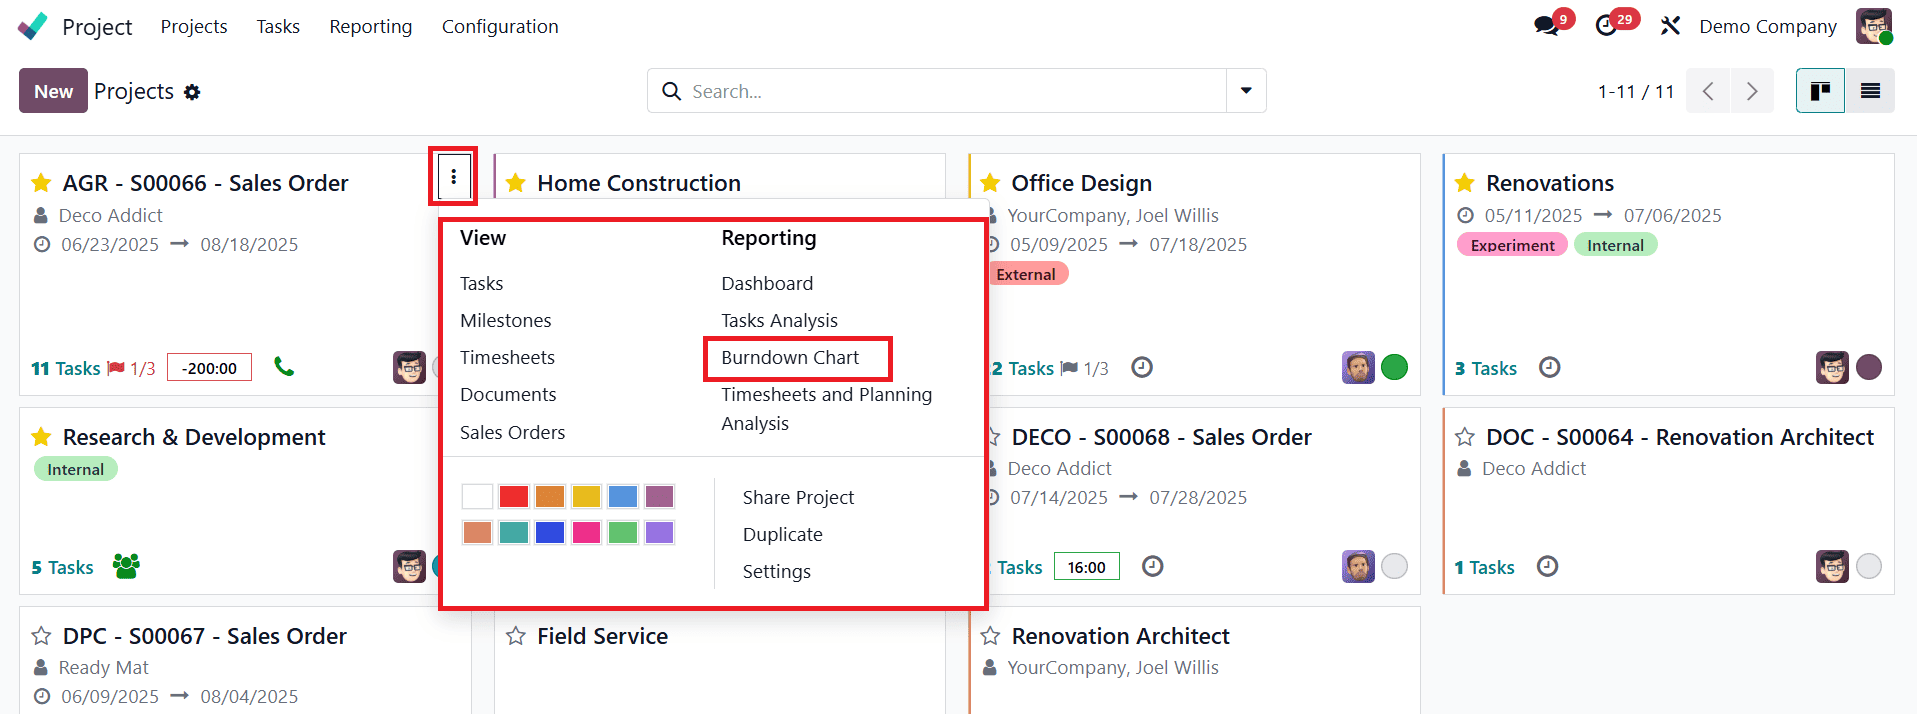
When you click this icon, a drop-down menu appears with a list of available options related to the project. From this list, you can simply select "Burndown Chart" to instantly view the graphical report of your project’s progress. This provides a convenient and immediate way to access performance insights without navigating away from the current project interface. As shown in the image, this method ensures that you can monitor your task completion trends and overall project timeline with just a few clicks.
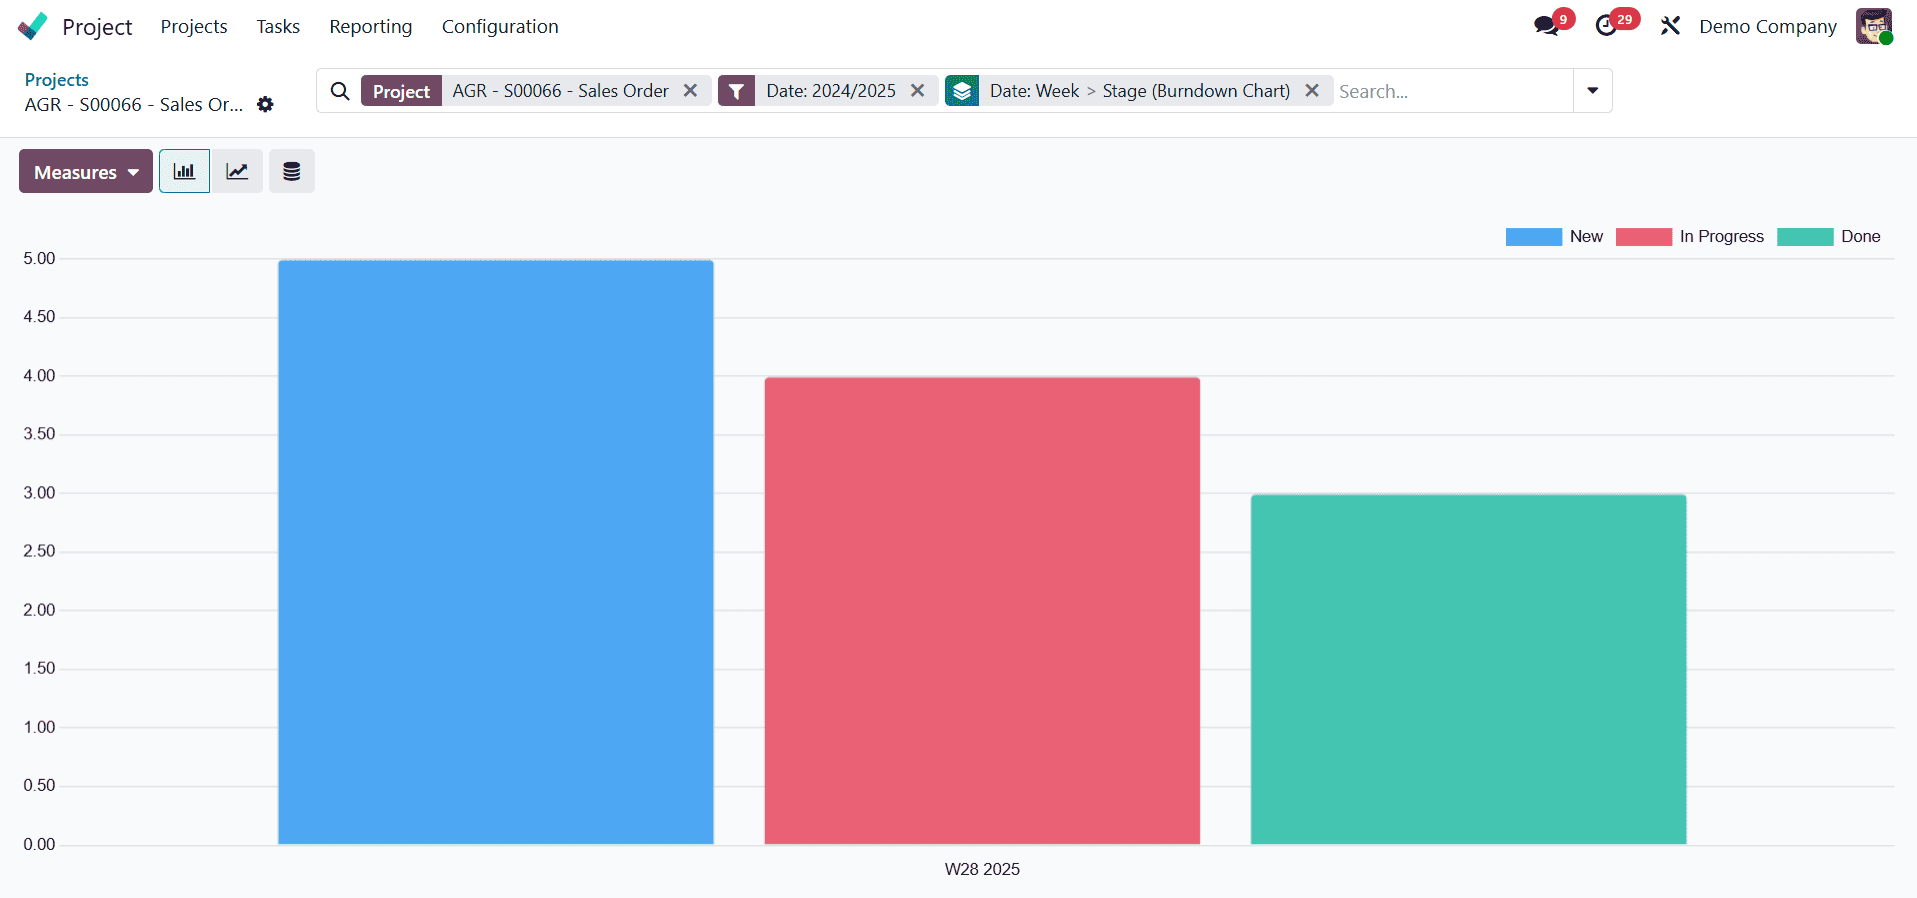
This chart provides a color-coded visualization of the project’s stages, where each color represents a specific phase of the project. Completed tasks are clearly marked, making it easy to see how many tasks were finished each month and how progress aligns with your initial timeline.
Real-Time Progress Tracking and Team Alignment
One of the major advantages of using the Burndown Chart in Odoo 18 is that it gives instant clarity. Without delving into complex reports or numerical analysis, you can immediately see how your project is performing. This enables quick decision-making and realignment if necessary.
For instance, if you notice the burn rate is slower than expected, it might signal a delay in a particular task or stage. Conversely, a faster-than-expected burn rate could indicate strong performance or over-commitment of resources. The visual nature of the chart ensures that all team members share the same understanding of the project's current status. It fosters transparency and helps everyone stay accountable and motivated.
Easy Forecasting and Time Management
Besides being a performance-tracking tool, the Burndown Chart is also highly effective for forecasting project completion. By observing the trend of completed tasks over time, you can predict whether the remaining work will be completed within the deadline. This makes the chart an invaluable tool for managing client expectations, adjusting workloads, and refining project schedules.
The Burndown Chart in Odoo 18 is also one of the most affordable and accessible time management tools, as it requires no external software or integrations. It is integrated directly into the Odoo Project module, offering seamless tracking and reporting within the same ecosystem.
Promoting Transparency and Collaboration
Another benefit of using the Burndown Chart is the shared visibility it creates among all stakeholders. When everyone, from developers to team leads to clients, can see the same real-time project status, communication becomes clearer and more effective. It also empowers individual contributors to gauge their pace and adjust accordingly, knowing whether the team is ahead of schedule or needs to pick up the pace.
The Burndown Chart in Odoo 18 Project module is an essential tool for teams aiming to maintain clarity, improve efficiency, and deliver projects on time. By providing a straightforward visual of how much work remains versus the available time, it becomes easier to track progress, identify delays, and optimize resource allocation. Its integration into the Odoo ecosystem means you can manage, monitor, and forecast your projects without switching between tools. Whether you're a seasoned project manager or just beginning to explore agile project methodologies, Odoo 18’s Burndown Chart offers a smart, simple, and scalable solution for performance tracking.
To read more about How to Determine Profitability using Odoo 18 Project, refer to our blog How to Determine Profitability using Odoo 18 Project.