Code profiling is a technique used to analyze the behavior of a
program during execution. It focuses on evaluating various
performance aspects such as execution time, function call frequency,
code complexity, and memory usage. This is typically done with the
help of a profiler—a specialized tool designed to examine how
efficiently code runs. Profiling can be carried out on either the
source code or compiled binaries to assess performance.
Profilers provide valuable insights into how a program behaves across
different environments. They help developers identify inefficient
sections of code that may be affecting performance, enabling
targeted optimizations. As a result, profiling is an essential
process for detecting and resolving performance bottlenecks.
Types of Profilers
There are two main types of profilers used in development:
1. Server-Side Profilers:
These tools track metrics related to server operations, such as the
duration and failure rate of web transactions. They can monitor
performance down to individual lines of code, helping diagnose
issues in real-time applications.
2. Desktop Profilers:
These focus primarily on memory consumption and garbage collection.
They are useful for analyzing how effectively a program manages
system memory, particularly in local or standalone applications.
Server-side profilers primarily focus on tracking transaction
durations and identifying failures. In contrast, desktop profilers
are generally used to monitor memory consumption, detect memory
leaks, and manage garbage collection.
Graphing a Method in Odoo:
Odoo features an internal profiling tool that can visualize various
performance metrics, including function calls, execution durations,
and memory usage. To profile a specific function, you can embed a
profiling snippet directly within that function to collect and graph
relevant data.
from odoo.tools.misc import profile
[...]
@profile('/path/prof.profile')
def mymethod(...)
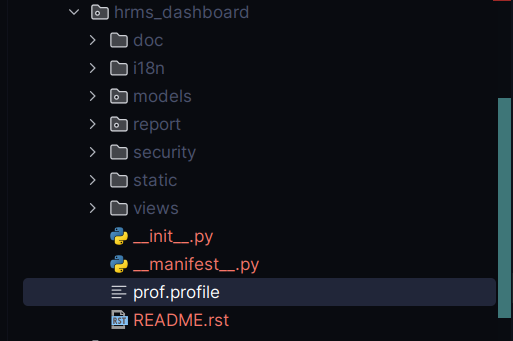
The @profile('/path/prof.profile') decorator should include the full
path where you want the profiling data to be saved. This will
generate a file named prof.profile at the specified location,
containing detailed performance statistics for the profiled
function.
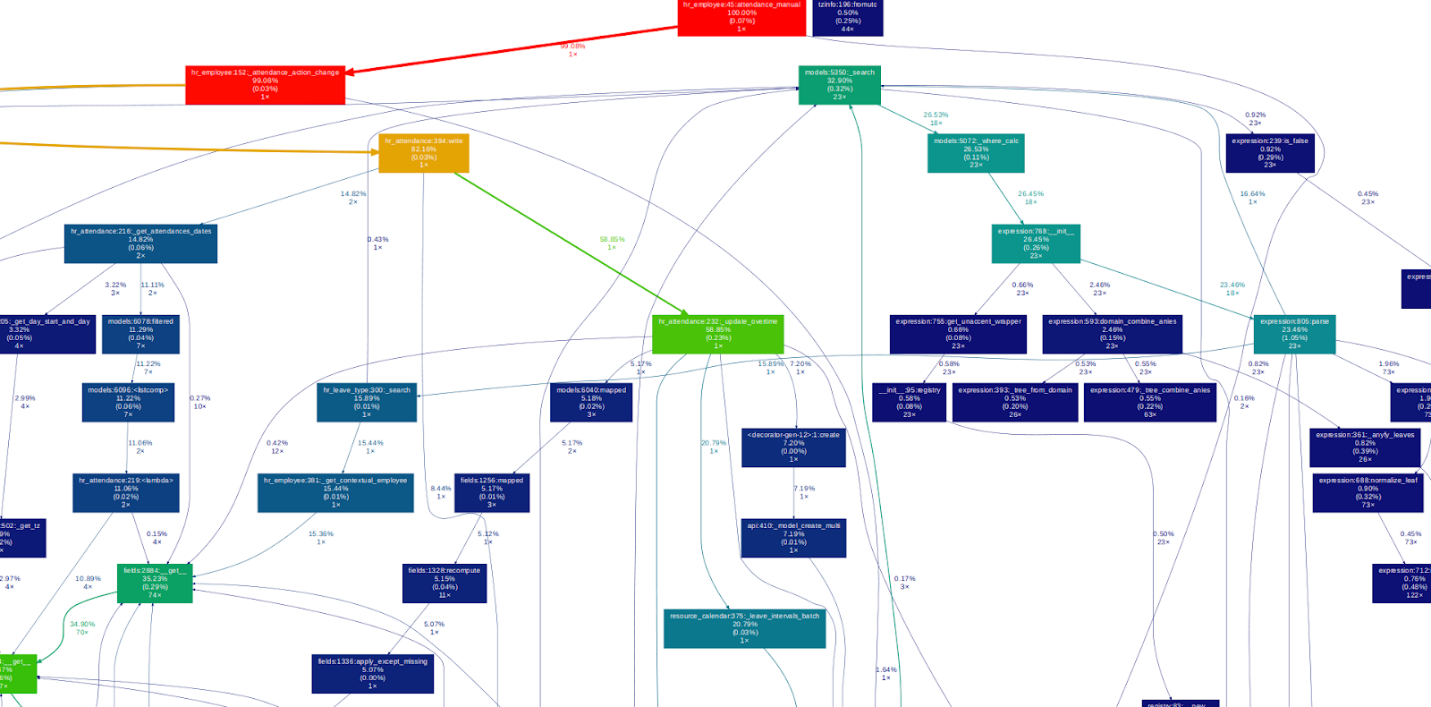
You can use the gprof2dot tool to convert the profiling results into
a visual graph that illustrates the function call hierarchy and
performance data.
gprof2dot -f pstats -o /path/prof.xdot /path/prof.profile
Run the following command in your terminal, making sure to replace
"/path/prof.profile" and "/path/prof.xdot" with your actual file
paths.
To visualize the resulting graph, use the xdot viewer with this
command
xdot /path/prof.xdot
To visualize the profiling data, the xdot tool is used. It displays
the analysis in a structured, interactive graph format, making it
easier to understand function call relationships and performance
bottlenecks.
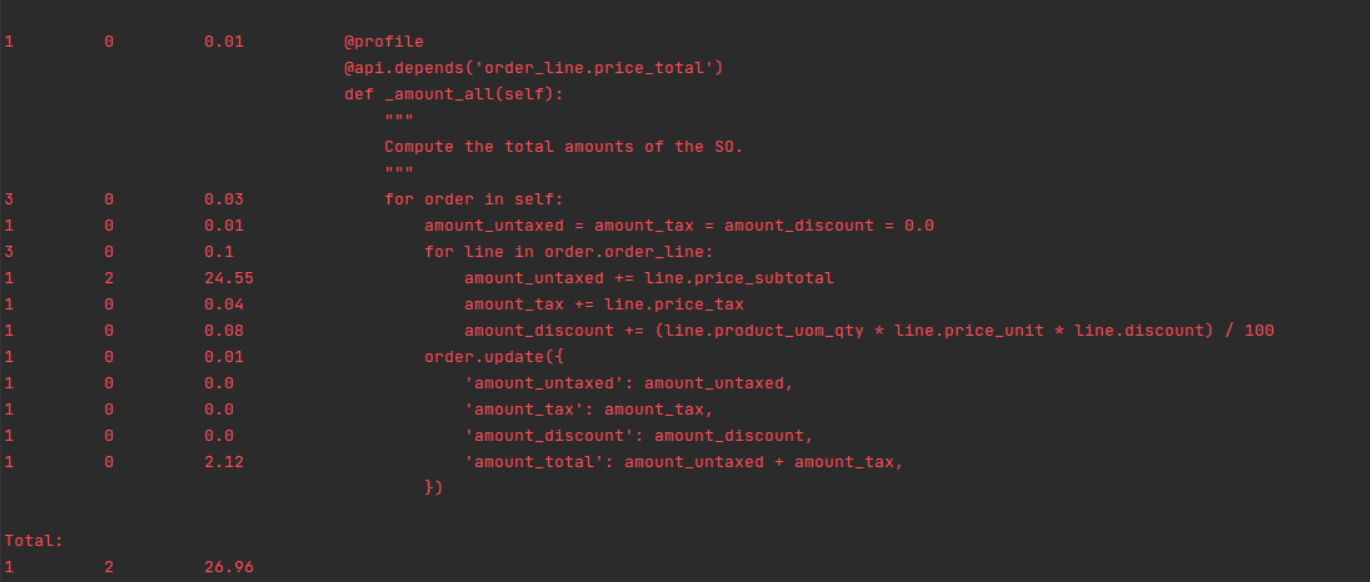
Logging a Method
To collect statistical performance data for a specific method using
an alternative profiler, you can insert the following code snippet
into the method. This approach captures detailed runtime statistics
without generating a graphical output:
from odoo.tools.profiler import profile
[...]
@profile
@api.model
def mymethod(...):
Once the target method has been fully executed, the profiler will
generate and display performance statistics in the logs. These
statistics include metrics such as the number of function calls,
total execution time, time per call, and cumulative time, helping
you identify bottlenecks and optimize performance.
Tracing Code Execution
A useful tool for analyzing slow or underperforming processes is
Pyflame. It works by sampling Python programs and generating
profiling data. To get started, you'll need to install both
Pyflame and Flamegraph.
The Flamegraph tool transforms the profiling data into a
visual format that clearly shows the call stack. In simple terms, a
flame graph provides an intuitive, layered view of which functions
consume the most time, making it easier to pinpoint performance
issues.
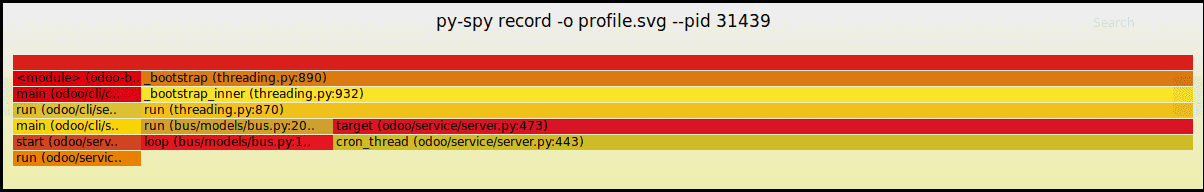
pip3 install py-spy
py-spy passively profiles Python processes by frequently
sampling stack traces, helping identify performance bottlenecks
without code changes or restarts.
sudo env "PATH=$PATH" py-spy record -o profile.svg --pid
Replace with the actual Process ID of the running Odoo process
you want to profile.