The Cohort View in Odoo is a specialized analytical tool that helps
track time-based performance or activity trends. It's particularly
useful for understanding user retention, patient follow-up, lead
nurturing, and any process that evolves over time. In Odoo 18, the
cohort view remains a powerful visualization option, now with
improved visual clarity and smoother transitions in the UI.
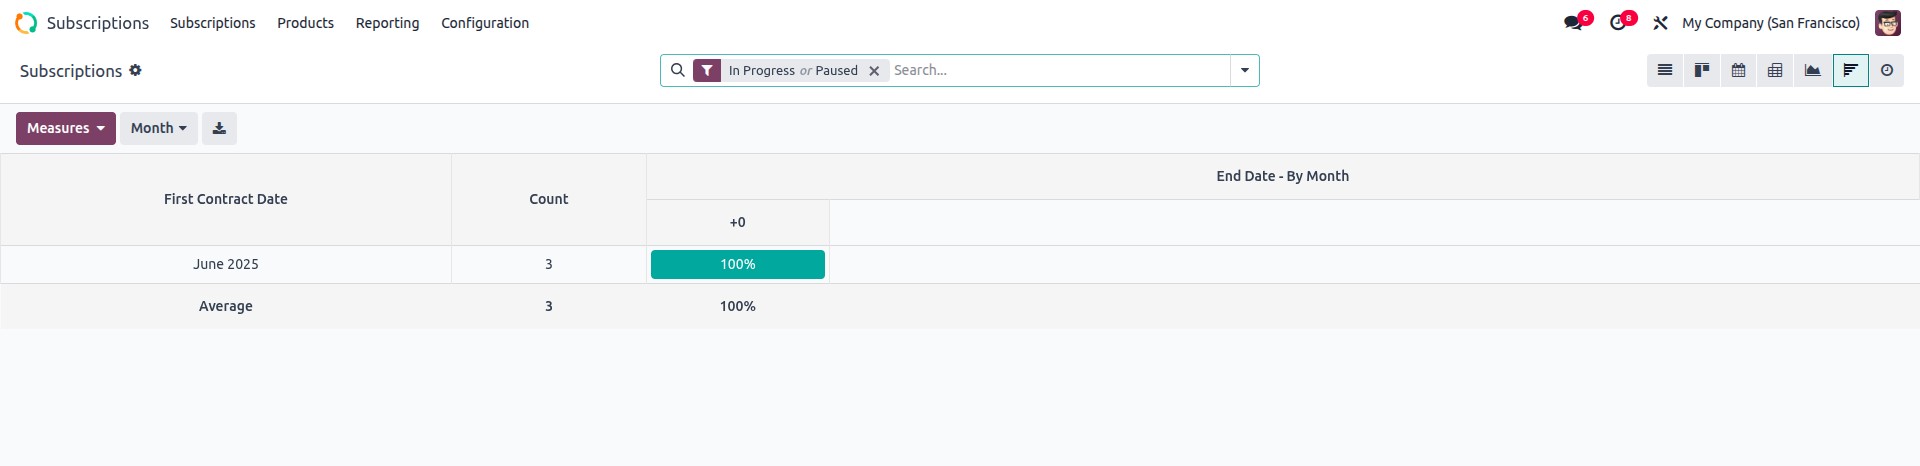
This view lets you analyze data grouped by start date, such as how
many patients returned over days, weeks, or months. You can easily
spot patterns and trends based on time intervals.
Example: Setting Up a Cohort View
Let's walk through creating a simple cohort view for tracking
hospital patients linked to certain events:
 from odoo import models, fields

class ModelExample(models.Model):
    _name = 'model.example'
    _description = 'Model Example'

    patient_id = fields.Many2one('hospital.patient', string="Patient")
    name = fields.Char(string='Name')
    date = fields.Date(string="Date")
    attachment = fields.Binary(string="Attachment")


class HospitalPatient(models.Model):
    _name = 'hospital.patient'
    _description = 'Hospital Patient'

    name = fields.Char(string='Patient Name')
    dob = fields.Date(string='Date of Birth')
Once your models are defined, create the action and attach it to a
menu so it’s accessible in the UI.
<record id="action_model_example" model="ir.actions.act_window">
    <field name="name">Model Example</field>
    <field name="type">ir.actions.act_window</field>
    <field name="res_model">model.example</field>
    <field name="view_mode">list,form,cohort</field>
</record>

<menuitem id="menu_model_example_root" name="Example Menu" sequence="5"/>
<menuitem id="menu_model_example" name="Model Example"
          parent="menu_model_example_root" action="action_model_example"/>
Now define the cohort view for your model. The key elements are:
- date_start: the field that represents the starting date.
- date_stop (optional): represents the end date (can be
same as date_start if only duration is tracked).
- interval: the grouping unit (day, week, month, year).
- mode: either retention (default) or churn.
<record id="view_model_example_cohort" model="ir.ui.view">
    <field name="name">model.example.cohort</field>
    <field name="model">model.example</field>
    <field name="arch" type="xml">
        <cohort string="Patient Follow-up"
                date_start="date"
                interval="day"
                mode="retention"
                sample="1"/>
    </field>
</record>
- Make sure to include web_cohort in the module's depends list in
the manifest (__manifest__.py). Without it, the cohort view will
not render and may throw a missing view type error.
'depends': ['base', 'web', 'web_cohort'],
- Retention vs. Churn Modes:
- Retention: Starts at 100% and shows how users stay over
time.
- Churn: Starts at 0% and shows how many users drop off or
become inactive.
- Odoo 18 enhances visual interactivity — tooltips and hover
highlights are now more intuitive when analyzing each time slice
in the cohort chart.
- A new sample attribute helps reduce data volume for large
datasets, improving performance during cohort rendering (as
shown with sample="1" in the example).