Odoo offers a graph view that visually represents data using
different chart formats such as Bar, Pie, or Line charts. This view
helps users interpret and analyze records more intuitively through
graphical insights.
Let’s now create a graph view.
We’ll begin with a custom model named visa.application.
                       class VisaApplication(models.Model):
   _name = "visa.application"

   name = fields.Char(string="Name", help="Name of the applicant")
   age = fields.Integer(string="Age")
   gender = fields.Char(string="Gender")
   date_of_birth = fields.Date(string="Date of Birth")
Next, define the menu item and link it to the corresponding action to
display the graph view.
<record id="record_action" model="ir.actions.act_window">
   <field name="name">Visa Application</field>
   <field name="type">ir.actions.act_window</field>
   <field name="res_model">visa.application</field>
   <field name="view_mode">list,form,graph</field>
   <field name="help" type="html">
       <p class="o_view_nocontent_smiling_face">
           Create a new record!
       </p>
   </field>
</record>

<menuitem id="parent_menu_root name="Visa" sequence="6"/>
<menuitem id="menu_id"  name="Visa Application"  parent="parent_menu_root"
   action="record_action"  sequence="10"/>
Once the model, menu, and action are in place, you can define the
graph view for the model.
<record model="ir.ui.view" id="visa_application_graph">
   <field name="name">visa.application.graph</field>
   <field name="model">visa.application</field>
   <field name="type">graph</field>
   <field name="arch" type="xml">
       < string="Example" type="bar>
           <field name="name" group="True"/>
           <field name="name" operator="*"/>
       </graph>
   </field>
</record>
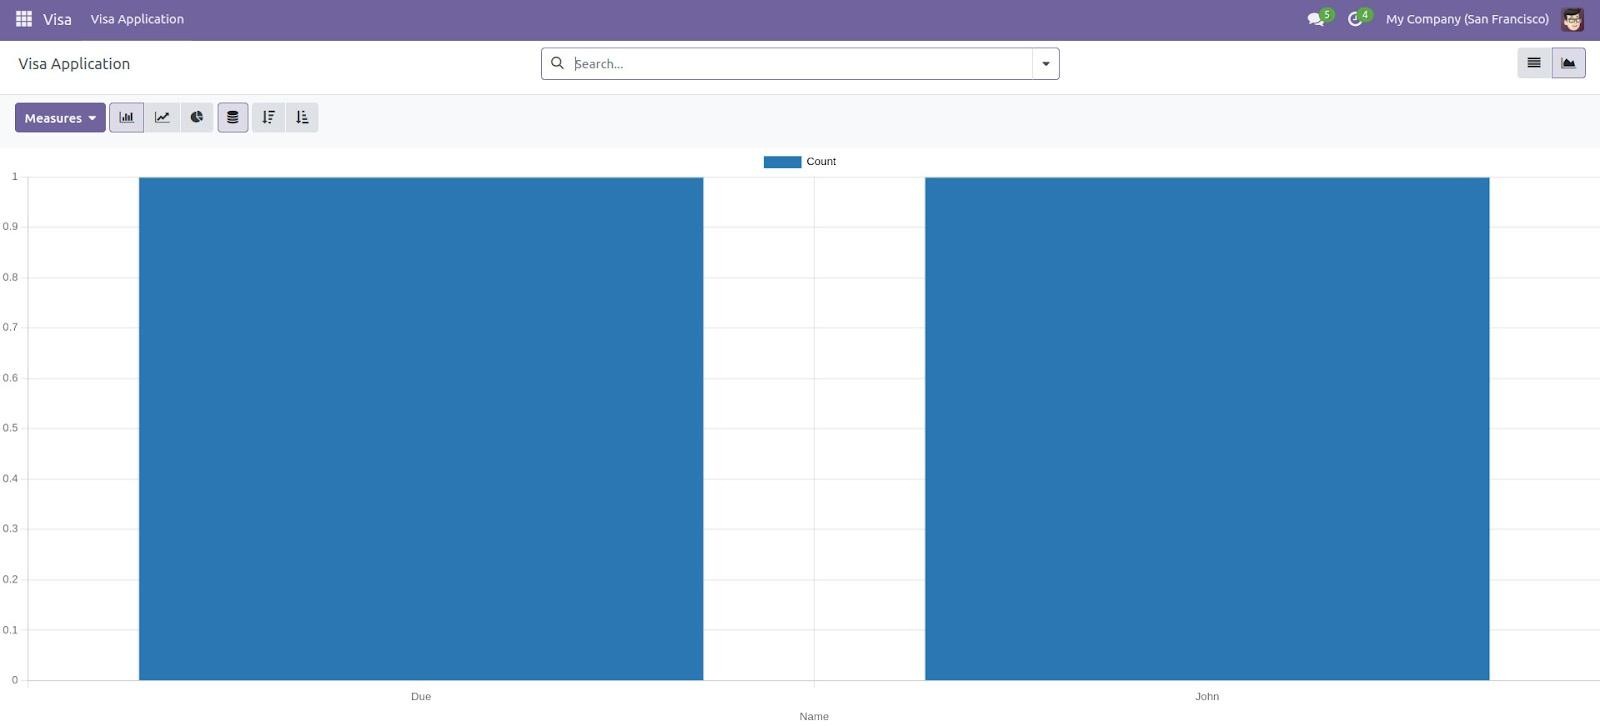
The output generated from the graph view configuration is as follows: