Sales Reporting is a useful tool for every business to monitor their sales operations and strategy. It gives the business current data on every stage of the sales process, allowing it to determine success and handle expansion concerns. In addition, reporting facilitates client acquisition, company success monitoring, audit trails, and marketing strategy redefinition. Deal pipeline size, conversion rate, and sales velocity are essential data elements to consider. This procedure gives a comprehensive picture of the company's position at every stage of the sales process, which helps make well-informed business decisions.
Analyzing sales processes on a regular basis facilitates fast workflow comprehension. A thorough understanding of sales management operations is offered by an efficient sales reporting system. To quickly analyze current sales performance and pinpoint areas for development, the Odoo 17 ERP system creates sales reports in a matter of seconds. Odoo has updated many functionalities and features in its 17th version of the ERP Package.
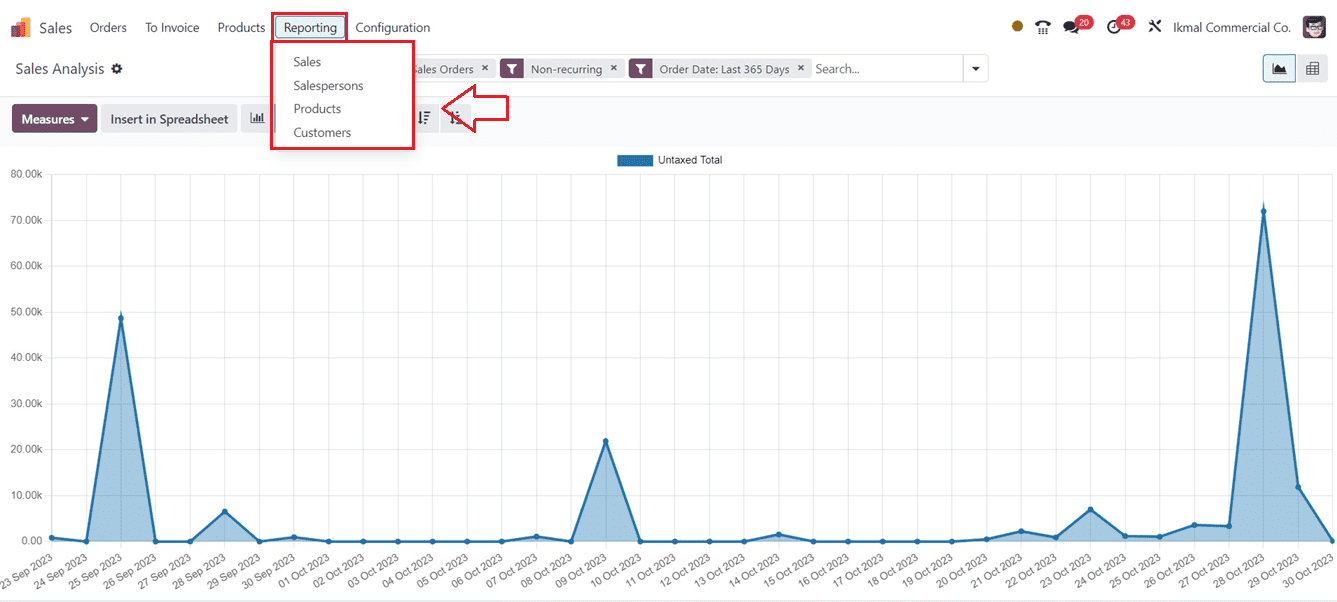
This blog provides a comprehensive analysis of the Revamped Odoo 17 Sales Module's reporting sections and their brief overview. To open the Sales Analysis window, select the Reporting option.
Reporting Menu in Odoo 17 Sales
After opening the Odoo 17 Sales Module from your Odoo ERP Package, go to the “Reporting” menu to get an analysis of your various sales-related topics that include Sales, Salespersons, Products, and Customers.
Sales Reporting
Under the "Sales" part of the "Reporting" menu, a monthly analysis of the total revenue from sales is presented graphically till the present moment. The sales amount is shown on the Y-axis, while different Order Dates are displayed on the X-axis.
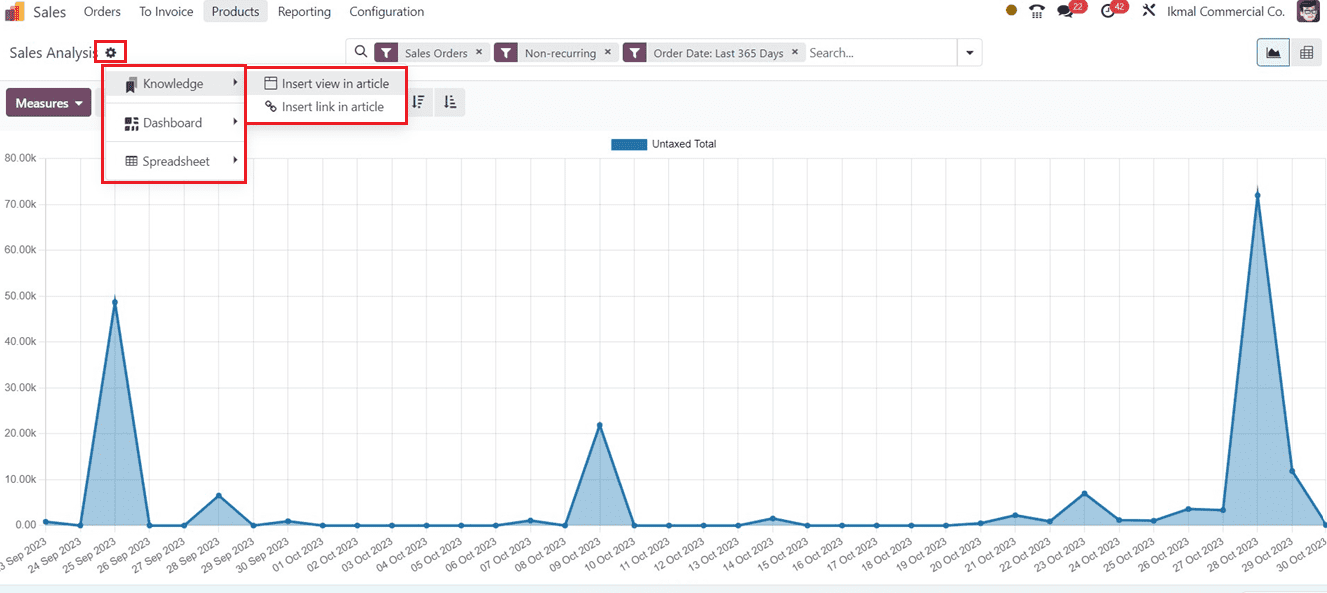
The action menu can be used to create articles, notes, or any documents related to the report data using the integrational feature of the Knowledge Module, and we can also add data to Dashboards and Spreadsheets using the respective options.
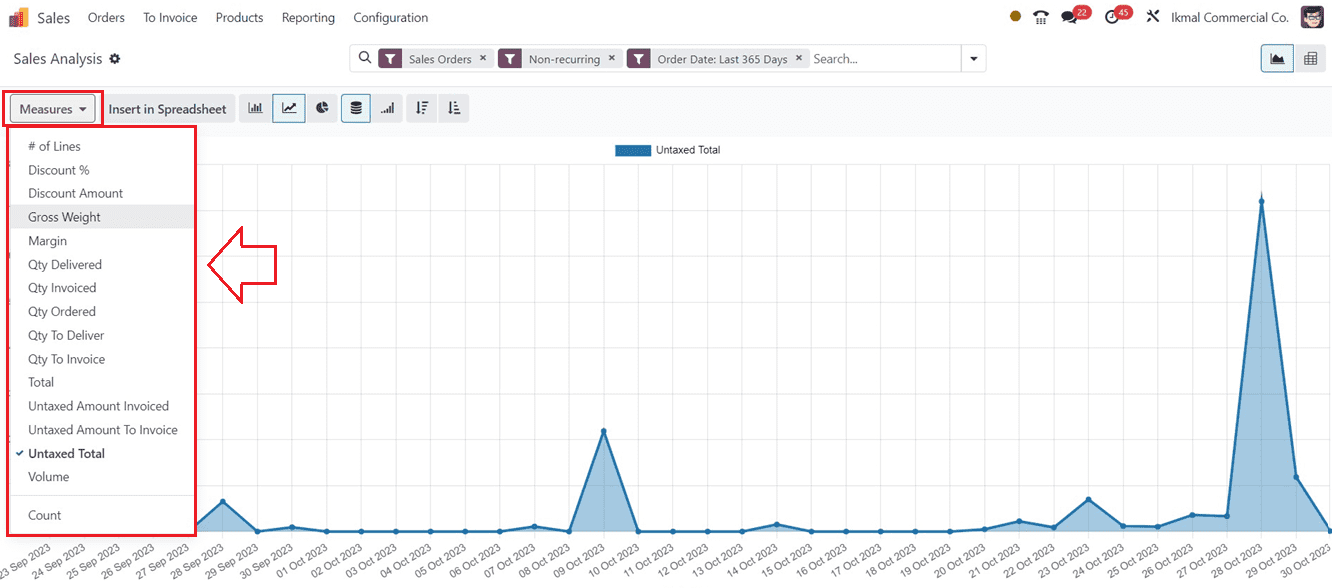
The parameter of the report view can be altered by clicking the "Measures" button. The list of parameters is visible to you, and it includes the following: Total, Untaxed Amount Invoiced, Discount Percentage, Gross Weight, Margin, Quantity Delivered, Quantity Invoiced, Quantity Ordered, Quantity to Delivery, and so forth.
The search bar provided at the top of the page can be used to filter, sort, and group the report data.
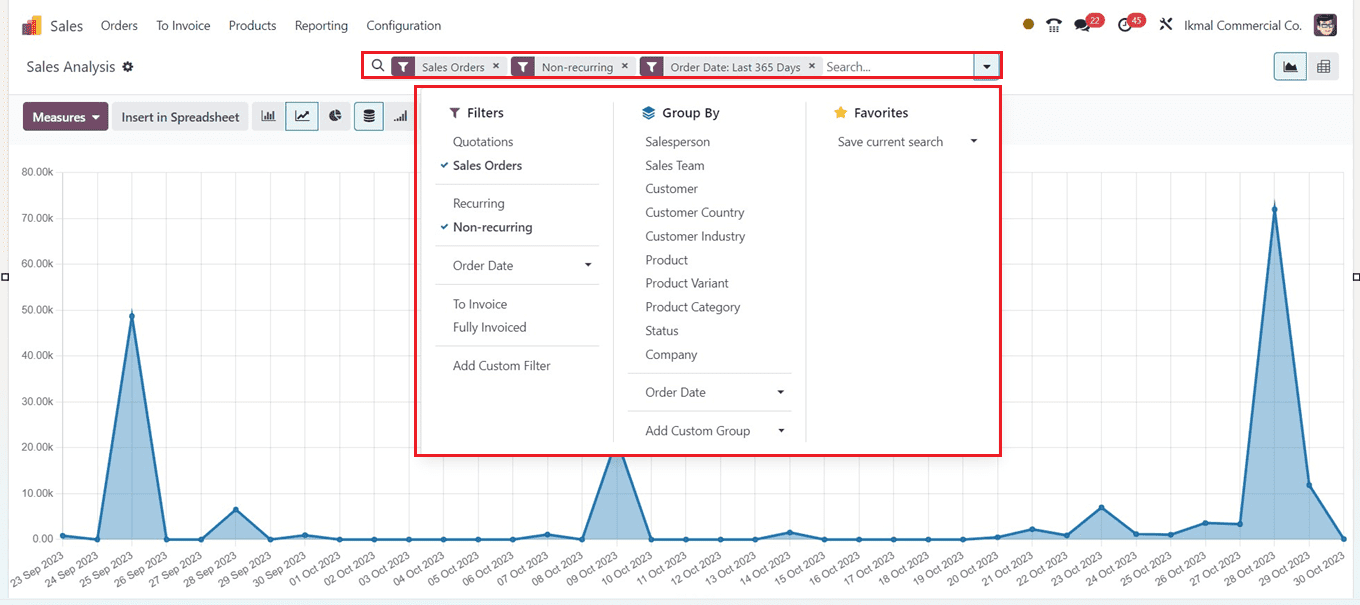
You can make customized filters and groups by using the search bar's "Add Custom Filter" and "Add Custom Group" options. You can view the report in different representations, including Bar Chart, Line Chart, Pie Chart, Stacked, Cumulative, Descending, etc. You can also view the report as a pivotal chart using the respective icons provided on the upper side of the reporting page.
Salespersons Reporting
Based on different salespeople, the "Salespersons" reporting window will provide the sales analysis by salespersons. We can quickly analyze the untaxed total sales amount from the Y-axis and view the salesperson details from the X-axis.
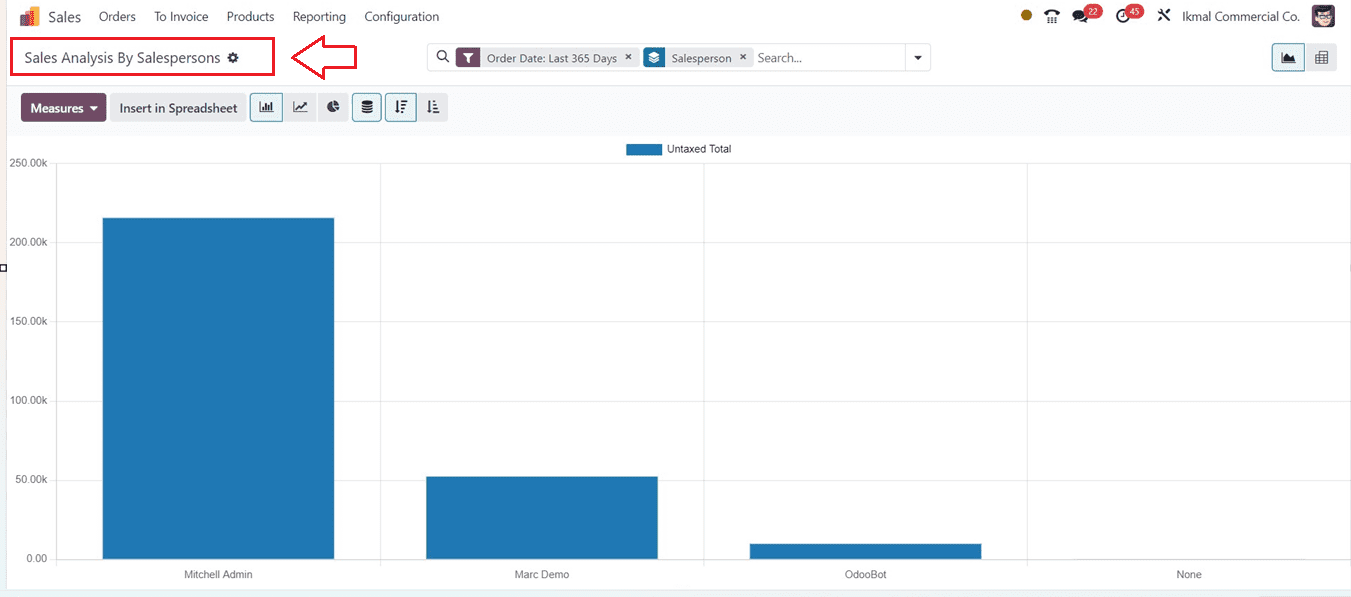
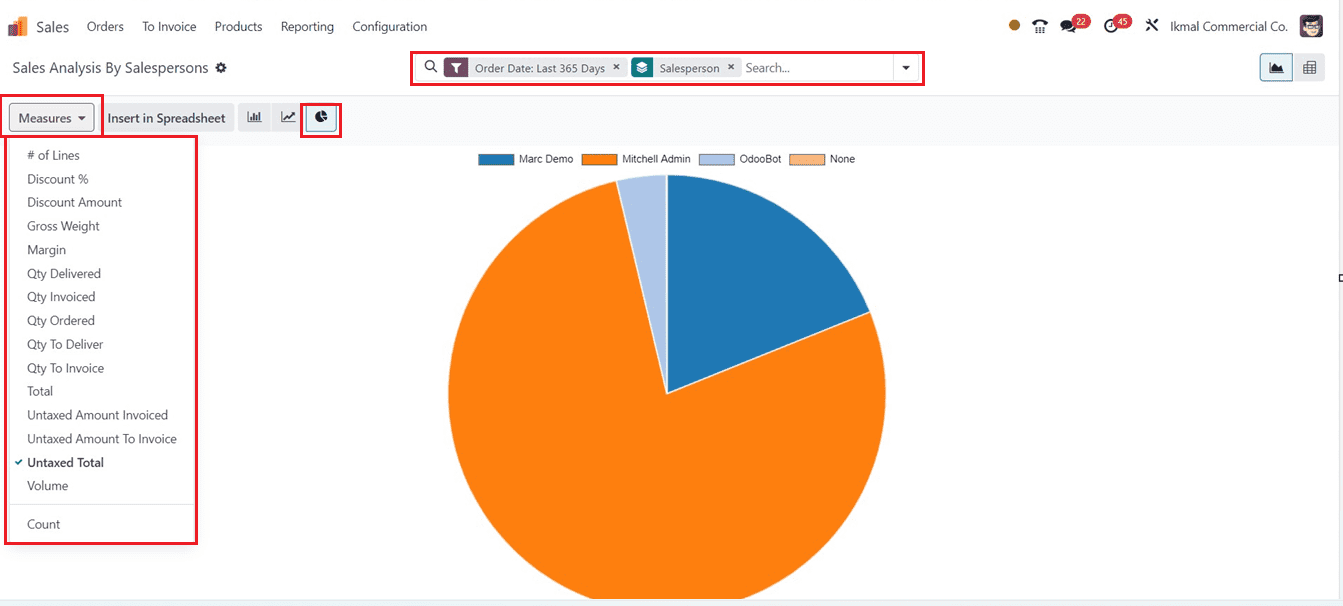
Here also, the “Measures” button provides various options to change the graphical measures almost the same as the previous reporting view. The search bar's "Filter" section contains Filtering options that you can utilize. The report's data can be grouped into distinct groups using the "Group By" option. You can also mark data in the "Favourites" section. Customized filters and groups can also be created from the search bar itself. The Bar chart view can be changed into various other views using the respective icons provided at the top sides of the window. You can see the Pie Chart of the window from the screenshot below.
Products Reporting
Gaining insights and analysis based on a sales company's products facilitates understanding of the best-selling and slow-moving items. These insights may then be used to focus on specific products and develop effective sales tactics. In the Odoo 17 Sales Module, the sales analysis by product is displayed as a pie chart in the "Products" reporting window.
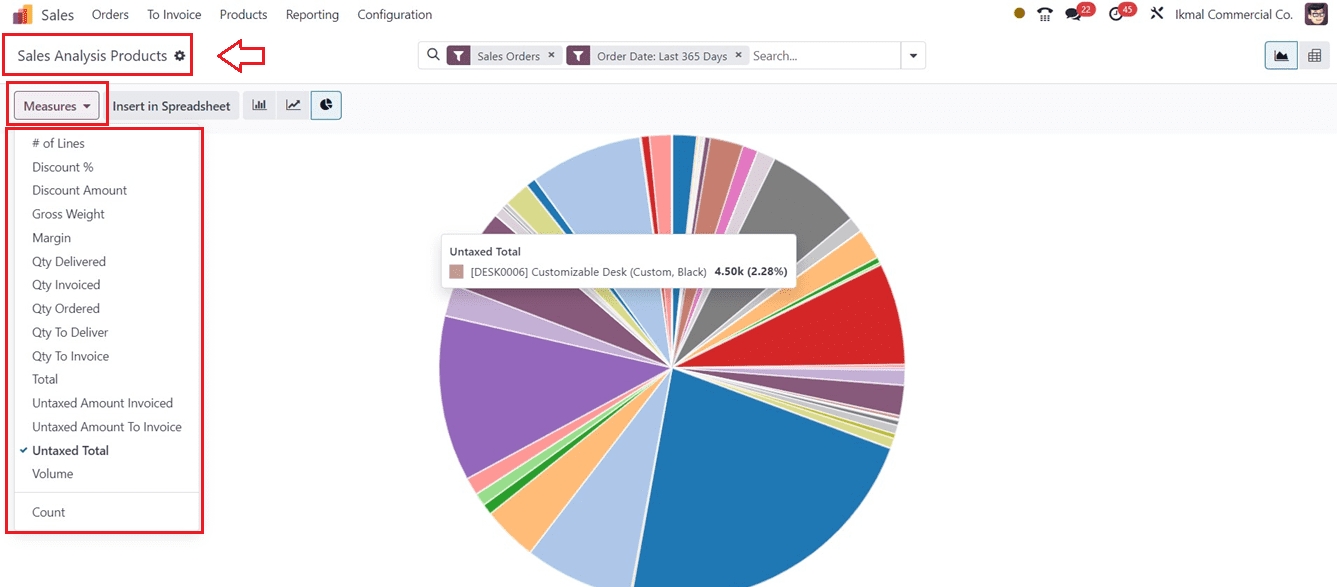
We can see the detailed untaxed total amount for each product inside the pie chart view. You will find a variety of graphical measures in the "Measures" area that allow you to obtain more in-depth analytics based on different sales conditions and characteristics. Utilizing the "Insert in Spreadsheet" button, you can view the reporting data contained within a spreadsheet. The search bar can be used to Filter, Group By, and mark important data into Favourites. The “Action” menu provides some options such as “Knowledge,” “Spreadsheets,” and “Dashboards.” The “Knowledge” option can be used to create articles, notes, and other documentation based on the reporting window. These data can also be added to spreadsheets and dashboards using the “Spreadsheet” and “Dashboard” options respectively.
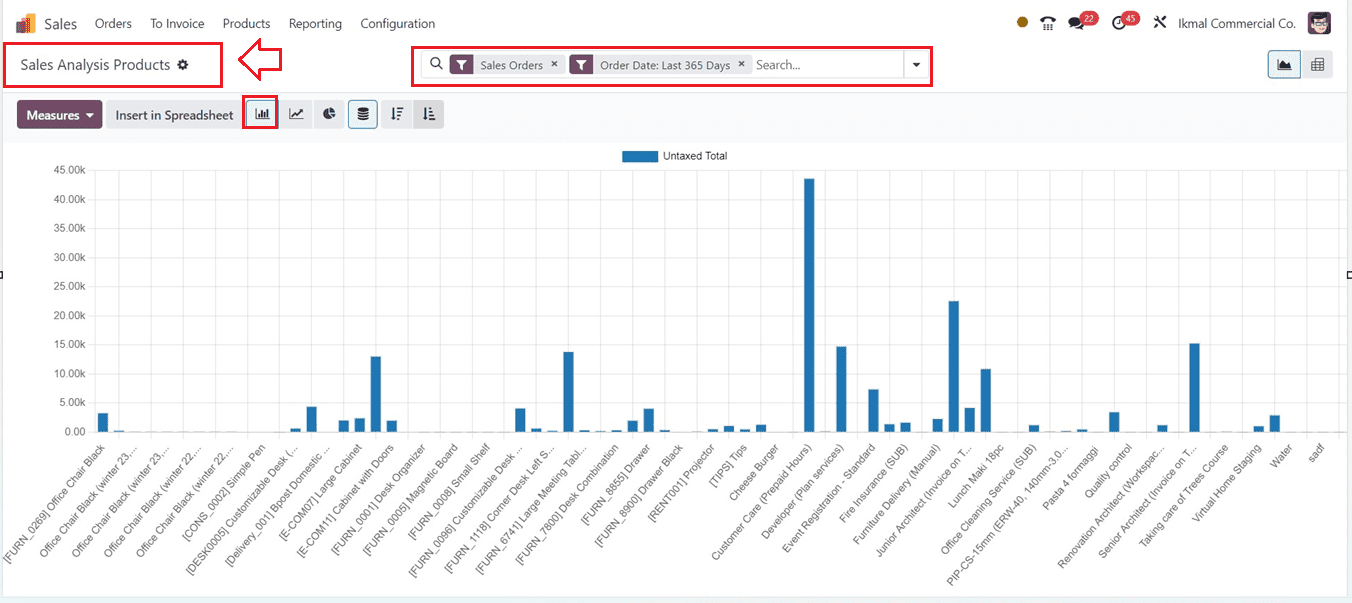
Utilize the advanced search bar to Filter the data, Group the data, and mark it as a favorite. There are various visualization methods, such as Bar Charts, Line Charts, Stacked, Pivot, and other graphical views. Users can choose their report view based on their requirements and analyze reports based on their sales perspectives. You can see the Stacked view of the reporting window as shown below.
Customers Reporting
With an analysis of each client's purchase amount and a detailed summary of your company's sales by customer, the Sales analysis by the customer report is a valuable resource. In Odoo 17 Sales, you can access this report by choosing the “Customers” option from the “Reporting” menu.
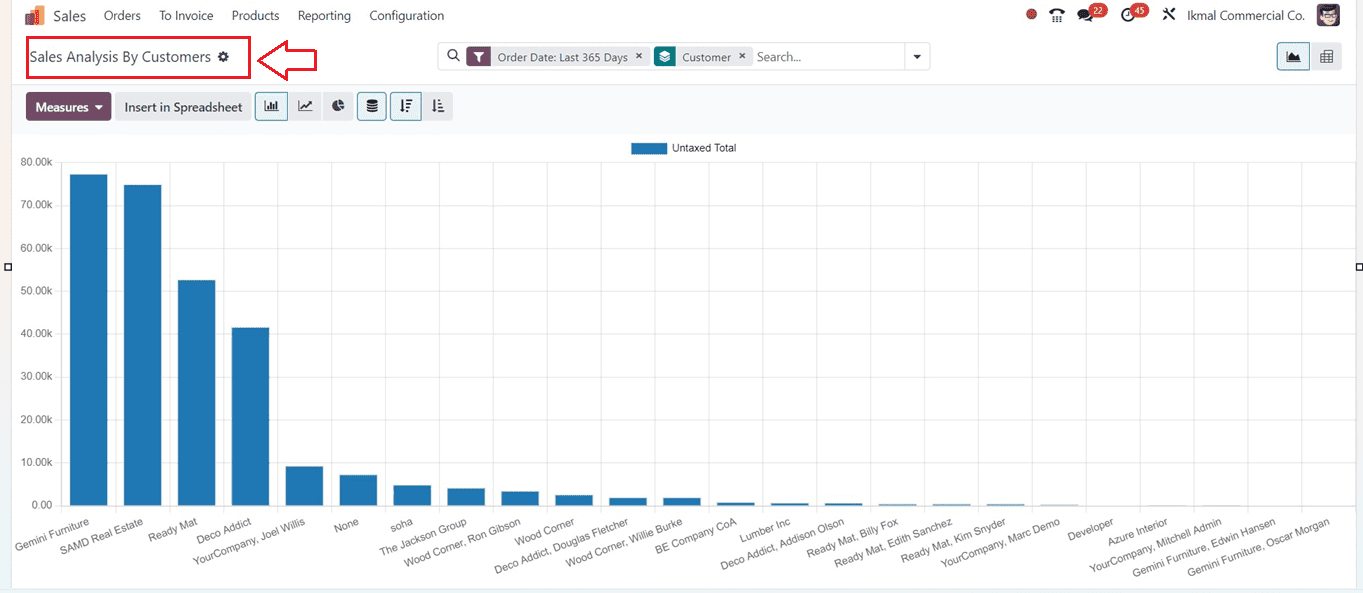
You will get the customer details from the X-axis and their sales amount from the Y-axis. For further in-depth analysis, the "Measures" section provides a variety of graphical metrics. Clicking the "Insert in Spreadsheet" button will open a spreadsheet so that you can add the reporting data into the spreadsheet for documentation and future records. The "Action" menu provides tools such as "Knowledge," "Spreadsheets," and "Dashboards" for creating articles and adding data to spreadsheets or dashboards. Users may group, filter, and favorite items in the advanced search box. Customizing report views is possible according to particular needs and sales viewpoints.
The Odoo 17 Sales application platform's "Reporting" menu provides effective sales reporting systems that offer an extensive evaluation of various sales measures, evaluate progress, address concerns about expansion, support client acquisition, audit trails, marketing strategy redefinition, and company success monitoring.
To read more about attaching product documents using Odoo 17 sales app, refer to our blog How to Attach Product Documents Using Odoo 17 Sales App