Business intelligence the team which got to be more familiarized around the world quite recently or can be said in the past decade of the current century. So what exactly is business intelligence? As everyone does I too searched google on it and there were hundreds of definitions, examples, and context describing the business intelligence aspect of a company, case studies application, tools in detail. The following is a definition of the same which I have derived based on my understanding and of course reading about it as I searched for it before.
Business intelligence can be defined as the collection of operational principles, integrated technology, and methodology of functioning all point towards the same goal of analyzing the data in hand and providing a better solution to run the organization, tackle the problems and generate profits with planned actions. Today there are various business intelligence advancement tools available that can be easily obtained and here are certain aspects that these tools focus on such as data warehousing, dashboard, data discovery tools, cloud services, and many more.
So what has reporting had to do with business intelligence and what is BI reporting? This will be a question that popped up in your mind right after reading the blog title. BI reporting is the methodology of generating analytics data based on the analysis and management of the data at hand using various BI tools available. Moreover, the BI-based reporting will provide an insight into the functioning of the company and its trajectory of operations based on the data available at hand, therefore, improving the decision-making and overall business performance in an establishment.
This blog will provide an insight into the BI reporting in Odoo.
Odoo as you know is an advanced ERP with the capability to manage the business operations of the company at all levels of functioning. Today it has become one of the top ERP solutions available with more than 5 million users spreading all over the world stretching in various sectors of business and levels of company functioning. As Odoo is an advanced business management platform it has advanced tool integration capabilities and functioning aspects. Furthermore, as Business Intelligence is an unavoidable factor in today's context of a company functioning the Odoo platform has also integrated it into the operations.
The latest version of Odoo that is the Odoo 14 released last year during the Odoo experience of 2020 is considered as one of the advanced management systems available today for business management operations. Moreover, the Odoo 14 is the fastest as well as advanced with capabilities than all the previous versions of the platform. The spreadsheet operation available in the documents modules is the best example of the advanced new feature available in Odoo 14.
Spreadsheet
The spreadsheet functionality of the documents module is the best example of the business intelligence methodology integrated into the Odoo platform. Moreover, the fusion works just as with that of the excel spreadsheet and has all the functional capabilities required. Furthermore, the generation of the BI-based reports is feasible with the spreadsheet functionality adding up to the predictive and forecasting aspects of the company and its functions.
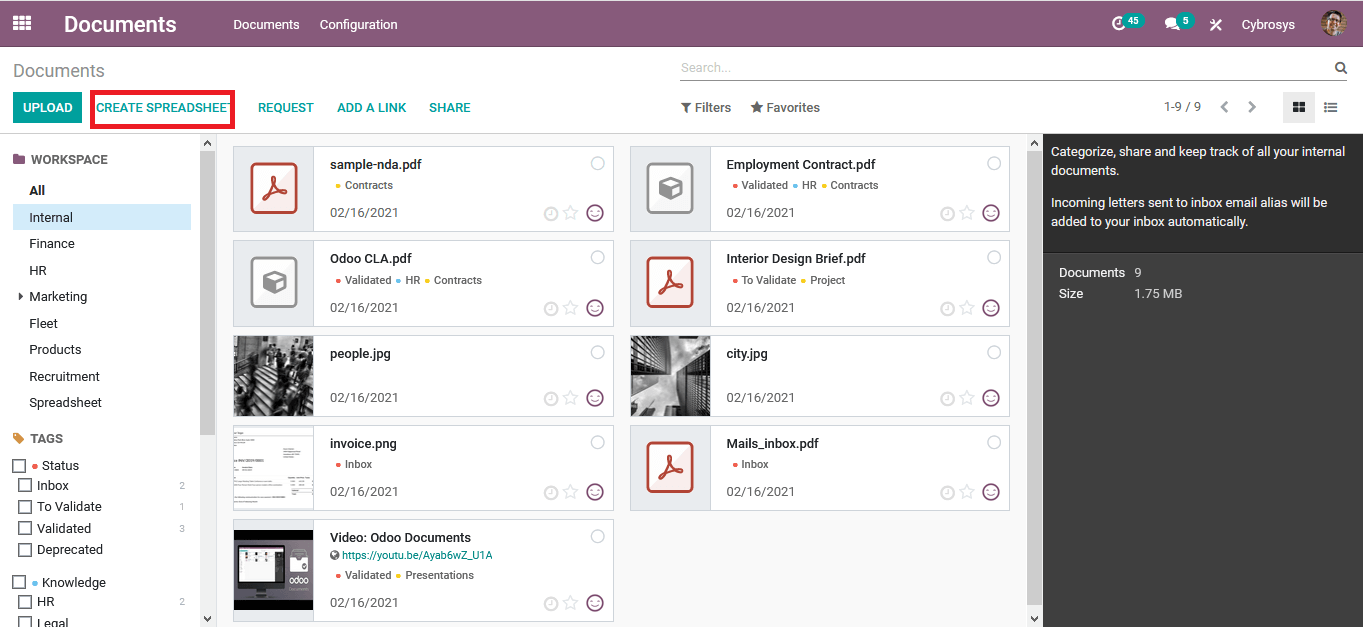
The spreadsheet functionality can be accessed from the documents module available in Odoo. You can download the documents module from the application menu if it is not available on the home screen of Odoo. Upon entering the documents module you will be depicted with the home dashboard where all the documents available will be listed out From the dashboard you can select the create spreadsheet option available just as it has been marked in the following image. In addition, if there is a spreadsheet already been created it will appear along with the other documents in the list. The following screenshot depicts the documents modules home screen dashboard.
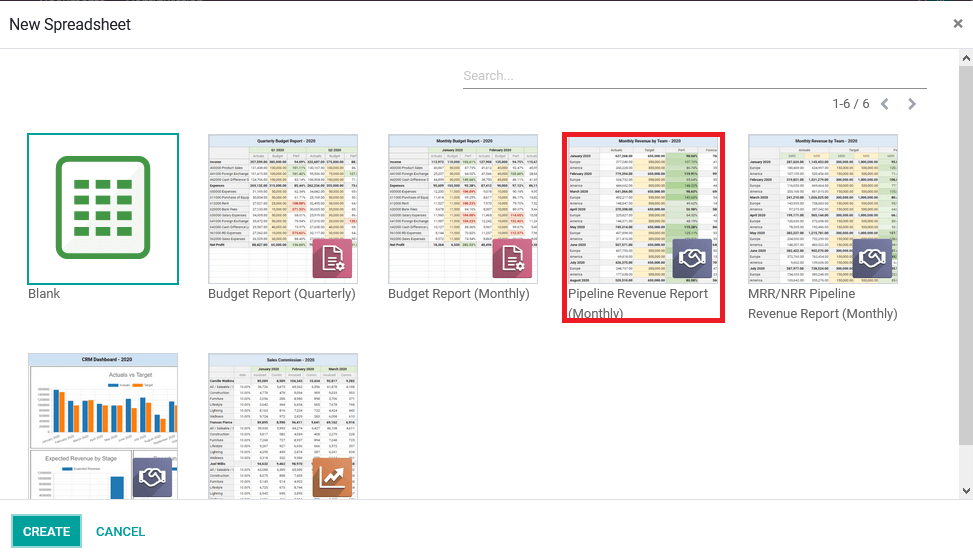
Upon selecting to create a spreadsheet you will be depicted with the following window as shown in the screenshots down below. Here you can select from a list of reports which is available by default. Furthermore, there are other forms of report generation tools available in the Odoo apps store for certain application-specific operations. You can either choose a blank spreadsheet, a budget report - quarterly or monthly, pipeline revenue report- monthly, MRR/NRR pipeline revenue report- monthly and other CRM as well as sales-based reports as per your need.
In this context of business intelligence, we are selecting a pipeline revenue report generated monthly.
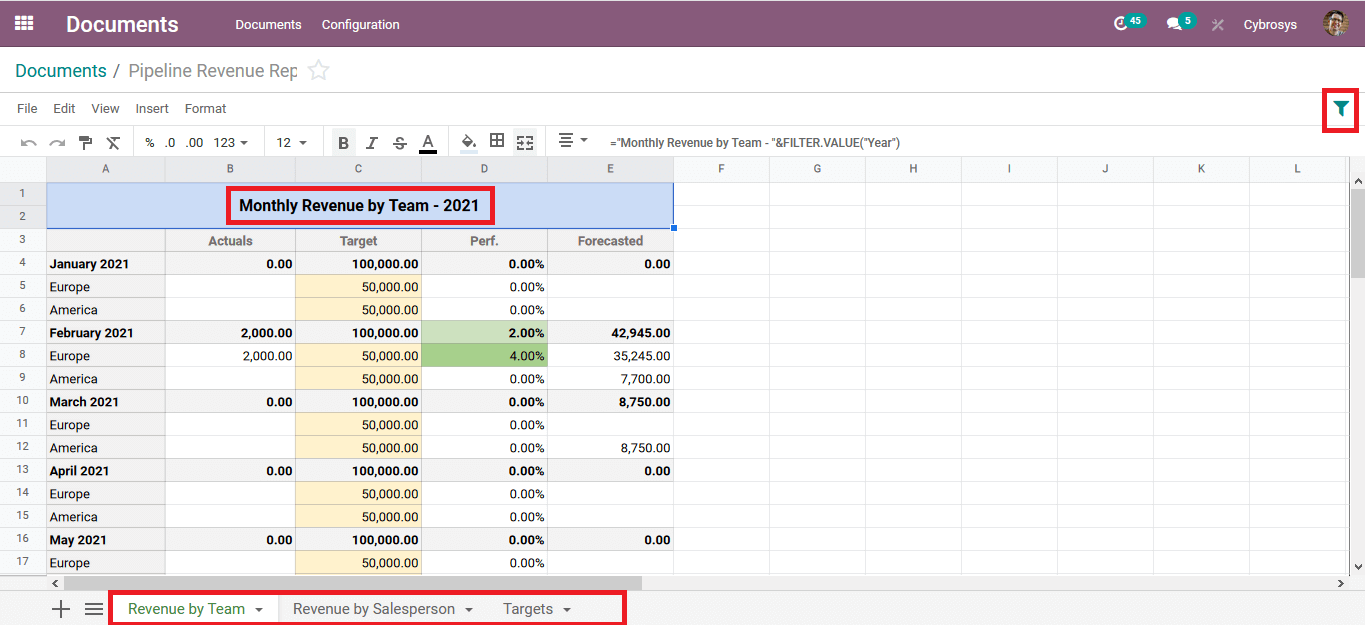
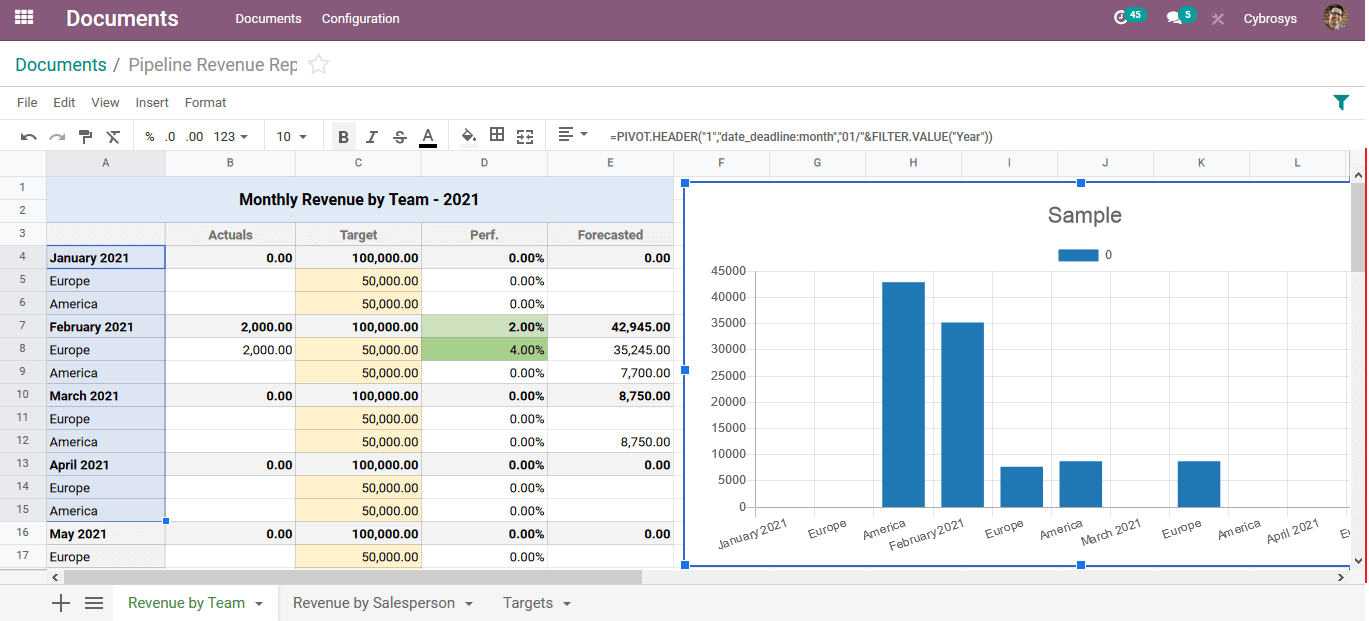
On selecting the create option you will be depicted with a spreadsheet based on the selected. Here is a monthly revenue by a team for the year 2021 for the company Cybrosys as is the company name in the Odoo platform. Furthermore, there are various sheets available on the spreadsheet by default in the case of the revenue reports. The classification of the sheets is done based on revenue by salesperson and the targets of each salesperson. There are the default filtered sheets available. In addition, various other filtering options are available by default and can be configured by selecting the filter option available in the right corner of the screen as depicted in the following spreadsheet screenshot.
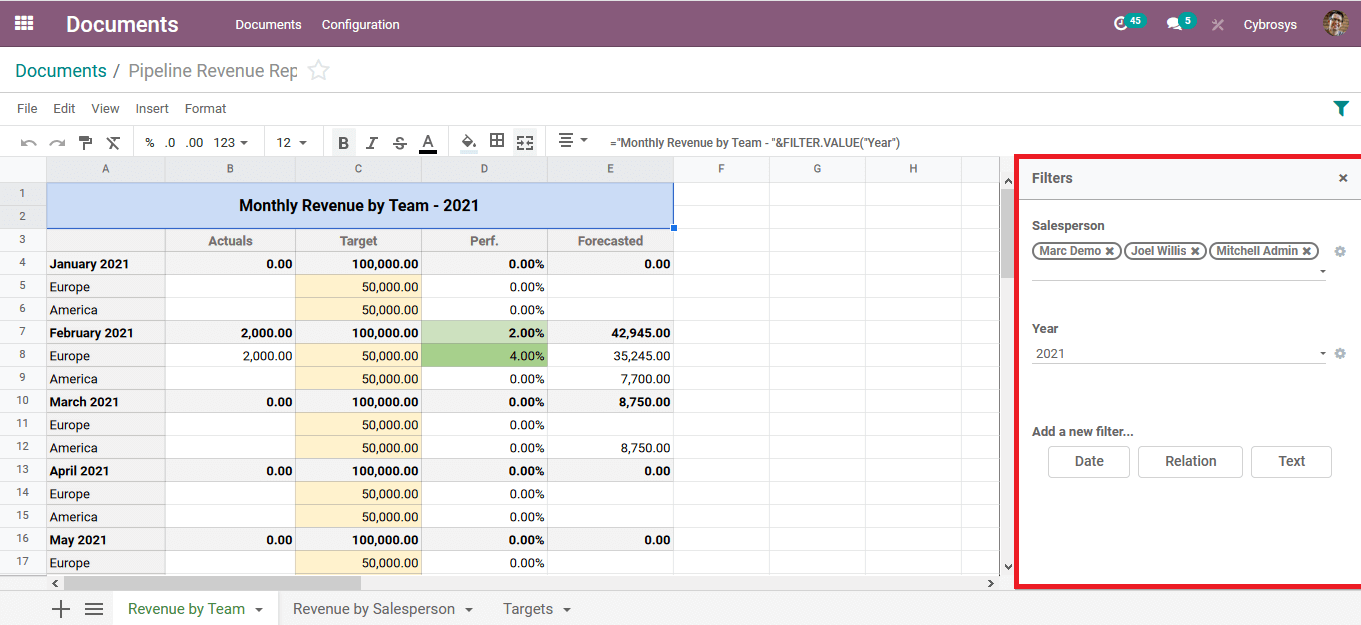
The default filtering can be done for the salesperson and the year further customizable filtered can be generated based on the need and necessity of the report. The following screenshot will depict the filtering menu of the spreadsheet.
Charts are an inevitable part of a report as it will provide a graphical insight on the quantitative analysis which has been conducted. The Odoo platform understands this and allows you to create various forms of illustrative charts such as bar, line, and pie charts as per your need. The following screenshot depicts the chart created based on the spreadsheet contents available. Moreover, the chart function is available in the spreadsheet under the insert menu just as in the excel sheet along with various other functions.
As of now, you will be having an understanding of the reporting functionality of the Odoo platform and how the business intelligence aspect is embedded in it with the forecasting data available in each chart based on the previous data available at your hand.