Odoo 17 is a powerful open-source software package designed to help businesses manage various aspects of their operations efficiently. One standout feature is its dynamic graph views, providing a visual way for users to understand their data. These graphs are flexible and come with customizable attributes, allowing businesses to display data in ways that suit their specific requirements. This visual representation makes it easier for users to make sense of complex information and improve decision-making.
Here is an example of a graph view in Odoo.
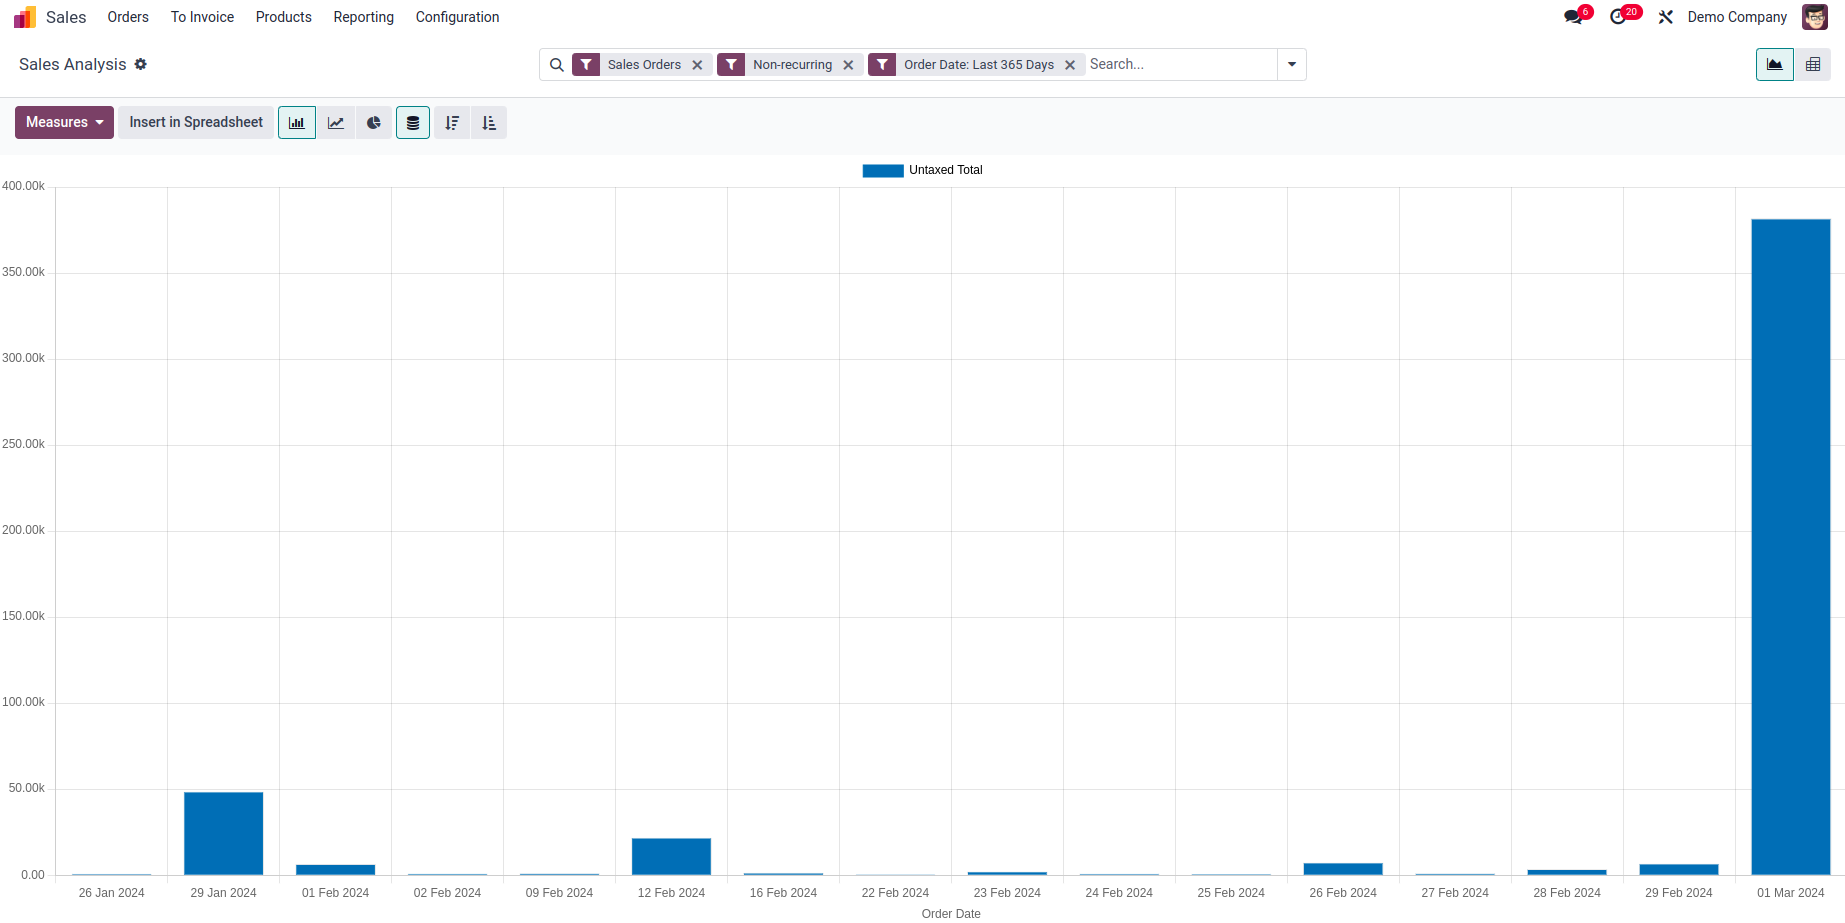
In Odoo, the graph view offers various attributes that enable customization of its features. In this blog post, we explore these attributes to understand how they can be utilized effectively. The root element of the graph view is <graph>, which supports the following attributes:
1.string (optional)
This attribute determines the label to be presented as the title of the graph view.
Example:
<graph string="Sales Analysis">
The specified string is showcased as the title of the graph view and is also displayed in the breadcrumbs when navigating back to the list view.
2. type (optional)
This attribute dictates the style of graph to be rendered in the view, such as a bar graph, line graph, etc.
Example:
<graph string="Sales Analysis" type="line">
The available types of graphs include:
Line
Bar
Pie
Donut
Area
Scatter
Radar
By specifying the desired type using the "type" attribute within the graph tag, you can customize the appearance and behavior of the graph accordingly.
3. Sample (optional)
The "sample" attribute is utilized to restrict the number of records fetched for plotting the graph. This feature becomes particularly important when dealing with large databases, as fetching extensive data can lead to performance issues in graph rendering. By setting the "sample" attribute, you can control the percentage of data fetched for the graph.
Example:
<graph string="Analytic Items" sample="1">
In this example, a sample value of 1 indicates that 100% of the data will be fetched, while a value of 0.5 would fetch only 50% of the data. This sampling technique aids in enhancing the graph's performance by reducing the number of data points displayed.
Additionally, the "sample" attribute offers an option to populate the view with a set of sample records if no data is found for the current model. However, these sample records are non-interactive and are discarded as soon as an action is performed, such as creating a record or adding a column. It is of boolean type with a default value of False.
4. stacked (optional)
The "stacked" attribute determines the presentation of data in the graph, specifying whether data from different categories should be stacked on top of each other or displayed side by side.
Example:
<graph type="line" stacked="0">
This attribute is specifically applicable to bar charts. By setting it to True, the bars within a group will be stacked initially. Alternatively, setting it to 0 prevents the bars from being stacked within a group.
5. disable_linking (optional)
The "disable_linking" attribute is utilized to prevent the linking of data displayed in the graph view to corresponding form or tree views.
When set to 1 or True, clicking on the data within the graph will not navigate the user to the corresponding record in the form or tree view. However, if set to 0 or not specified, clicking on the graph enables the user to easily access the corresponding record.
Example:
<graph disable_linking="1">
In this example, setting "disable_linking" to True prevents the redirection of clicks on the graph to the list view.
6. order (optional)
The "order" attribute is employed to indicate whether the graph data should be presented in ascending or descending order.
Example:
<graph order="DESC">
Specify the value as 'desc' for descending order and 'asc' for ascending order. When this attribute is set, the x-axis values will be automatically sorted according to their measure, respecting the given order ('asc' or 'desc'). This attribute is applicable only to bar and pie charts.
The attributes of the "field" element within a graph view include:
1. name (mandatory)
The "name" attribute specifies the name of a field to be used in the view. If the field is used for grouping rather than aggregating, it serves as the basis for grouping the data.
2. invisible (optional)
When set to true, the field is hidden from both the active measures and the selectable measures in the view.
3. type (optional)
When set to "measure", the field is treated as an aggregated value within a group instead of being used as a grouping criterion. This attribute only applies to the last field specified with the "type" attribute. However, it can be useful for other fields with the "string" attribute.
4. interval (optional)
When used with date and datetime fields, it allows grouping by the specified interval such as day, week, month, quarter, or year. This differs from grouping on the specific datetime (with fixed second resolution) or date (with fixed day resolution). The default interval is the month.
5. string (optional)
The "string" attribute is applicable only when the field has the type "measure". It specifies the name that will be displayed for the field in the graph view, overriding the default Python string attribute of the field.
When working with graph views in Odoo, it's important to understand the attributes that control how the graphs look and behave. These attributes help customize things like how data is displayed, sorted, and linked. However, it's crucial to remember that non-stored function fields cannot be used for aggregation in graph views. This means you need to use stored fields that hold the necessary data for accurate graph representation.