Odoo 19’s dashboard feature delivers a unified and user-friendly view of critical business metrics, helping teams make faster and more informed decisions. With a strong emphasis on usability, dashboards provide real-time insights into sales performance, inventory status, financial figures, and other key data, tailored to each user’s role and access rights. Each application can have its own customizable dashboard, ensuring that relevant information is always front and center. Interactive widgets, charts, and KPIs make it easy for managers and teams to understand performance at a glance and act accordingly.
A major strength of Odoo 19 dashboards is their flexibility and scalability. Businesses can build dashboards from scratch to match precise reporting needs or use pre-built templates to accelerate setup. Users have full control over the data displayed and how it is visualized. With enhanced spreadsheet integration, teams can perform advanced calculations, create dynamic visual reports, and work with real-time data directly within Odoo, removing the need for external tools and reinforcing a data-driven culture across the organization.
Creating a new custom dashboard
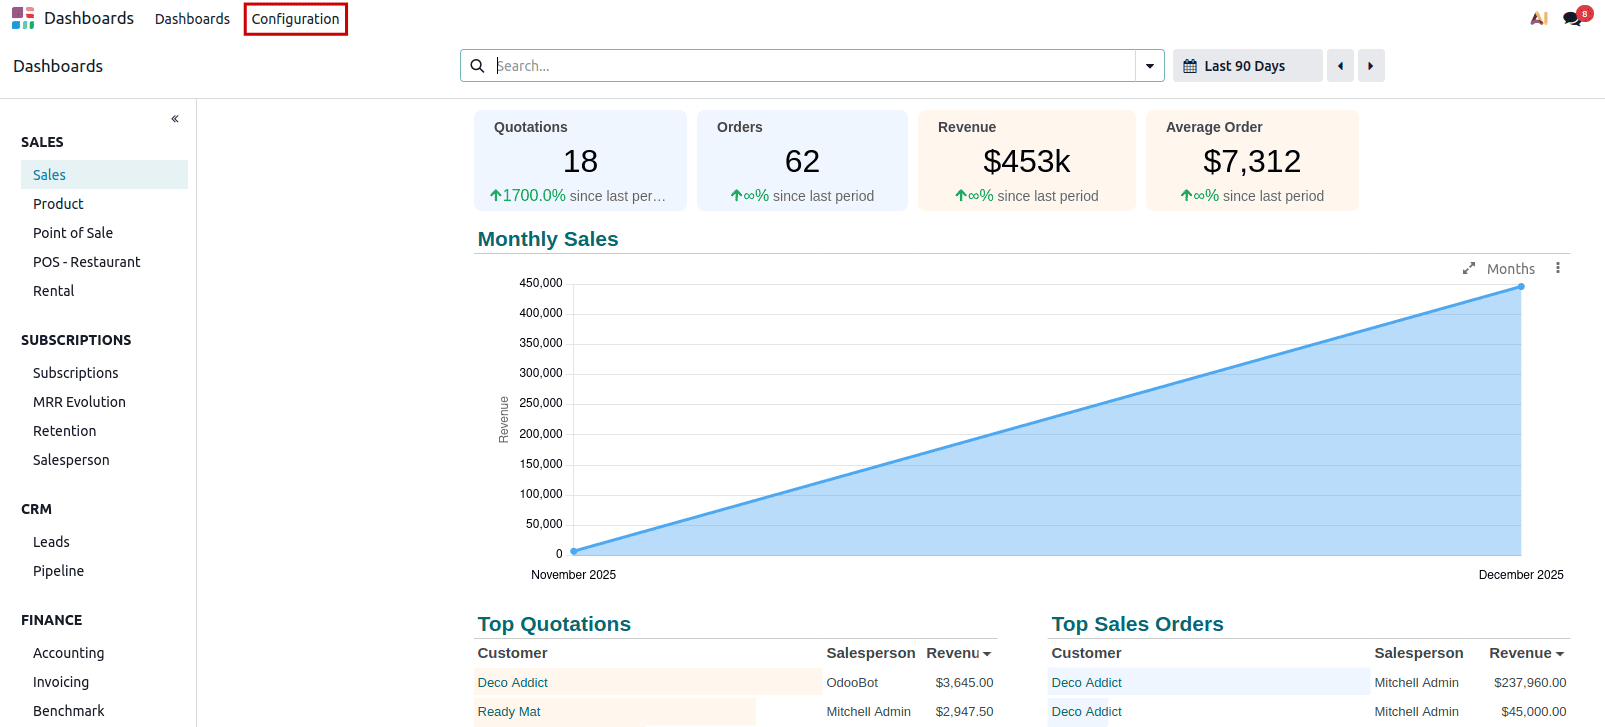
To build a custom dashboard in Odoo 19, start by going to the Dashboard module from the main Odoo menu. Inside the module, access the Configuration menu, where you’ll find the option labeled Dashboards.
Choosing this option will show a list of all dashboards currently in the system, allowing you to quickly see what’s available. From this view, you can manage existing dashboards by editing, duplicating, or deleting them, or you can create a completely new dashboard customized to your requirements.
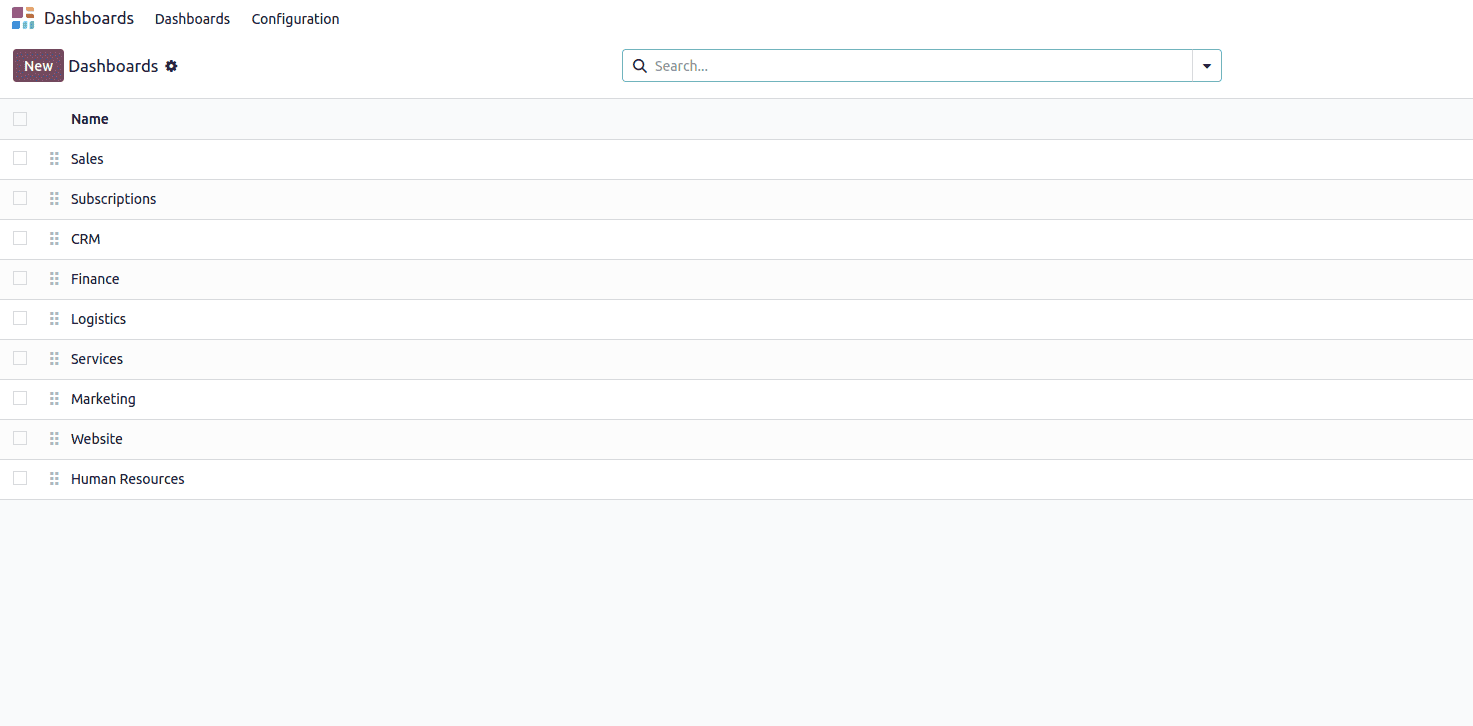
When you’re ready to add a new dashboard, click the New button. This will open a form where you can provide a name for your dashboard and configure the necessary settings. A key step in this process is connecting the dashboard to a spreadsheet.
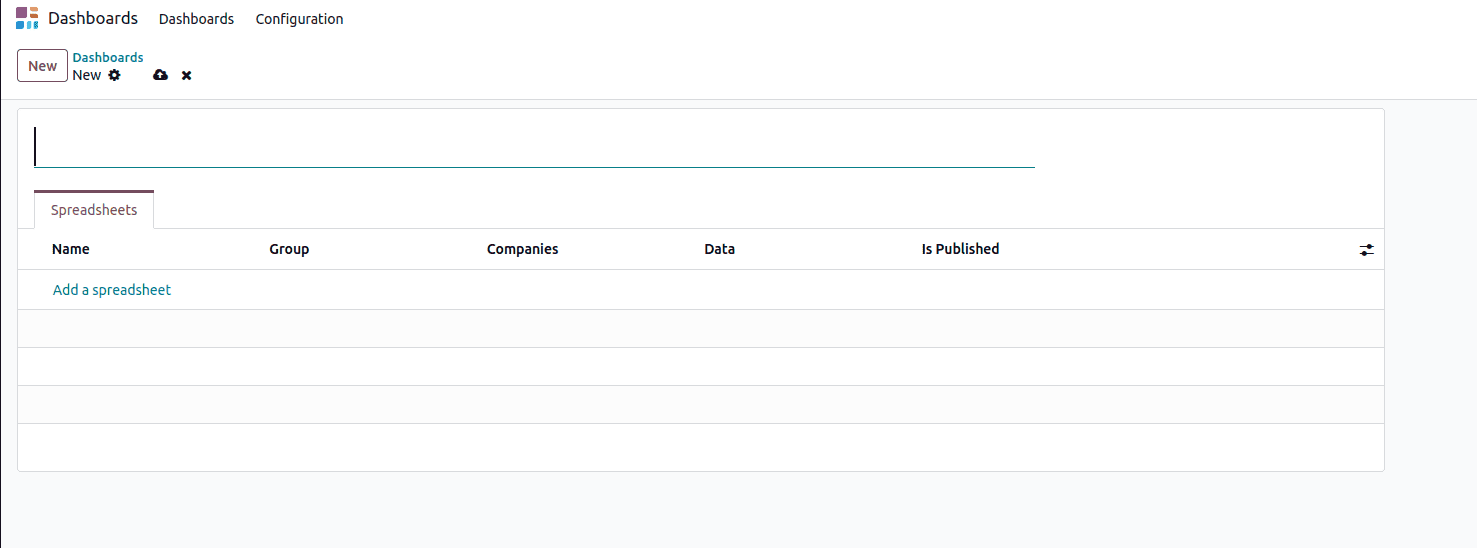
Click the Add a Spreadsheet button to begin. A wizard will appear, allowing you to either start with a blank spreadsheet or pick from pre-designed templates. These templates make it easy to quickly create dashboards for typical business tasks, such as analyzing sales, tracking inventory, or reviewing financial performance.
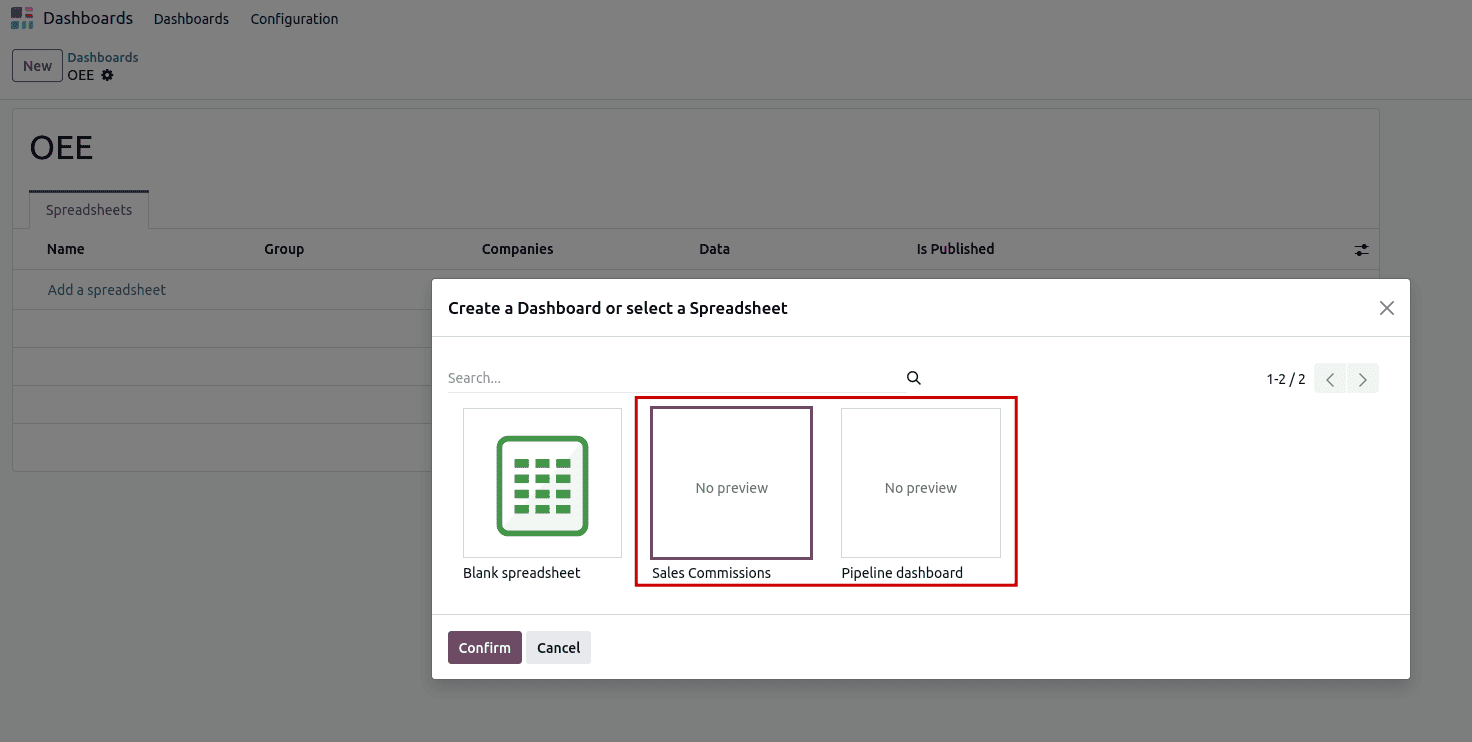
If you select an existing spreadsheet, Odoo will automatically fill the dashboard with the corresponding data, giving you an immediate overview without much setup. At this point, you can also set access permissions, restricting visibility to certain user groups or companies so that sensitive information is only available to authorized users.
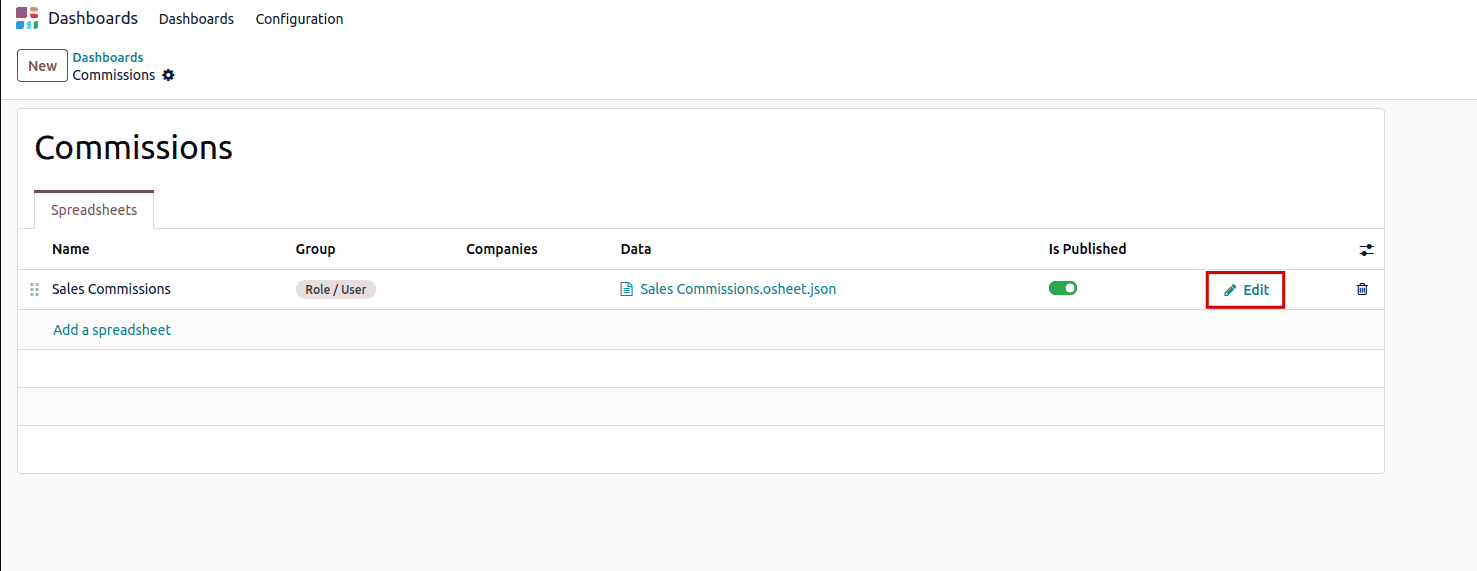
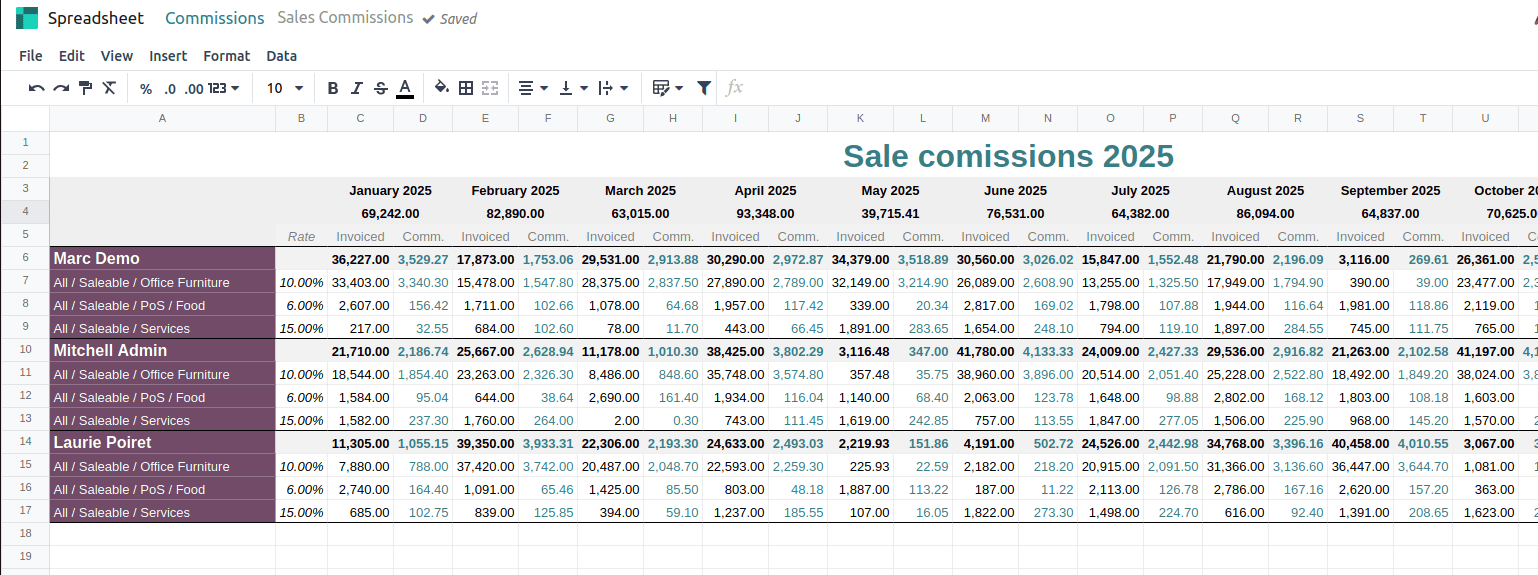
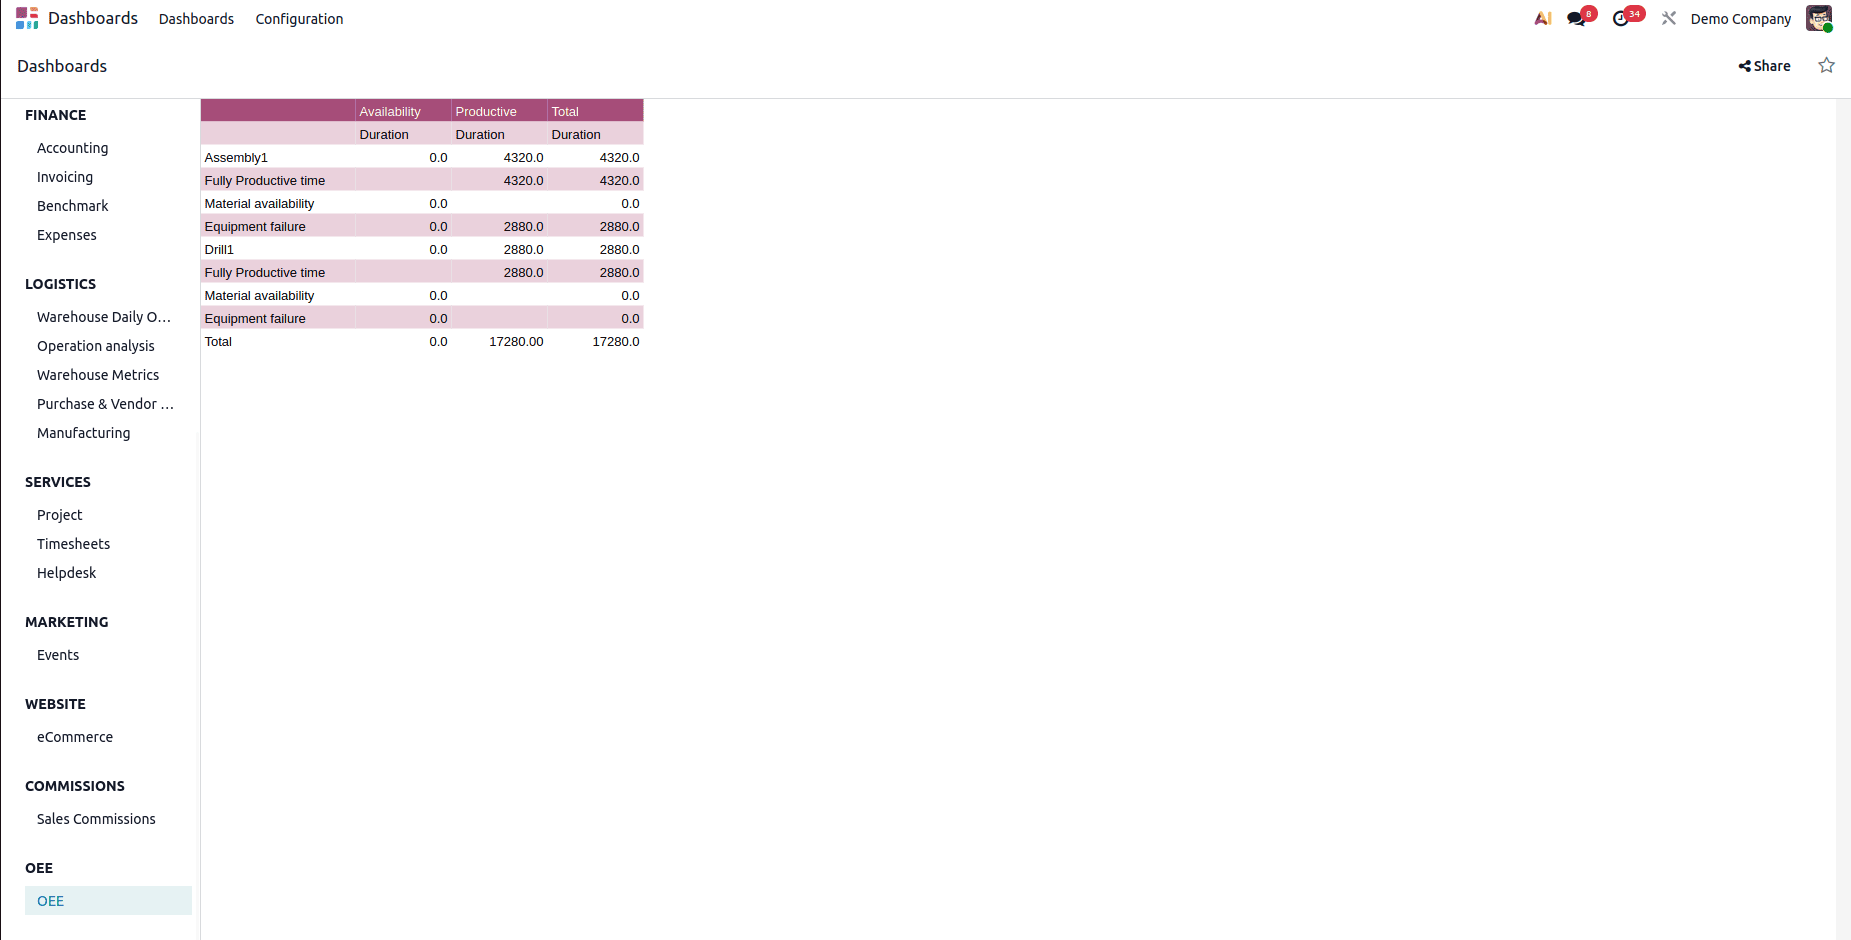
Once the initial setup is complete, you can go back to the dashboard list to view your newly created dashboard. Clicking on it will display the linked data, and if changes are needed, you can select the Edit button. This opens the spreadsheet editor, giving you full control over the layout, structure, and formulas. Any updates you make are immediately reflected on the dashboard, ensuring real-time accuracy and allowing your reporting tools to evolve alongside your business.
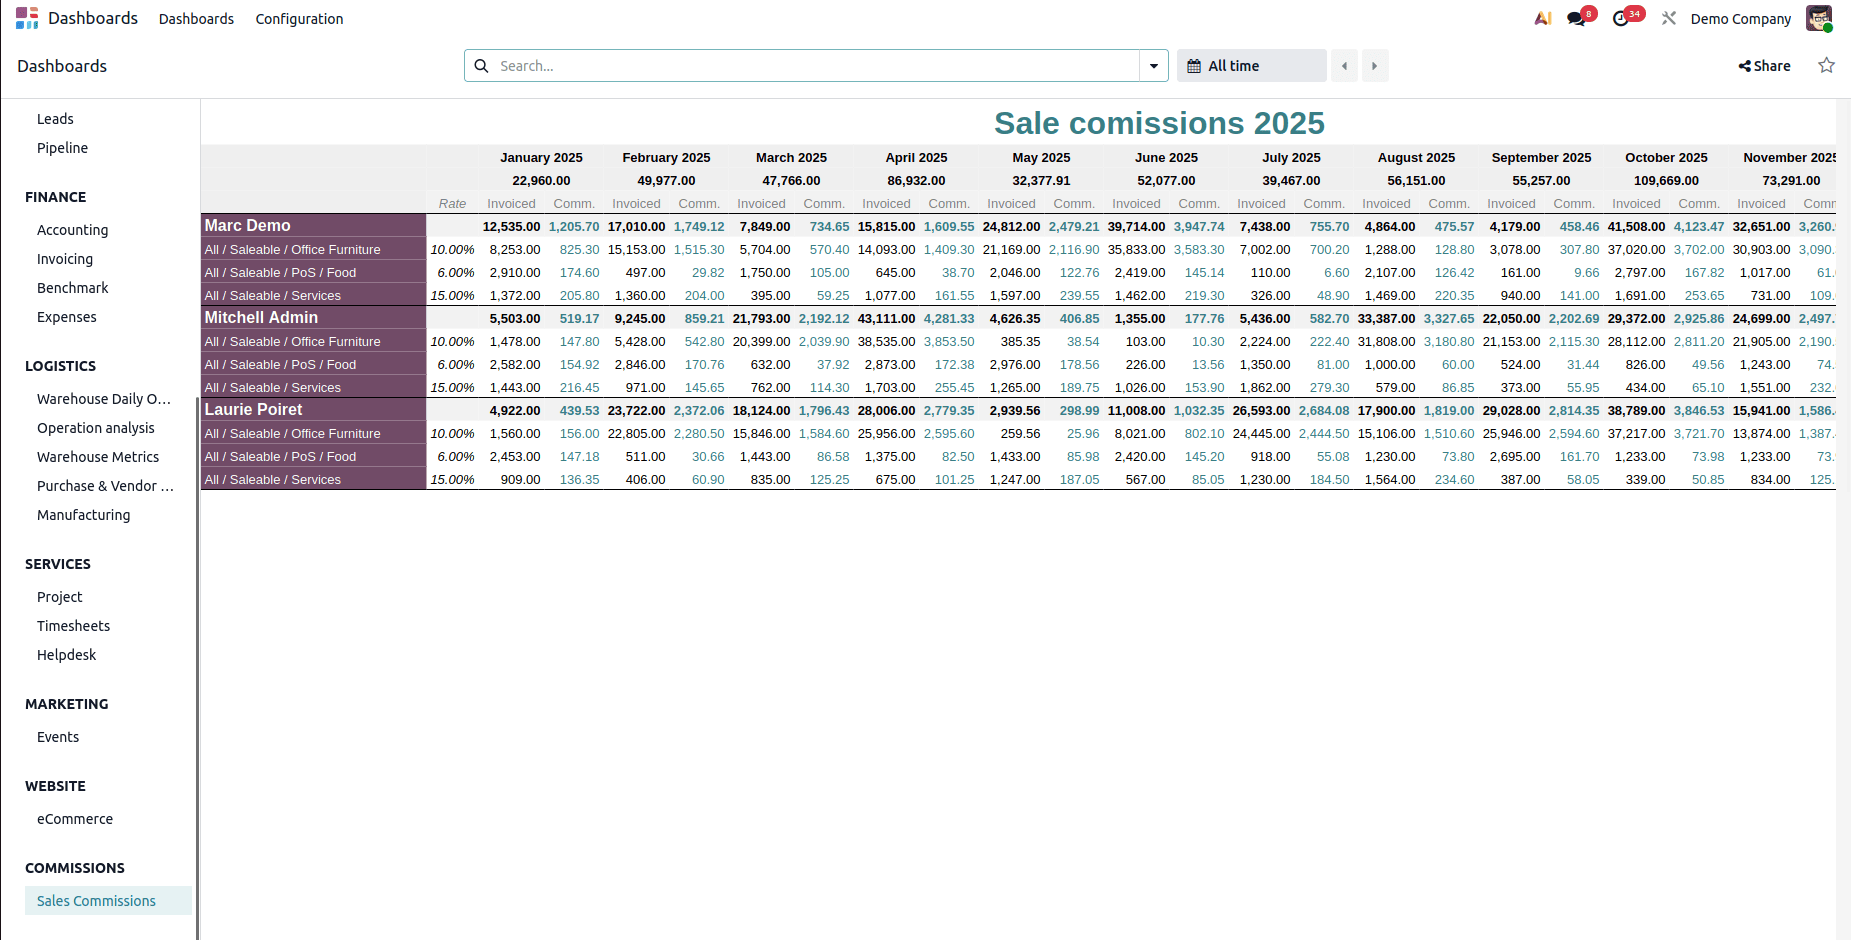
After completing the spreadsheet setup, you can go back to the main dashboard view to see your newly created dashboard listed. It will be ready for use, showing the data and layout you configured.
Creating a Dashboard with a Blank Spreadsheet
For those who want to create a dashboard from scratch, Odoo allows you to start with a completely blank spreadsheet. This method is perfect for businesses with unique reporting requirements that don’t align with the standard templates. In the dashboard creation form, click Add a Spreadsheet and then select the Blank Spreadsheet option in the wizard.
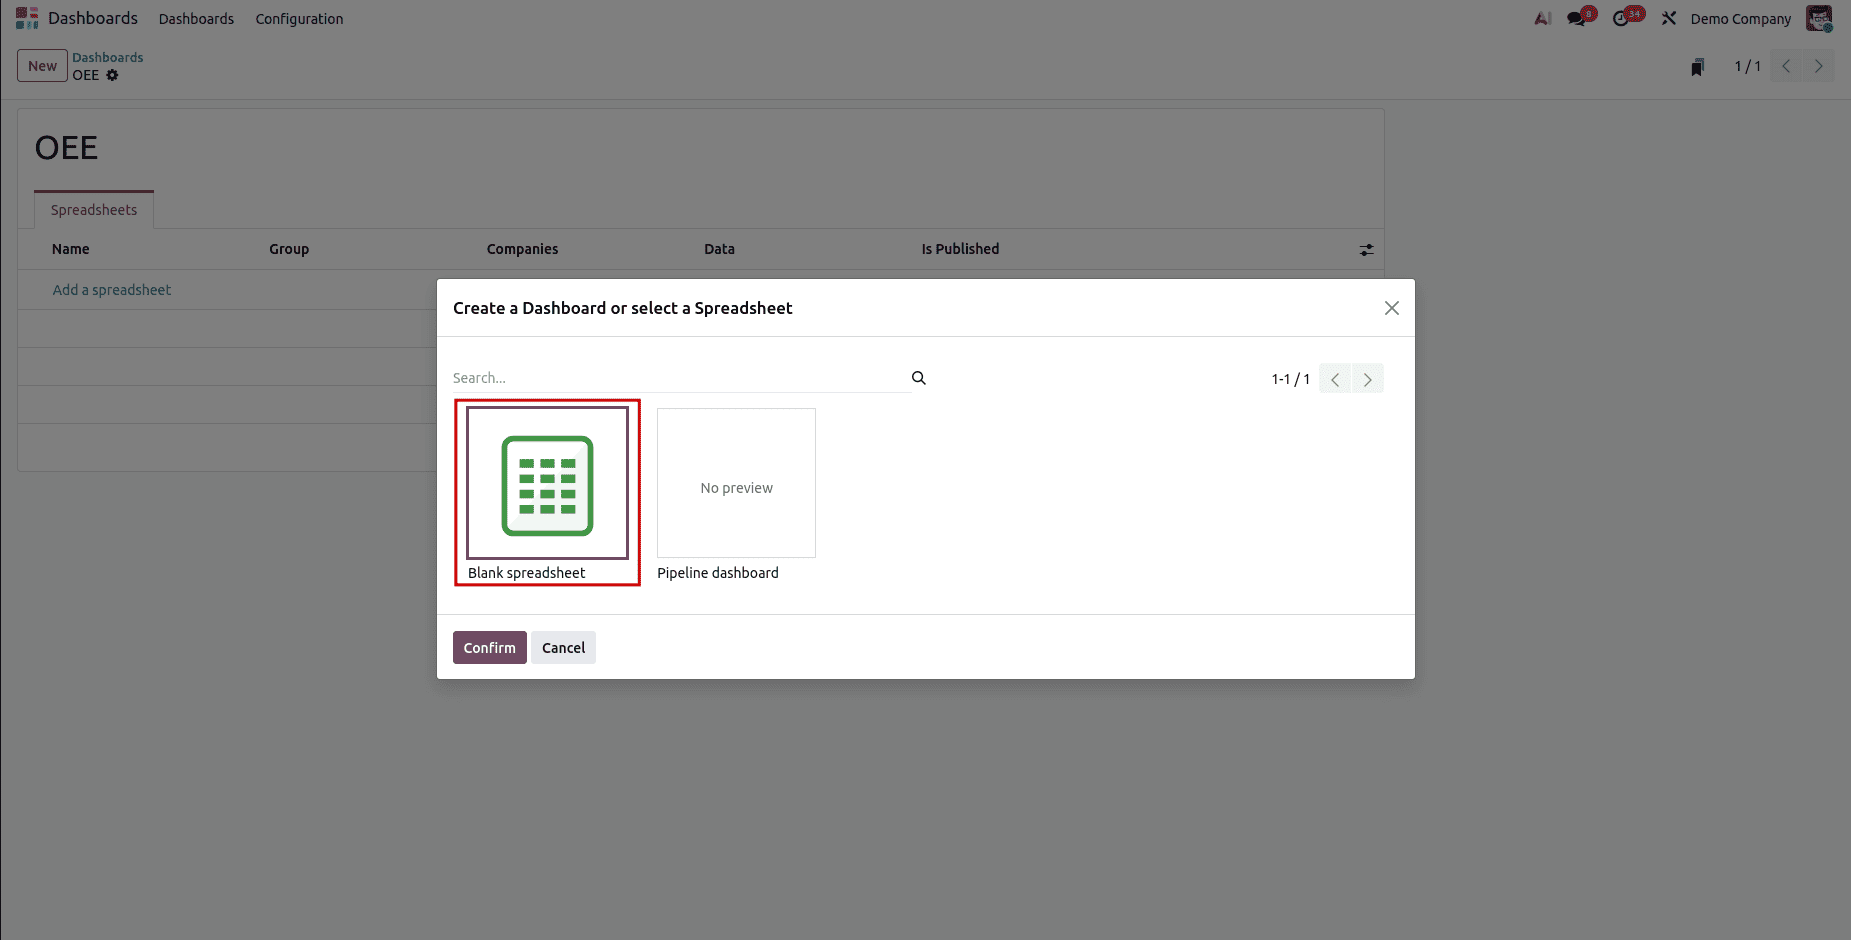
Odoo will then present a fully blank spreadsheet, allowing you to input your own data, formulas, and visual elements with complete freedom, without any predefined layout.
A blank spreadsheet gives you full flexibility to design your reports exactly the way you need. You can add rows and columns, apply custom styles, build charts, and use advanced functions for complex calculations. Because the spreadsheet is tightly integrated with Odoo, it can fetch live data from multiple modules, keeping your dashboard up to date at all times. For instance, you might create a report showing weekly sales figures, current inventory levels, and pending customer invoices all refreshed automatically in real time, with no manual data input required.
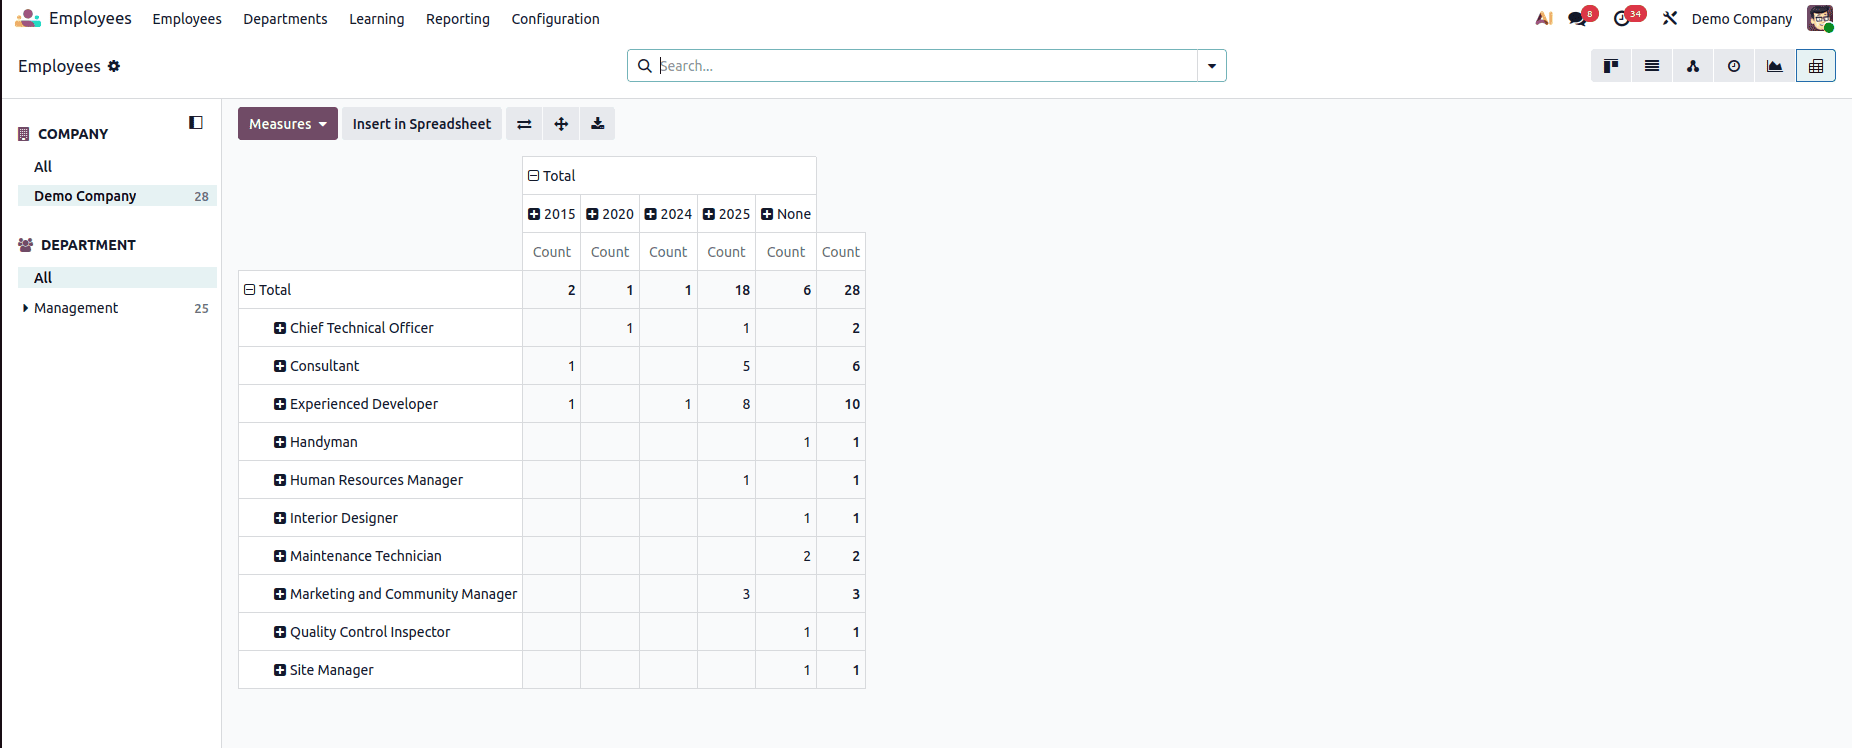
You can also add data to the dashboard directly from a pivot view. For example, the Employee pivot view can be included in your dashboard by opening the pivot view and selecting Insert in Spreadsheet.
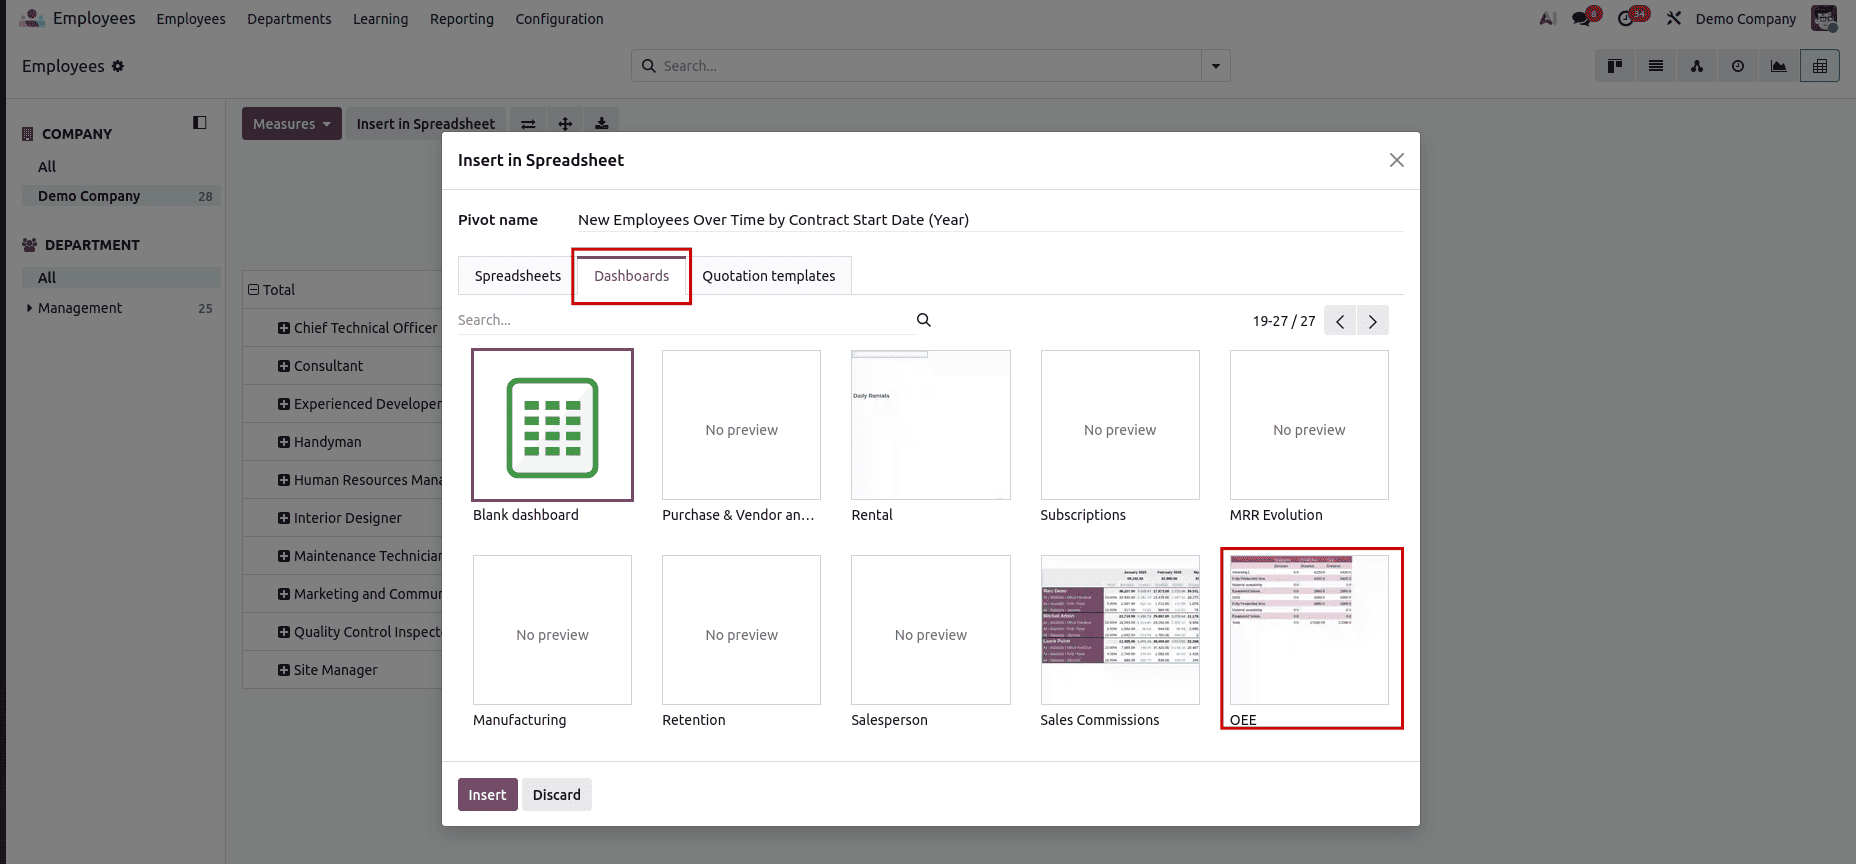
Choosing this option opens a wizard that includes a Dashboard tab. This tab displays all the dashboards you’ve created. Select the dashboard where you want the pivot data to appear, and Odoo will add it directly to the associated spreadsheet. From then on, the pivot information becomes part of the dashboard and updates automatically whenever the source data changes. For instance, adding the Employee pivot view to an HR dashboard allows managers to monitor workforce trends at a glance without switching between different views.
Integrating pivot views into dashboards helps streamline workflows by bringing all key metrics into a single view. It also minimizes the chance of errors caused by manual data transfers, since updates are handled automatically by the system, keeping the information accurate and consistent.
Overall, the dashboard functionality in Odoo 19 provides a powerful and easy-to-use solution for managing and visualizing business data. You can create dashboards from scratch or enhance them with data from existing views like pivots, allowing complete customization based on your requirements. With real-time data updates and built-in permission controls, Odoo 19 ensures users always have access to accurate information, supporting smarter and faster decision-making across teams.
To read more about How to Configure a Dashboard with Odoo 18, refer to our blog How to Configure a Dashboard with Odoo 18.