Odoo 19 represents a significant evolution in modern enterprise resource planning, delivering a more intuitive user interface, improved system responsiveness, and enhanced customization capabilities. Building on the solid foundation of previous versions, Odoo 19 introduces meaningful improvements across core business modules such as CRM, inventory, sales, and accounting. With stronger analytics, smoother cross-module integration, and smarter automation, businesses can manage operations more efficiently while making faster, data-driven decisions. Designed to grow alongside organizational needs, Odoo 19 provides a scalable and flexible platform that supports long-term business success.
In Odoo 19, views play a critical role in shaping how users interact with business data. Views define the structure and presentation of records, allowing users to access, manage, and analyze information effectively. Odoo supports multiple view types—including list, form, kanban, calendar, pivot, and cohort—each designed to serve a specific purpose within the system. Together, these views create a seamless user experience while guiding users through daily workflows.
Among these, the Pivot View stands out as a powerful analytical tool in Odoo 19. It enables users to summarize large datasets, group records dynamically, and apply aggregate measures such as totals and averages. With built-in filtering, grouping, and sorting options, Pivot views make it easy to uncover trends, compare performance, and gain actionable insights without requiring external reporting tools. This makes Pivot views especially valuable for reporting, decision-making, and performance analysis across departments.
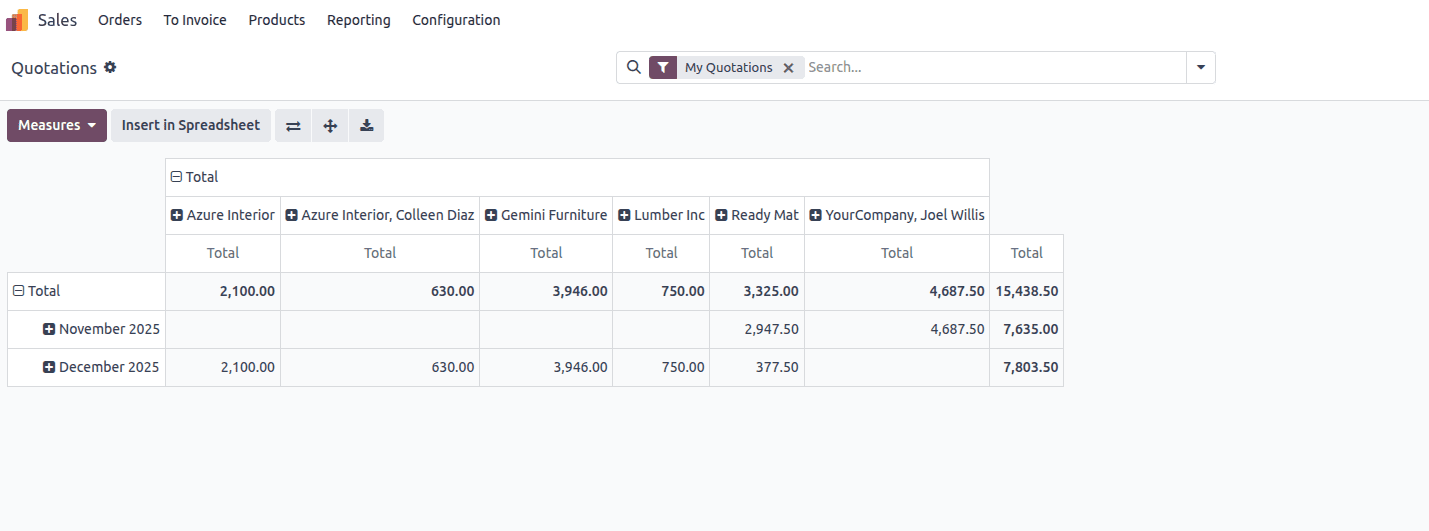
The image illustrates a Pivot view in Odoo 19 that presents analytical data for sales orders.
To build a pivot view in Odoo 19, the initial step is to design a new model that contains the key fields you want to analyze. These fields act as the dimensions and measures within your pivot table, allowing you to slice and aggregate your data effectively.
For instance, consider a model called student.performance. This model includes fields such as student_id, subject, date, status, and marks. By setting student_id as the record’s display name with _rec_name = 'student_id', the model organizes student performance data, including exam dates, subjects taken, scores obtained, and pass/fail outcomes. This setup provides a clear foundation for creating insightful pivot views based on student exam results.
from odoo import models, fields
class StudentPerformance(models.Model):
   _name = 'student.performance'
   _description = 'Student Performance'
   _inherit = ['mail.thread', 'mail.activity.mixin']
   _rec_name = 'student_id'
   student_id = fields.Many2one('student', string='Student')
   subject = fields.Selection([
       ('math', 'Mathematics'),
       ('sci', 'Science'),
       ('eng', 'English'),
       ('hist', 'History'),
       ('geo', 'Geography'),
   ], string='Subject')
   date = fields.Date(string='Exam Date', required=True)
   status = fields.Selection([
       ('pass', 'Pass'),
       ('fail', 'Fail')
   ], string='Status', required=True)
   marks = fields.Float(string='Marks', required=True)
To enable a Pivot view for this model, you must configure two XML components. The first defines the Pivot view layout itself, specifying the fields used for analysis. The second creates a window action that links the model to its available views, allowing users to access the Pivot view from the Odoo interface.
<!-- Action -->
<record id="action_student_performance" model="ir.actions.act_window">
   <field name="name">Student Performance</field>
   <field name="res_model">student.performance</field>
   <field name="view_mode">list,form,pivot</field>
</record>
This XML defines a window action named “Student Performance” that is linked to the student.performance model. The action determines how records from this model are displayed when users open the menu. By setting the view_mode field to list, form, pivot, the system makes these three view types available, allowing users to browse records in a list, view or edit individual entries in a form, and analyze performance data using a pivot table.
<!-- Pivot View -->
<record id="view_student_performance_pivot" model="ir.ui.view">
   <field name="name">student.performance.pivot</field>
   <field name="model">student.performance</field>
   <field name="arch" type="xml">
       <pivot>
           <field name="student_id" type="row"/>
           <field name="subject" type="col"/>
           <field name="marks" type="measure"/>
       </pivot>
   </field>
</record>
This XML configuration creates a Pivot view for the student.performance model. The <pivot> tag defines the view as a pivot table and serves as the container for its layout. Inside it, student_id is set as a row field, which groups the data by individual students, while subject is defined as a column field to categorize performance by subject. The marks field is declared as a measure, meaning it is the numerical value that will be aggregated and analyzed within the pivot table. Together, these definitions allow users to compare student scores across different subjects in a clear, analytical format.
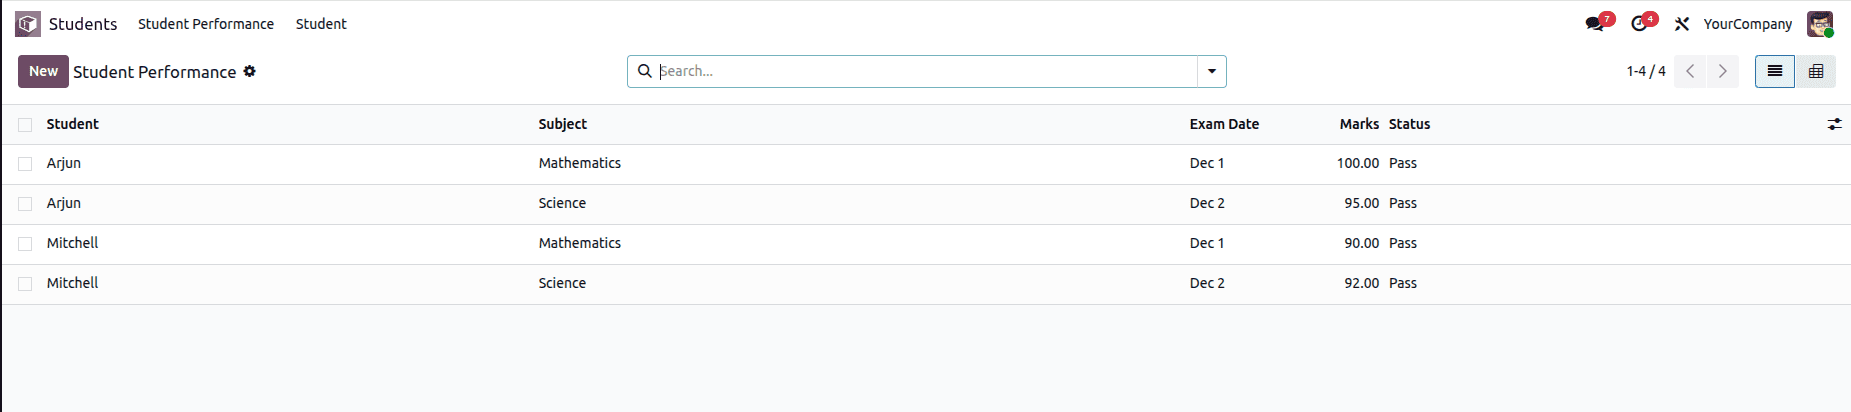
This image shows the List view of the student.performance model, where individual student performance records are presented in a tabular format. Each row represents a single entry, displaying key details such as the student name, subject, exam date, marks obtained, and pass/fail status. This view allows users to quickly scan, sort, and search performance data, making it easy to compare results across students and subjects or open a specific record for further review or editing.
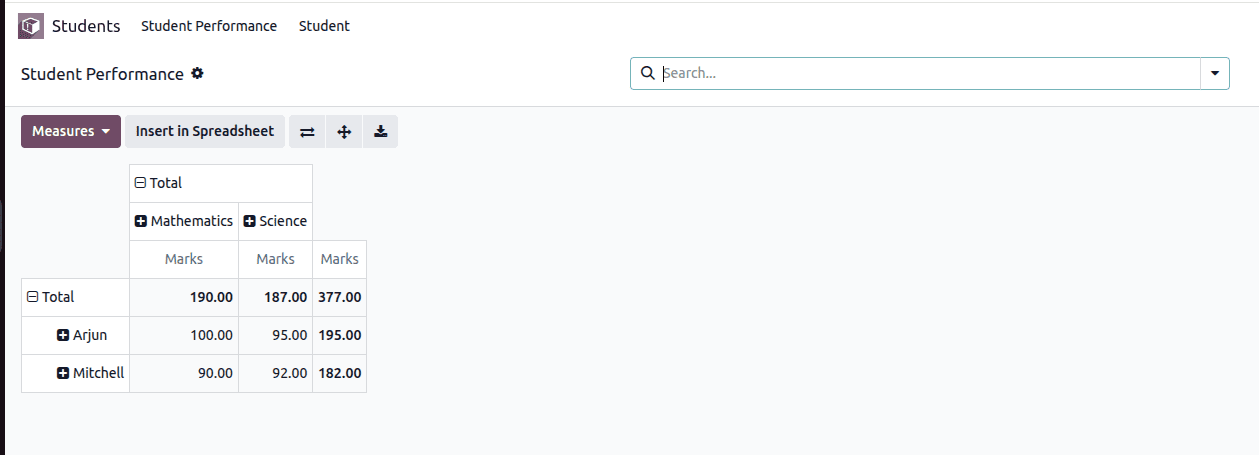
This image illustrates the Pivot view of the student.performance model, which presents student marks in an analytical, summarized format. The data is grouped by student name along the rows and by subject across the columns, while marks are used as the measure for calculation. The pivot table automatically aggregates the marks, showing subject-wise totals as well as overall totals for each student and for all records combined. This view helps users quickly compare academic performance across students and subjects, identify trends, and gain insights that are not easily visible in the list view.
The Pivot view in Odoo 19 makes data analysis more intuitive by transforming detailed records into clear, summarized insights. By grouping information across relevant fields and applying measurable values, users can quickly identify trends, comparisons, and performance patterns. Implementing a Pivot view through proper model design, XML view definitions, and window actions allows complex datasets to be analyzed with ease. Overall, Pivot views serve as an effective tool in Odoo 19 for organizing information, improving data visibility, and supporting informed decision-making.
To read more about How to Create Pivot View in Odoo 18, refer to our blog How to Create Pivot View in Odoo 18.