The Purchase Analysis report in Odoo 19 provides comprehensive statistical insights into products purchased through the Purchase module. This report plays a key role in helping businesses understand and evaluate their procurement activities by presenting detailed data related to purchase orders (POs). It offers visibility into important metrics such as the quantity of products ordered and received, vendor lead times, order processing duration, and overall purchasing performance. By analyzing this data, organizations can identify inefficiencies, monitor trends, and optimize their purchasing strategies.
Analyzing purchase data is essential for improving procurement efficiency and making informed business decisions. Odoo 19’s Purchase Analysis report enables businesses to track supplier performance, assess delivery reliability, and measure how quickly purchase orders are fulfilled. With access to accurate and structured data, purchase managers can reduce delays, improve vendor selection, control costs, and ensure that procurement aligns with operational requirements.
To access the Purchase Analysis report in Odoo 19, navigate to Purchase > Reporting > Purchase. The report presents data in a clear and interactive format, allowing users to filter, group, and analyze purchase information from different perspectives.
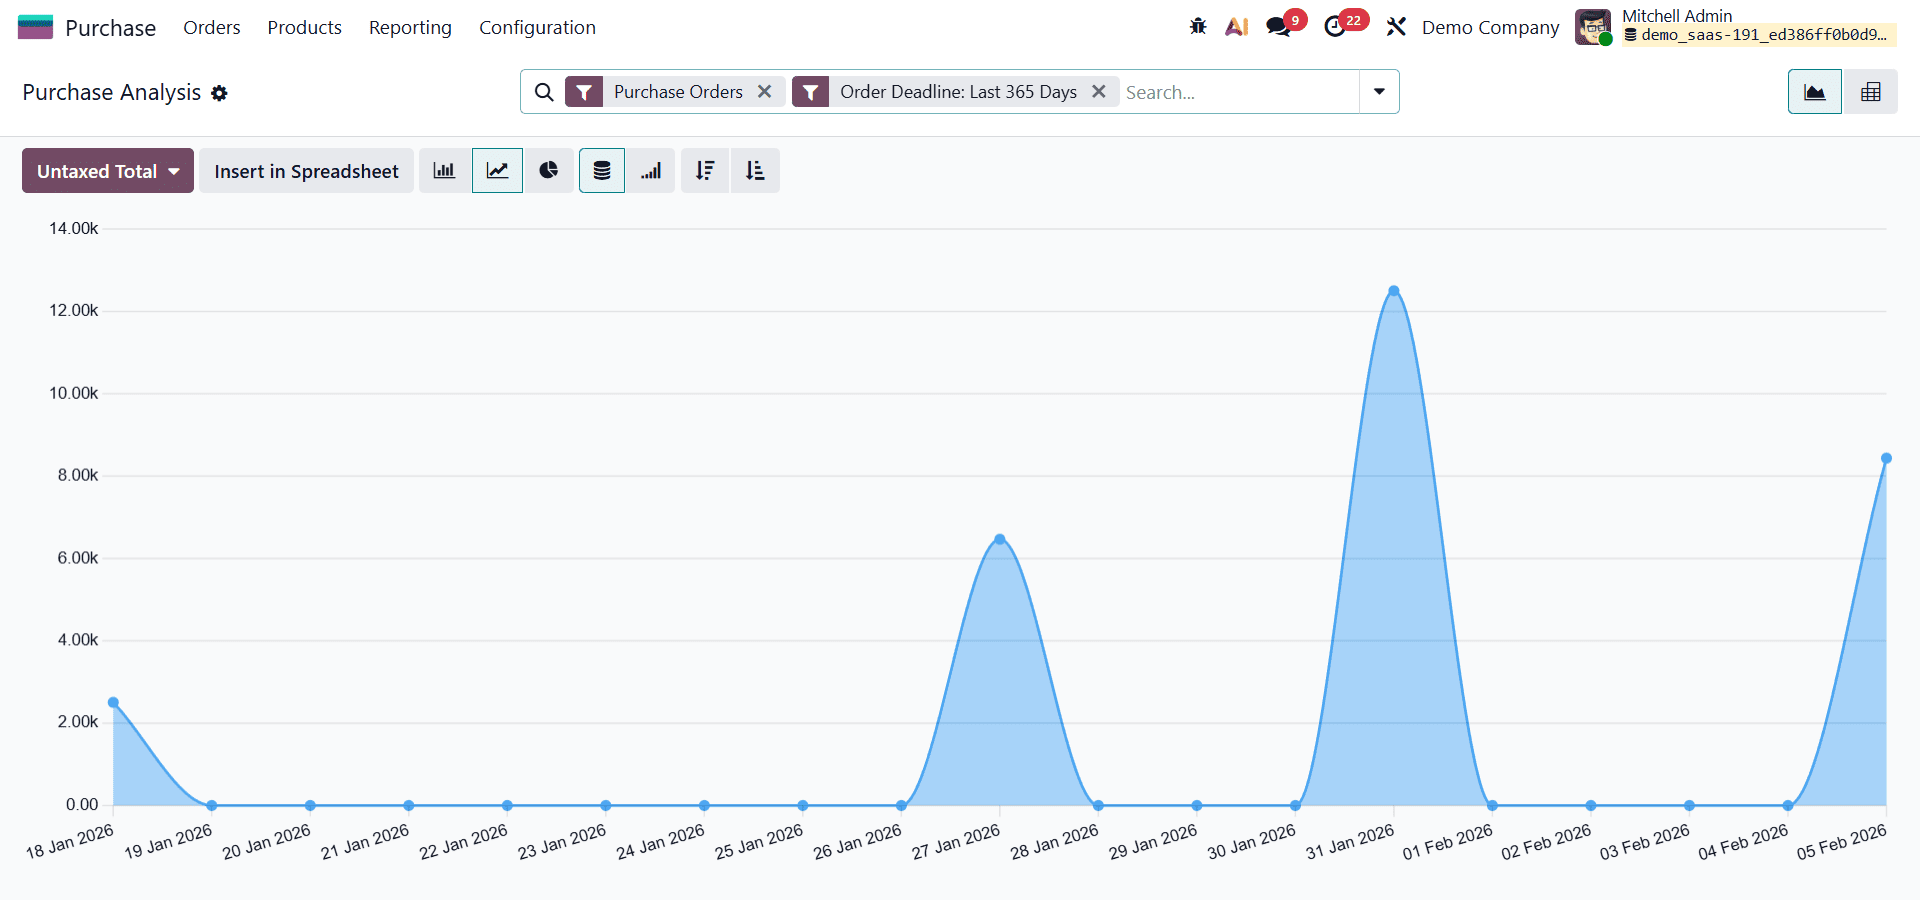
The Line graph in the Purchase Analysis report displays the untaxed purchase totals based on the confirmation dates of purchase orders. The X-axis represents the confirmation dates, showing when each purchase order was approved, while the Y-axis reflects the corresponding untaxed amounts.
Measures in Purchase Analysis
In the Purchase Analysis report of Odoo 19, Measures represent the different datasets that can be displayed to analyze purchasing activity. Each measure corresponds to a specific statistic related to purchase orders (POs) or purchased products. Users can select a measure by clicking the Measures button in the report toolbar and choosing the required option from the drop-down list. The selected measure determines what data is shown in graphs or tables, allowing users to focus on the most relevant procurement metrics.
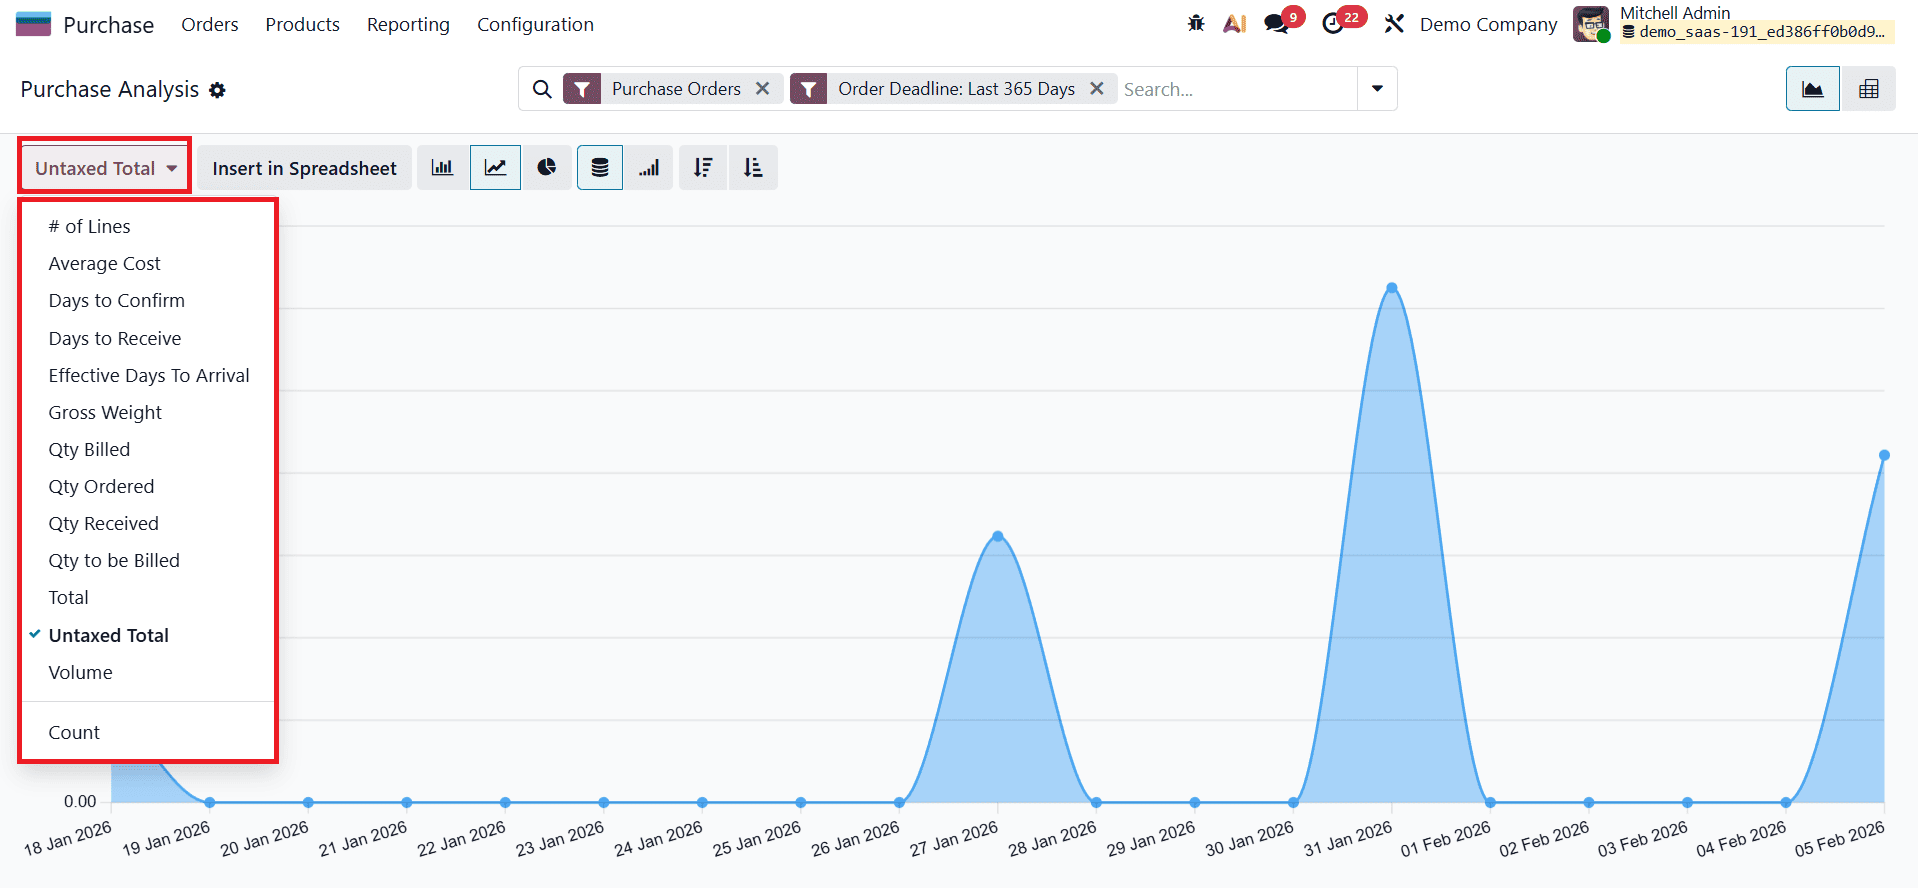
Odoo 19 provides a wide range of measures to support detailed purchase analysis. The # of Lines measure shows the total number of purchase order lines across all POs, helping assess order complexity. Average Cost displays the average value of purchase orders, while Days to Confirm indicates how long it takes to confirm a PO after creation. Days to Receive measures the time taken to receive products after order confirmation, offering insights into supplier lead times and delivery efficiency.
Quantity-based measures give deeper visibility into product movement. Qty Ordered shows the total quantity of products ordered, Qty Received displays how much has been delivered, and Qty Billed indicates the quantity already invoiced by vendors. In contrast, Qty to be Billed highlights quantities that are still pending vendor billing, helping finance and purchase teams track outstanding liabilities. For logistics-focused analysis, Gross Weight and Volume present the total weight and volume of purchased products, which is useful for transportation and storage planning.
Financial performance can be analyzed using Untaxed Total, Total, and Count measures. Untaxed Total, which is selected by default, shows the total purchase amount excluding taxes, while Total includes tax values. The Count measure displays the total number of purchase orders, enabling users to evaluate procurement frequency and workload over a given period.
It is important to note that when using graph views (such as line, bar, or pie charts), only one measure can be selected at a time. However, when switching to the pivot table view, users can select multiple measures simultaneously and apply different group-by criteria across rows and columns.
Advanced Search Bar and Filter Purchase Analysis
Odoo 19 features a powerful Advanced Search Bar integrated across its user interface, designed to help users filter, sort, and organize data efficiently. This compact yet feature-rich tool functions much like a mega menu, offering quick access to advanced analytical options directly from the reporting screens. In the Purchase Analysis report, the advanced search bar significantly enhances usability by allowing users to refine data views without navigating away from the report.
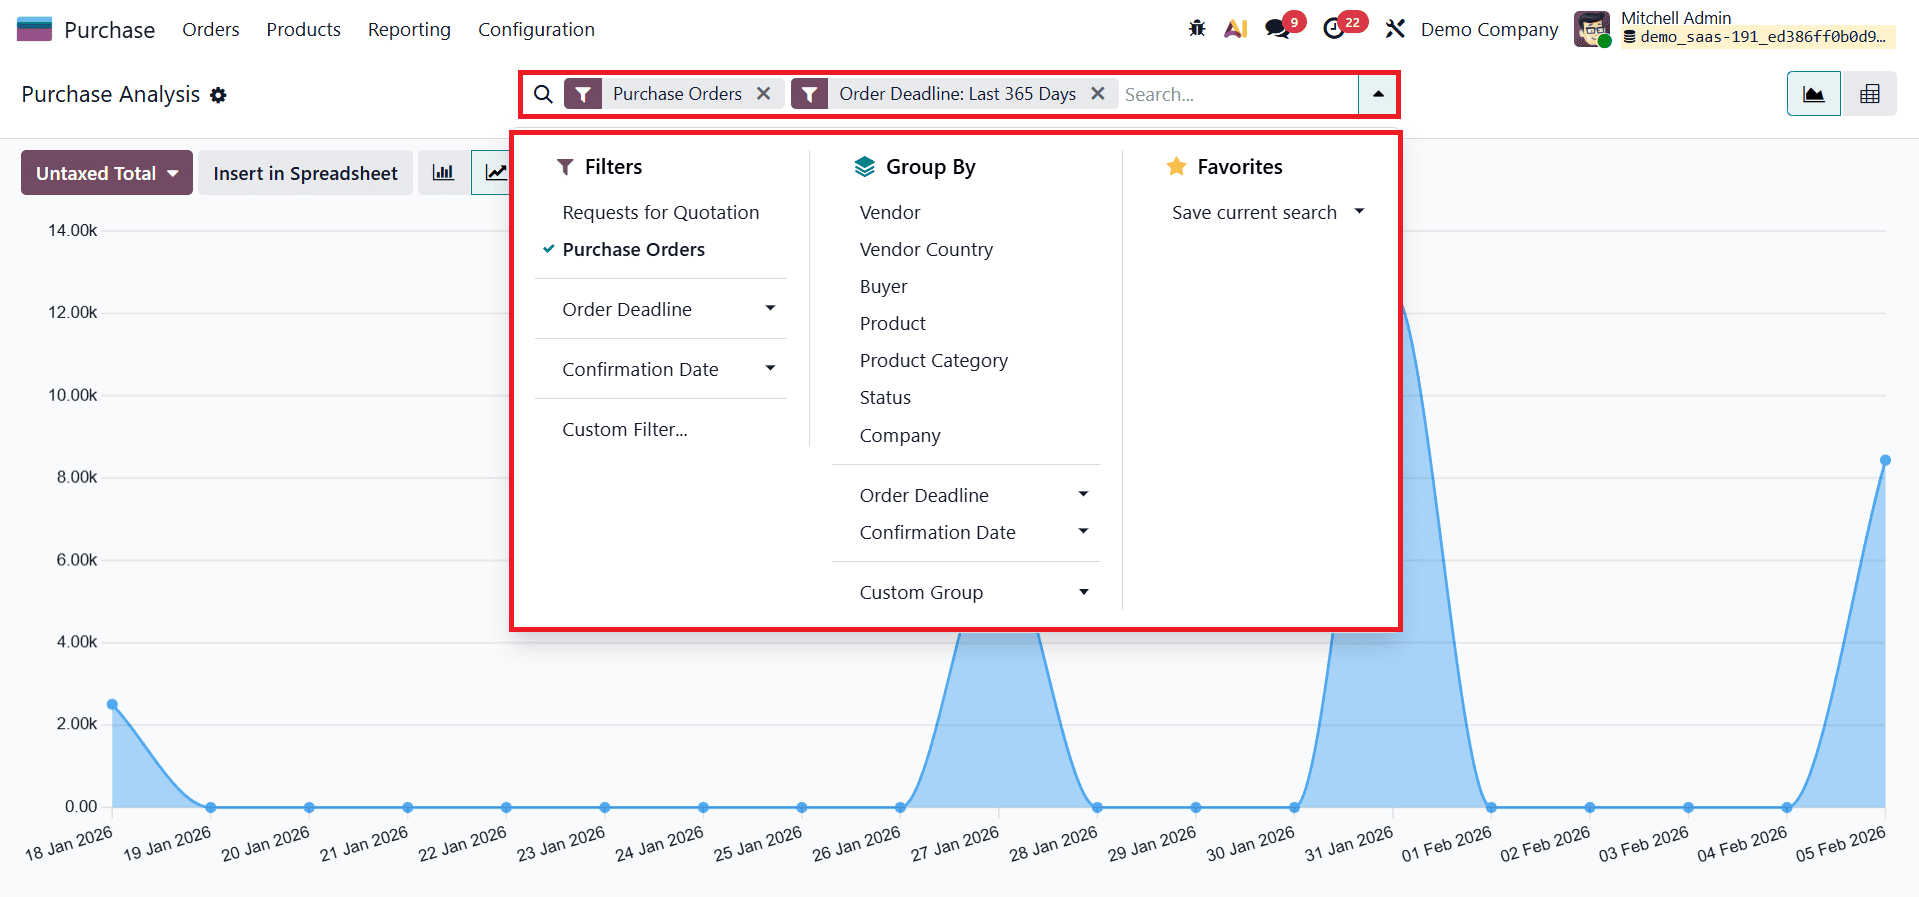
By clicking on the search bar, users can access a detailed drop-down panel that includes several essential functionalities. The Filters option allows users to narrow down report results based on specific conditions, while Group By enables dynamic categorization of purchase data. The Favorites option allows users to save frequently used search configurations for quick reuse.
Using the Filters section, users can refine purchase analysis reports based on criteria such as Requests for Quotation, Purchase Orders, Order Date, Confirmation Date, or Confirmation Date from the Previous Year. For more specific requirements, the Add Custom Filter option enables users to create personalized filters by defining their own conditions. This flexibility allows purchase managers to focus on precisely the data they need for analysis.
The Group By section allows users to organize purchase data using predefined categories such as Buyer, Product, Company, Product Category, Status, Order Date, Confirmation Date, Vendor, Vendor Country, and Purchase Representative. For advanced reporting needs, users can create customized groupings using the Add Custom Group option, enabling deeper insights into purchasing trends and vendor performance. Additionally, frequently used filters and group-by settings can be saved under Favorites, allowing users to quickly apply consistent reporting views without reconfiguring the search options each time.
Views in Purchase Analysis Report
For visual analysis, Odoo 19’s Purchase Analysis report offers multiple chart formats that help users interpret procurement data quickly and effectively. These include Bar Charts, Line Charts, Stacked Charts, Cumulative Charts, and Pie Charts. Each chart type serves a different analytical purpose, allowing users to view purchase data from various perspectives. Both Bar and Line charts can be sorted in ascending or descending order, giving users greater control over how trends and values are displayed.
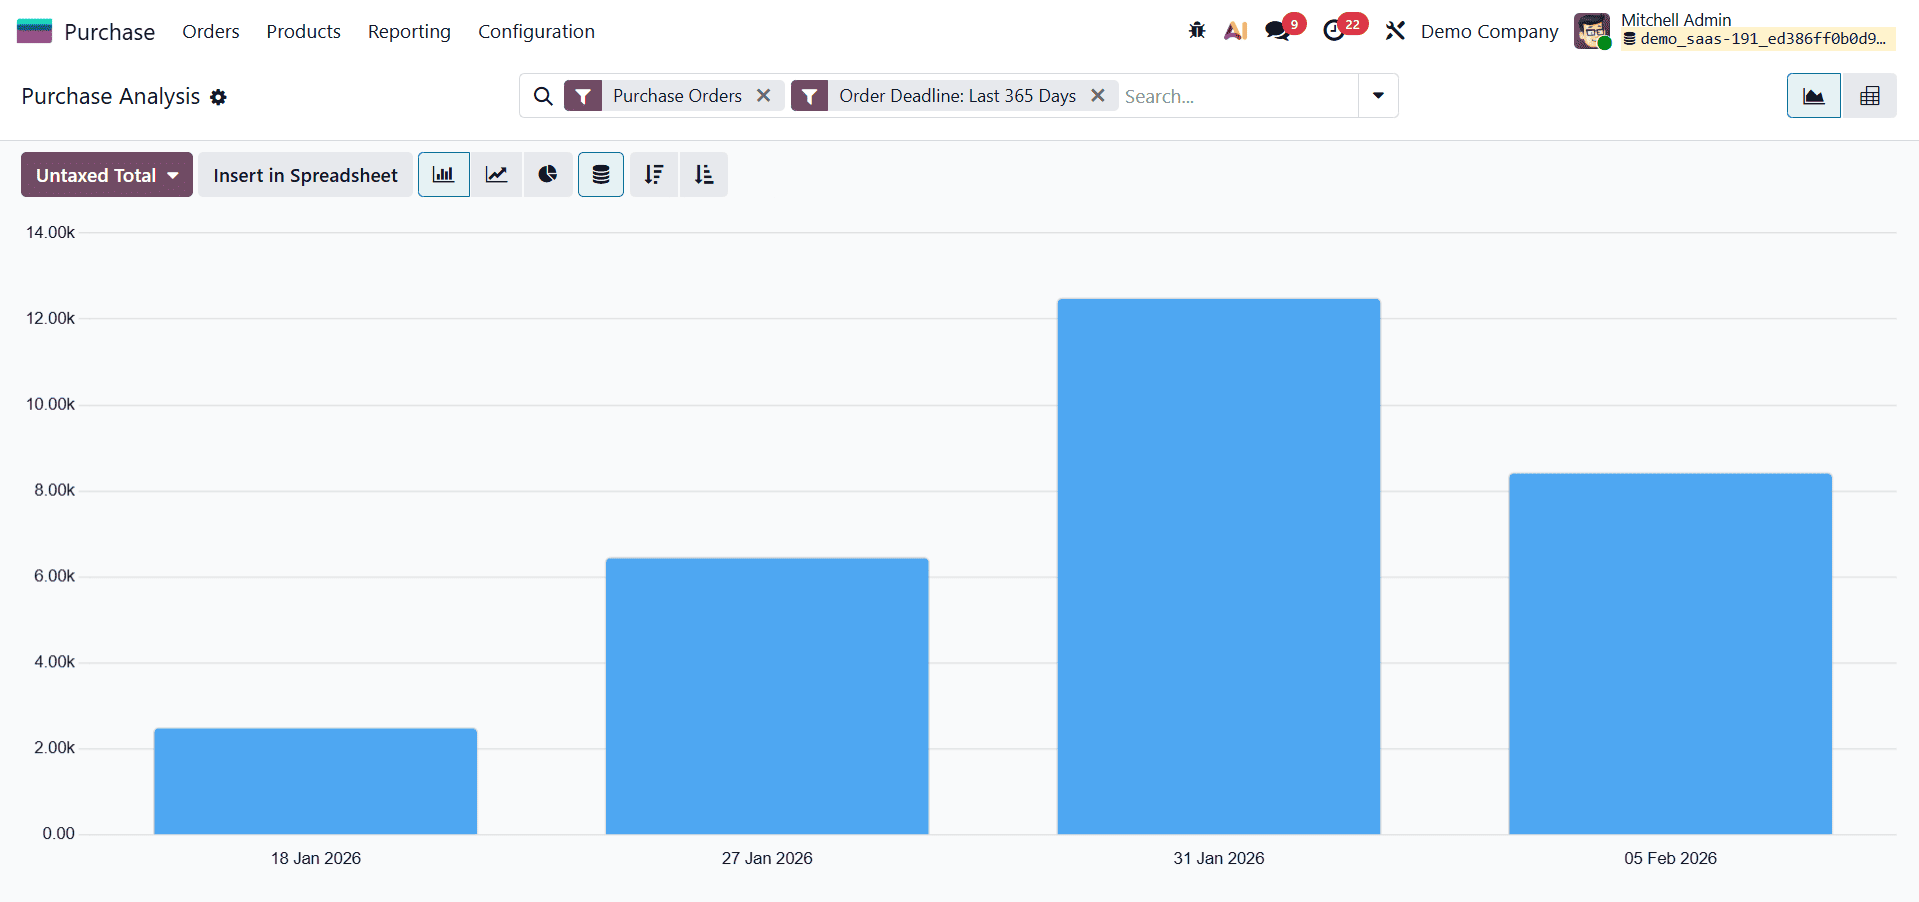
In the Bar Chart view, purchase data is represented clearly using vertical bars, making it easy to compare values across different time periods. For example, when analyzing purchases based on confirmation dates, the X-axis displays the confirmation dates, while the Y-axis shows the untaxed purchase amounts. This visualization helps identify spending patterns, peak purchasing periods, and fluctuations in procurement activity over time.
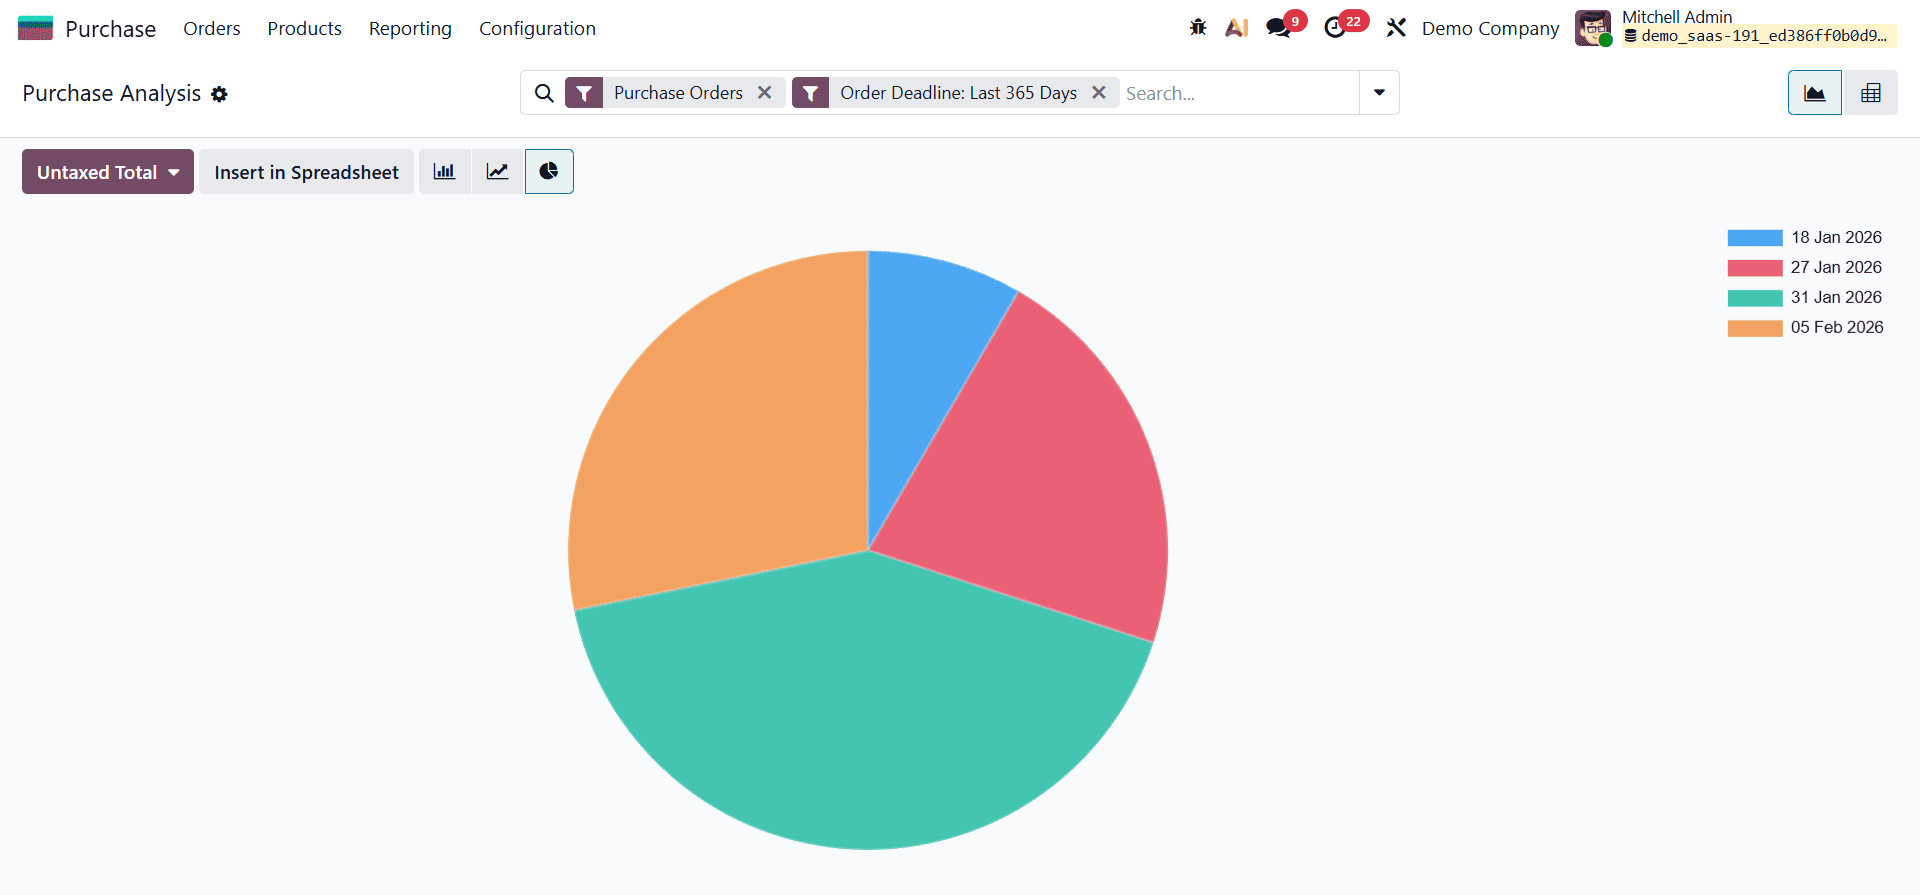
The Pie Chart view presents purchase data as proportional segments, offering a quick snapshot of how purchase values are distributed across vendors, products, or time periods. This view is particularly useful for understanding contribution ratios, such as which vendors or categories account for the largest share of purchasing expenses.
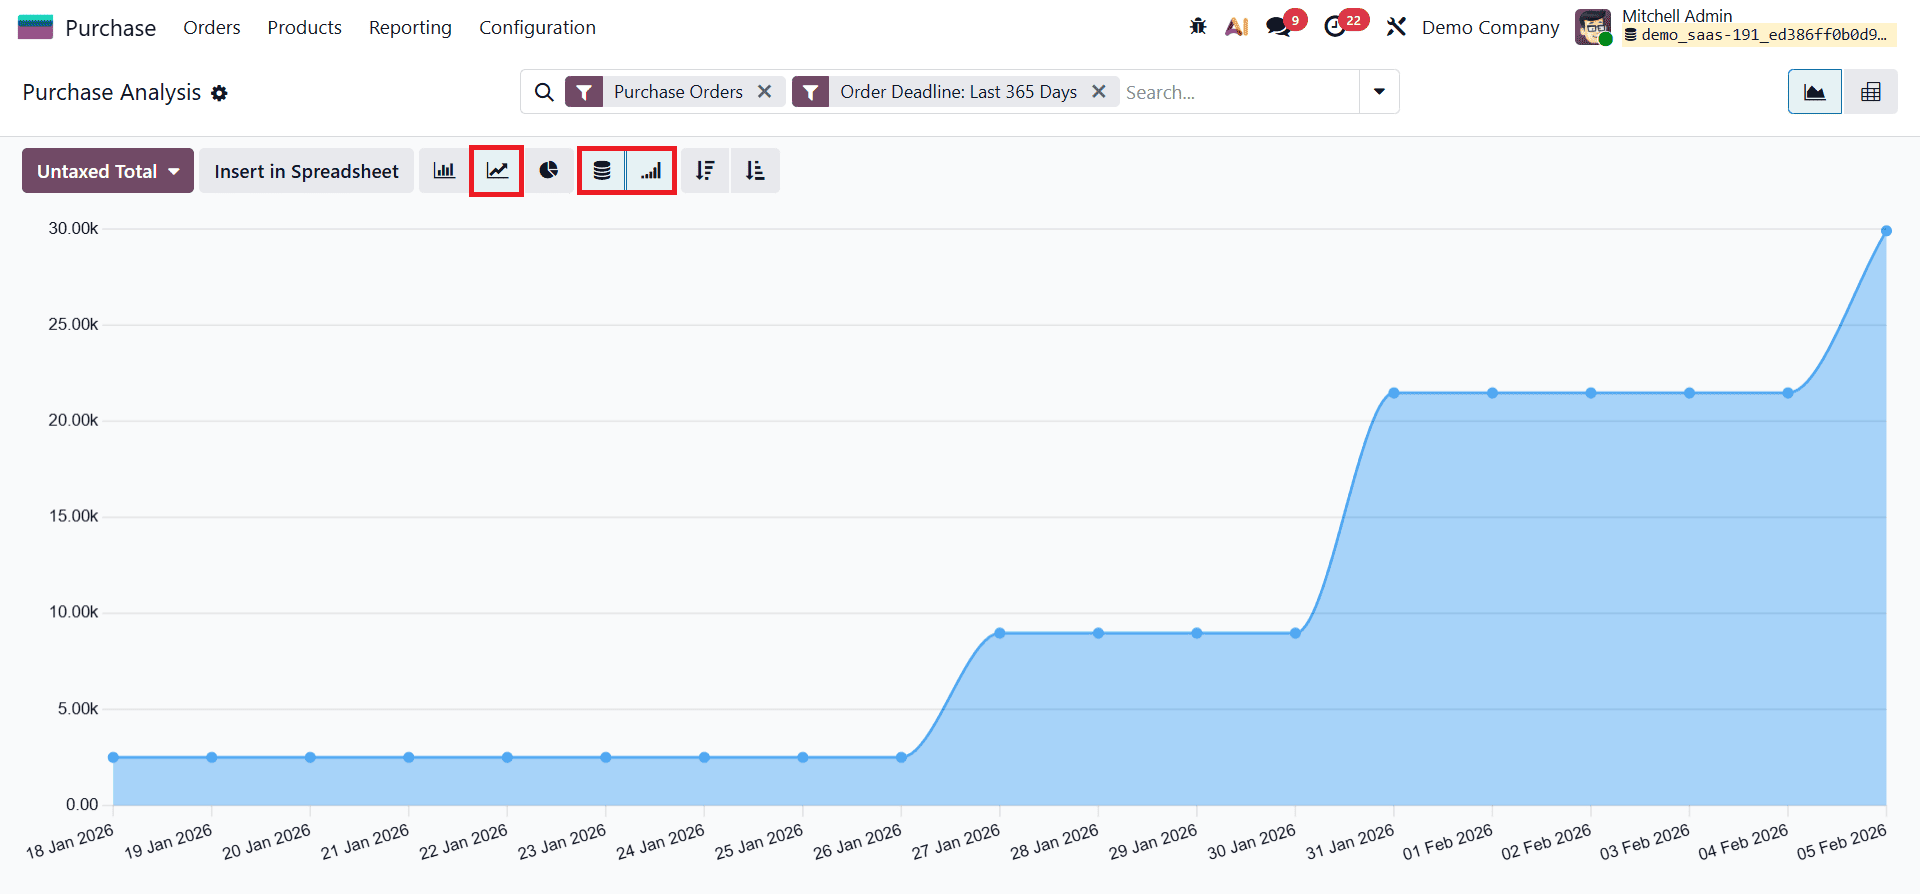
Odoo 19 also supports Line Charts with stacked and cumulative display options. A stacked line chart allows users to compare multiple datasets layered together, making it easier to observe how different components contribute to total purchases. The cumulative line chart, on the other hand, displays progressive totals over time, helping users track growth trends and overall purchasing accumulation during a selected period.
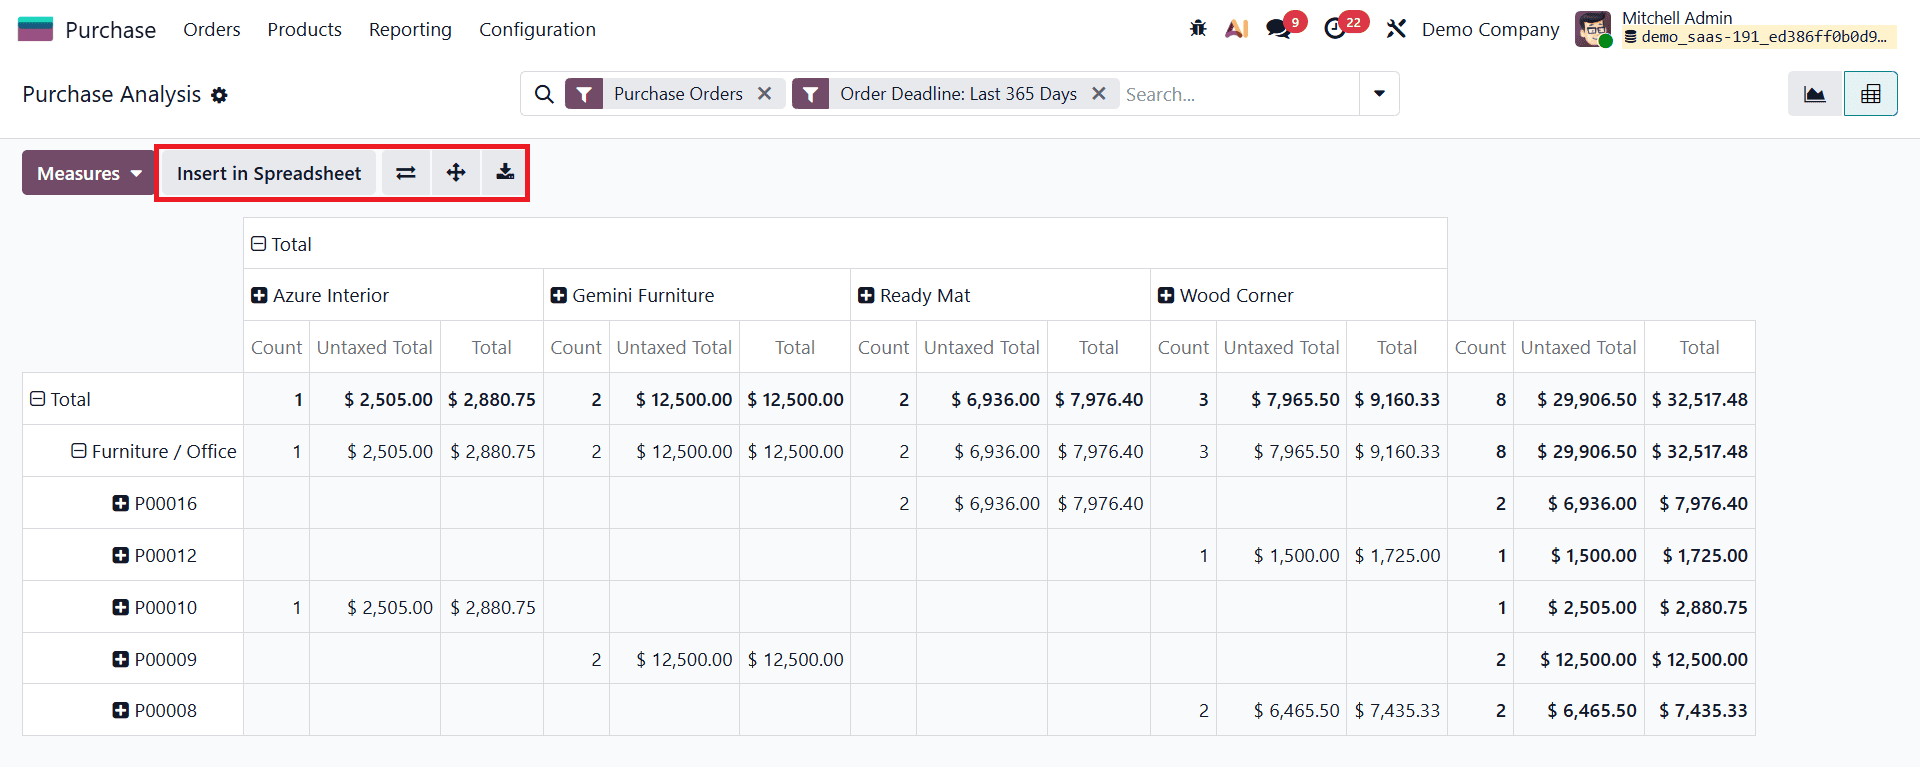
For users who require a more detailed, data-centric view, selecting the Pivot icon opens the Pivot Table view of the Purchase Analysis report. This view organizes purchase data into rows and columns with selectable measures, offering a structured and highly flexible way to analyze procurement statistics. Users can expand, collapse, and rearrange fields to drill down into specific details such as vendor-wise purchases, product categories, or confirmation dates.
The Pivot View in Odoo 19 enables deeper analysis by allowing users to combine multiple measures and grouping criteria within a single table. This makes it especially useful for identifying trends, comparing values, and generating detailed insights that support informed purchasing decisions and strategic procurement planning.
The Purchase Analysis report in Odoo 19 serves as a powerful tool for gaining clear and actionable insights into procurement activities. With its flexible chart views, advanced filtering and grouping options, and detailed pivot table analysis, the report enables businesses to monitor purchasing trends, evaluate supplier performance, and track key metrics with ease. By effectively using these analytical features, organizations can make data-driven purchasing decisions, optimize procurement workflows, control costs, and strengthen overall purchase management in Odoo 19.
To read more about Overview of Purchase Report Analysis in Odoo 18, refer to our blog Overview of Purchase Report Analysis in Odoo 18.