You dispatch your software during a debugging session with the debugger attached to it. The reason for the debugger is to meddle with the execution of the program and provide you with the details about what's going on in the engine. This facilitates the way in your Pycharm to differentiate and correct bugs.
Investigating code in any language may be baffling, yet it is particularly so in Python where we can't perceive a bug right away. What's more, Python gives us the PDB library as an apparatus for investigating, which can likewise be hard to deal with. Fortunately, we have the PyCharm IDE. It utilizes PyDev and gives us another experience of investigating.
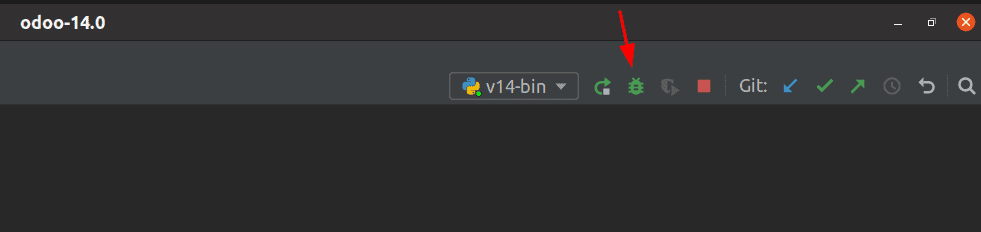
Since the cycle to run and investigate code in PyCharm is comparative, we will see how to troubleshoot code. To troubleshoot code in PyCharm, we need to make another setup in Run?Edit Configuration. Debug a current content by going to Run?Debug.
One of the basic similarities between content being run and debugged is that we need to characterize breakpoints in debugging. In PyCharm, a breakpoint should be on a working code line; it should not be on a simple line or begin with a statement. By tapping the canal on the left, we establish breakpoints.
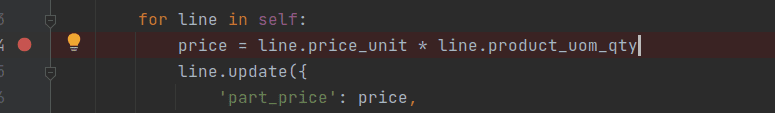
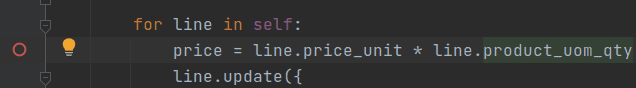
With Alt-clicking on the gutter, we can also establish a temporary breakpoint. As the name indicates, after being reached, a temporary breakpoint will be eliminated. Notice that the symbol for the temporary breakpoint varies from the standard one.
There are several of the buttons in the debug tool window that we saw in the Run tool window, allowing us to pause, stop, and rerun the script. Furthermore, in Run View Breakpoints, we can also view the breakpoints and mute (disable) all breakpoints.
In Run -> View Breakpoints, we can see all of the breakpoints... We can add, erase, or edit breakpoints from here, and set conditional breakpoints and log messages or phrases.
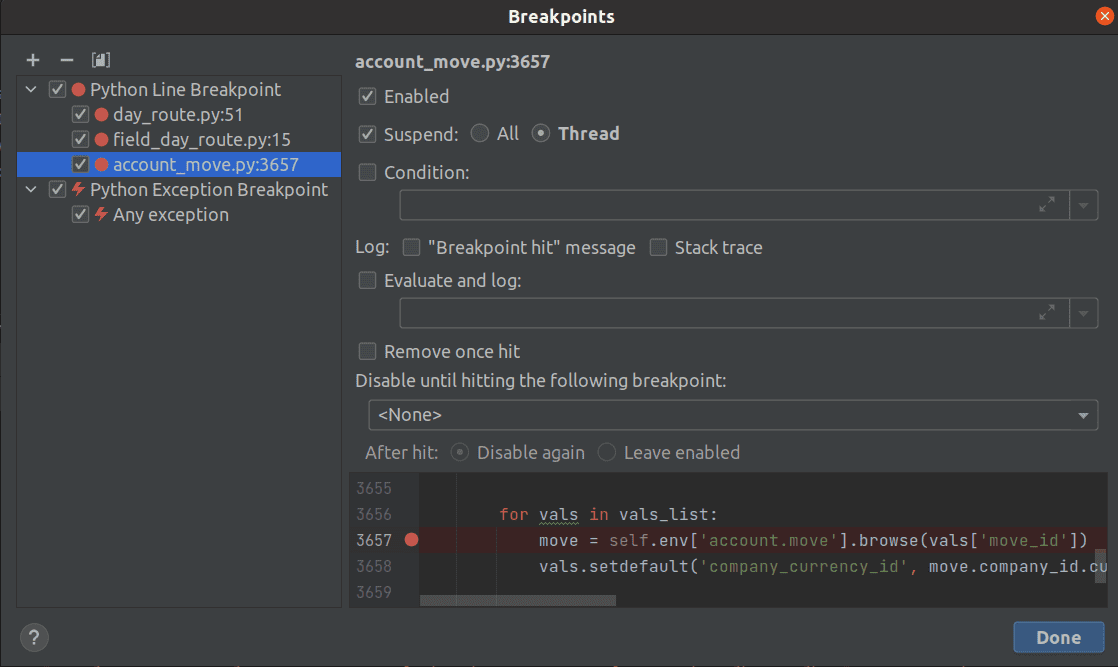
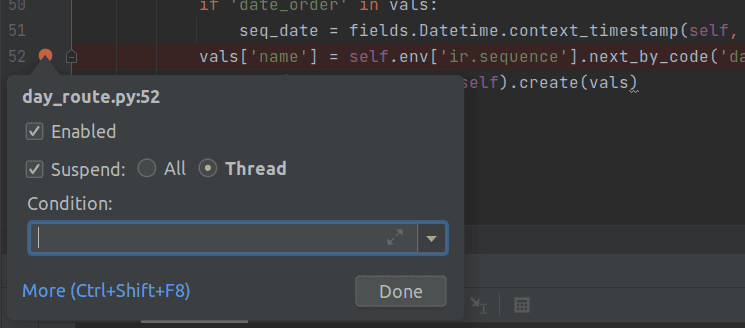
One way to edit a breakpoint easily is by right-clicking on the gutter breakpoint. A popup will allow us to trigger and add a condition to the breakpoint.
Start the Debugger Session?
In normal mode, starting a debugger session is very close to that of the application. Behind the scenes, the debugger is connected, so you don't have to configure something special to begin a debugger session. You will also be able to debug it using the same setup if you are able to run your software from PyCharm. – Whenever you debug a program what you should know is that the session works based on a run/debug configuration. Thus, before the software, you can configure PyCharm to use any parameters and perform any acts.
Pause/Resume/Restart a debugger session?
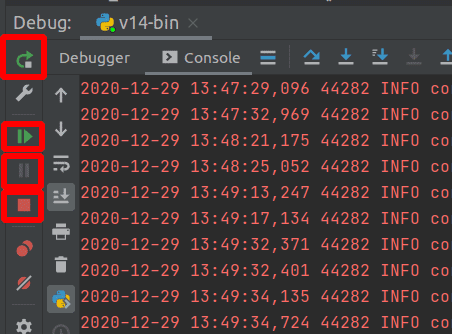
You may use the buttons on the toolbar of the Debug tool window while the debugger session is running, to pause/resume it as required:
- To pause a debugger session, from the left side of the Debug tool window, click the Pause button.
- Click the resume button or F9 to resume the debugger session.
- In the Debug Tool window, click the Restart button or press Ctrl+F5 to restart the debugger session.
- In the Debug tool window, press the stop button. Alternatively, press Ctrl+F2 and select the termination procedure.
Steps through the program?
Stepping is the mechanism by which step-by-step program execution is managed.
PyCharm contains a variety of steps. The steps are decided based on the strategy that is used. Here, for example, you can choose between going directly to the next line and entering the methods invoked on your way there.
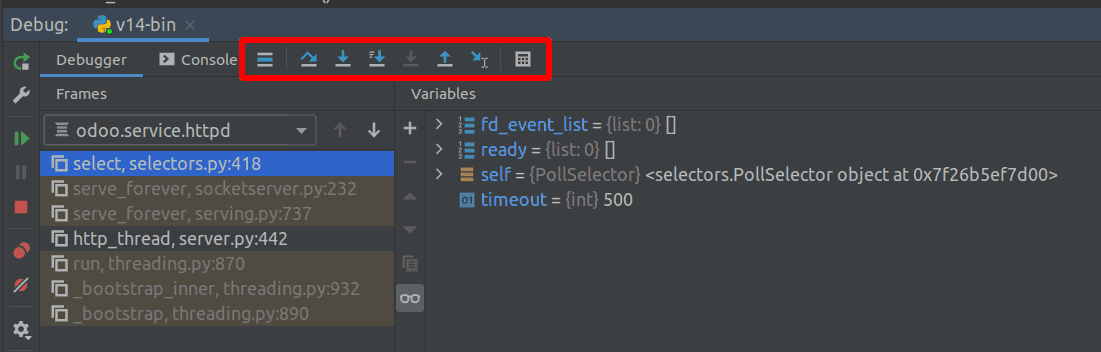
The stepping buttons are on the toolbar of the Debug tool browser.
Step over?
If you are not interested in how a particular function works, you can skip it (the function is still running)—use Step Over command F10, which is also available in the Run menu and in the Debug window.
Run the current statement and all the functions that it calls, and then stop before the next statement (or at the first breakpoint on the way, if any).If the skipped methods have breakpoints within them, the debugger will interrupt them. Using Force Step Over to avoid any breakpoints on the way.
Step into?
Stop the first statement of the first function called from the current line. If a function called from the current line needs to be debugged, you can use the Step Into command F11 to step down to the call chain, which is available in the Run menu and the Debug window.
Here what we should know is the debugger will always set the execution pointer to the first statement of the first function. This will help the first function to be called from the current line. If no function is called, the debugger will move to the next statement.
By default, Pycharm allows external-source debugging, which means that it will automatically decompile when you enter library code and the debugger will move the execution point there.
If you want the debugger to ignore the library code, you can disable external source debugging—clear Enable external source debug on the Build, Run, Deploy | Debugger page of the Pycharm Ctrl+Alt+S settings page.
Some scripts are skipped to Step as you don't normally need to debug them. Fine-tune this list in the Build, Execute/ Deploy —> Debugger —> Page Settings/Preferences dialogue Ctrl+Alt+S.
1. In File—> Settings or Ctrl+Alt+S then Go to Build/Execute/ Deploy —> Debugger —>Stepping. Opens the Debugger Stepping page.
2. To skip all library scripts, click the Do Not Step into Library scripts Checkbox.
3. Select Do not step into scripts checkbox, and use the buttons on the toolbar to create a list of such scripts.
Step into my code?
Want to concentrate on your own code when you are debugging? Prefer to prevent the debugger from stepping into library classes? Check this.
- Click the Step Into My Code button or press the Alt+Shift+F7 button.
Force step over
As Step Overdoes, step to the next statement, but also ignore all breakpoints in the called methods if any.
If a function you want to move over includes breakpoints, if the corresponding statements are executed, the debugger will stop at those breakpoints. You can force the debugger to skip breakpoints inside the Force Step Over Force Step Over command Alt+Shift+F8, which is also available in the Run menu and in the Debug window.
Force step into?
Steps in the process even though the standard Step Into skips this technique.
- Click the Force step button or press Alt+Shift+F7.
Step out?
Run the current function to the end and stop at the statement that follows the call function in the caller context (or at the first breakpoint on the way, if any). Steps out of the current method and takes you to the caller method.
- Click the Step out button or press Shift+F8.
Run to cursor?
As an alternative to setting a breakpoint to a specific statement, resuming the program, and then waiting for the breakpoint to hit, you can tell the debugger to just run to that statement with the Run to Cursor Run to Cursor command Ctrl+F10, which is also available in the Run menu and in the Debug window.
- You can configure whether you want Run to Cursor to work by clicking a line number in Settings/Preferences | Build, Run, Deploy | Debugger.
Opening the Debug Console?
Taking advantage of the main IDE features, such as code completion, code analysis, and fast fixes, is the main reason for using the Python console within PyCharm. The Debug Console allows the output and error messages to be displayed. You can make the command prompt accessible as an alternative. PyCharm launches the debug console when you start the debugging session.
The console is interactive: it displays prompts where you can type, execute, and replay the results of commands:
An interactive console allows you to:
- In the lower pane of the console, type commands and press Enter to execute them. In the upper pane, results are shown.
- Using Ctrl+Space simple code completion and Tab completion.
- Using the Up and Down arrow keys to scroll through the command history and execute the commands you need.
- Load the source code into your console from the editor.
- Use the upper pane's context menu to copy all outputs to the clipboard, compare them to the current clipboard content, or delete all outputs from the console.
- Use the buttons on the toolbar to monitor a console session.