Today, project management involves more than just task delegation. To keep things on track and clients happy, you need to follow progress closely and respond quickly when something goes off course. Odoo 18 makes this easier with helpful reporting tools. These tools let project managers see how things are going, spot issues early, and make better decisions. In this blog, we’ll take a closer look at two important project reporting features in Odoo 18.
Odoo 18 provides robust task analysis features that help you understand how projects and team members are performing over time. Odoo’s Task Analysis report offers a powerful way to visualize task progress, time management, and team performance. To begin, open the Project app from the Odoo dashboard. Once inside, you'll find a menu at the top of the screen—click on Reporting, and from the dropdown, select Tasks Analysis. This will bring you to a dynamic view of all task-related data across your projects.
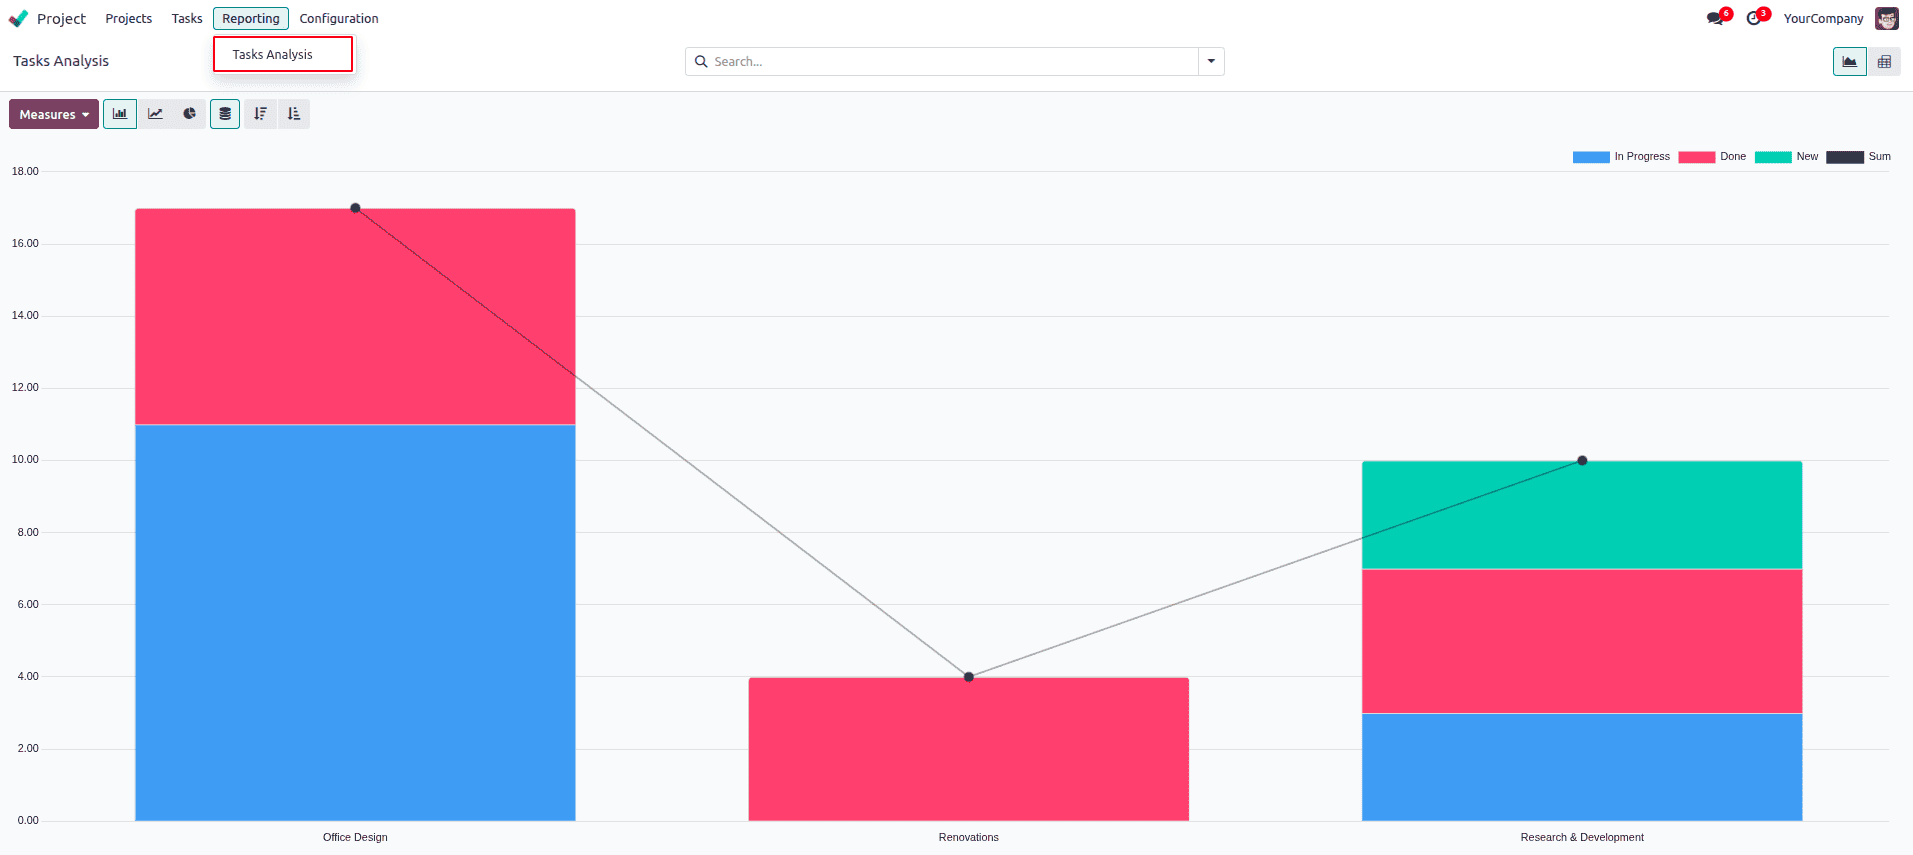
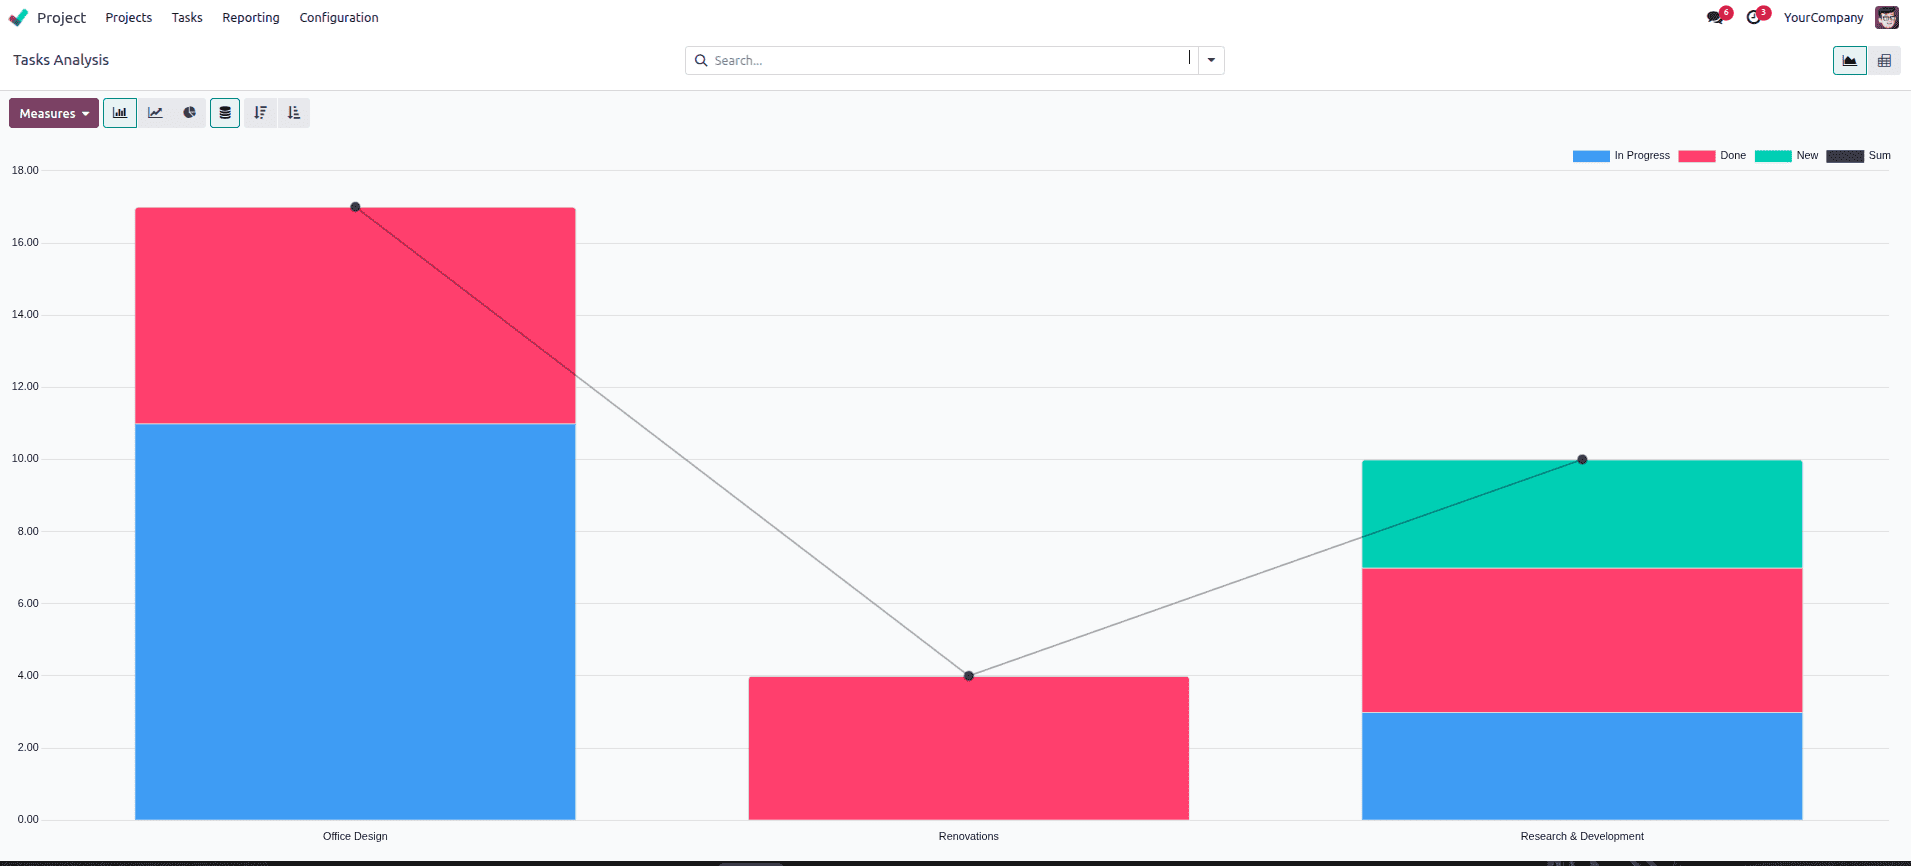
When you first open the Task Analysis view in Odoo 18, it displays a Graph view by default, giving you a visual overview of task distribution across different stages, projects, or users.
You can customize this view using filters such as project, assigned user, task stage (like To Do, In Progress, Done), or deadline.

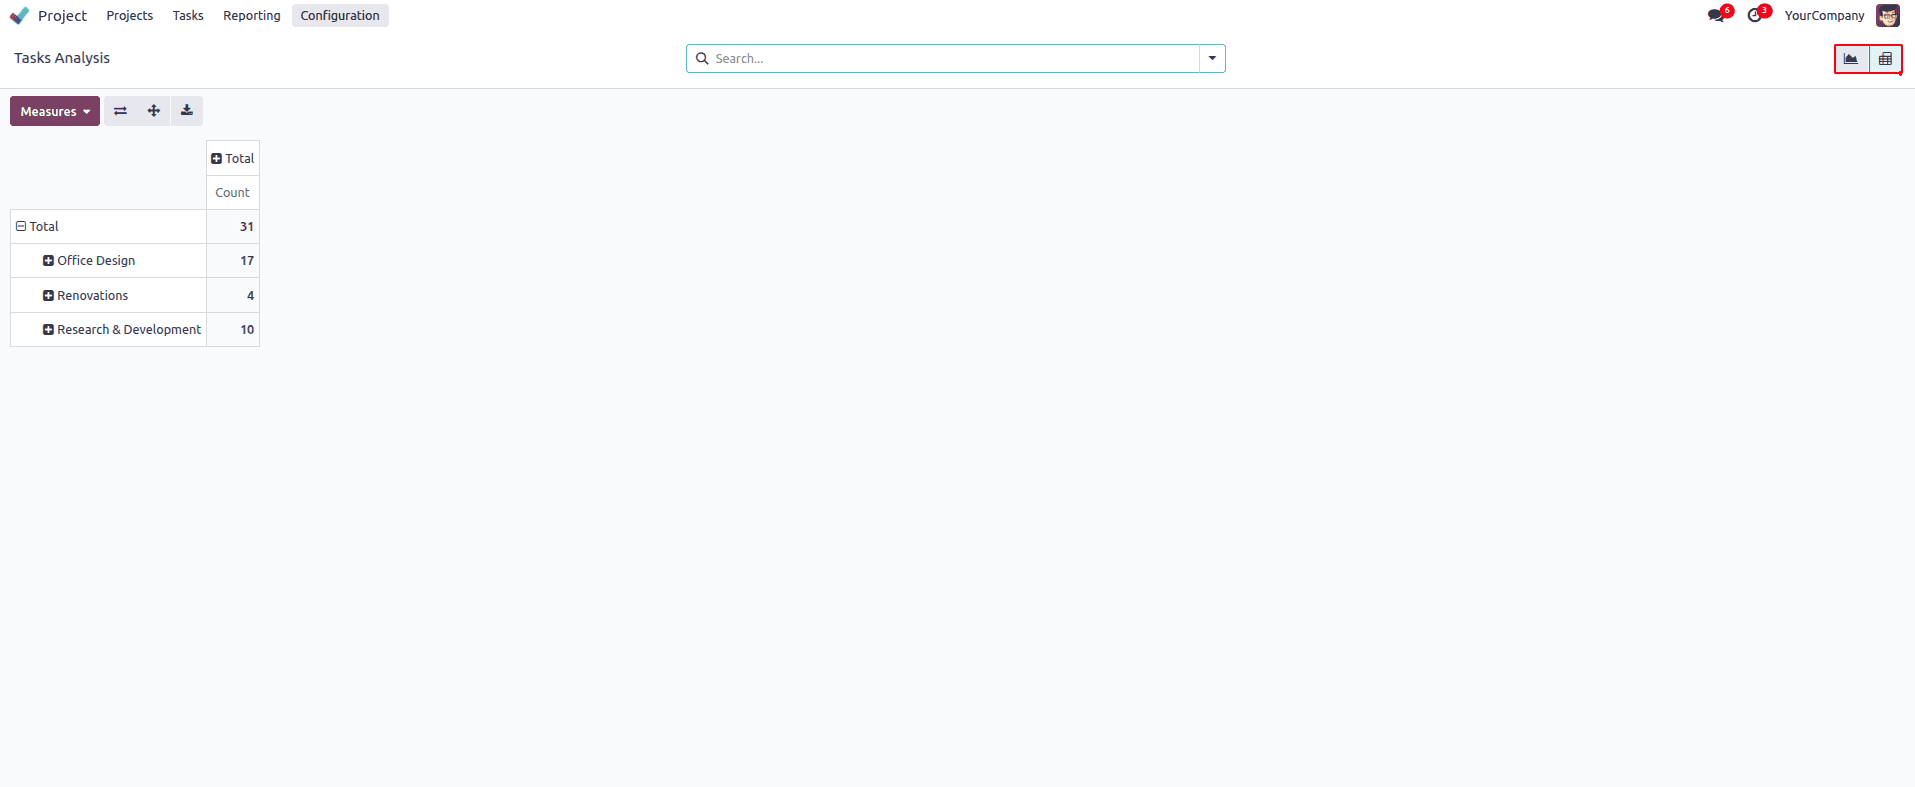
If you prefer to work with detailed numerical data, such as planned hours versus hours spent, you can easily switch to the Pivot view using the view selector at the top right. This makes it easier to analyze performance and time tracking in depth.
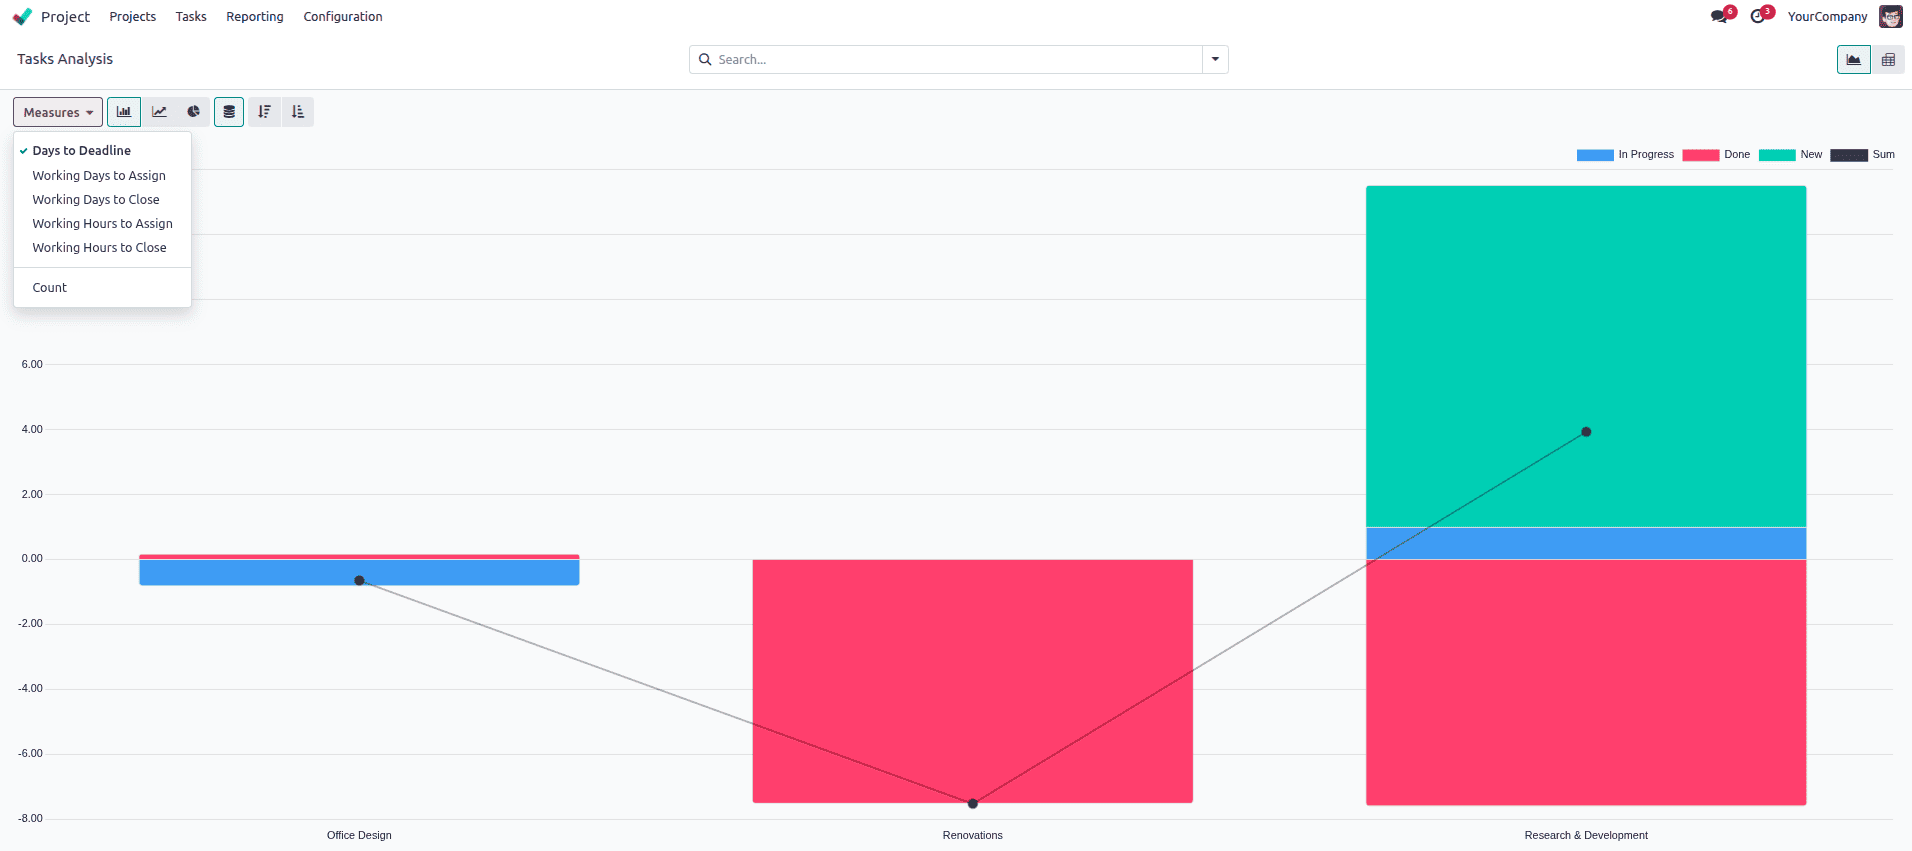
In both the Graph and Pivot views of the Task Analysis report, Odoo 18 allows you to customize your insights using the Measures option. This dropdown provides a range of metrics that help you evaluate task efficiency and timelines more precisely. In addition to the commonly used Planned Hours and Hours Spent, you can also choose from other valuable time-based indicators such as:
* Days to Deadline – the number of days remaining before a task’s due date.
* Working Days to Assign – the number of working days taken to assign the task after it was created.
* Working Days to Close – the total number of working days taken to complete a task from the moment it was created.
* Working Hours to Assign – the number of working hours taken to assign a task.
* Working Hours to Close – the actual working hours it took to close the task.
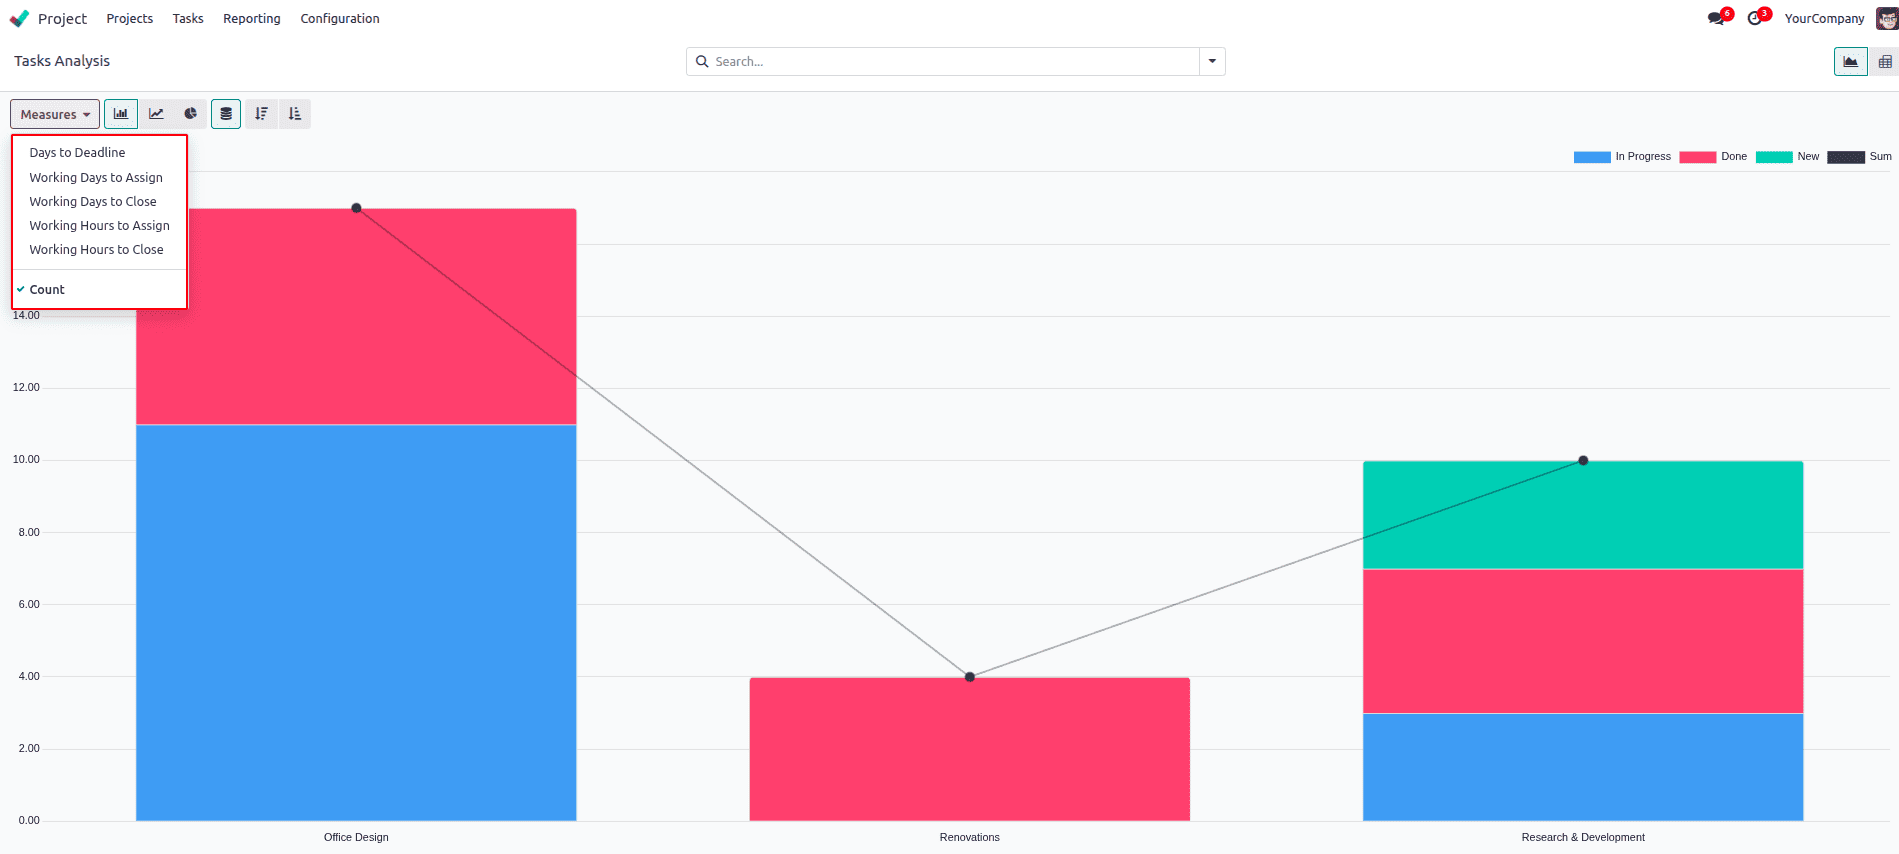
These measures are particularly helpful for evaluating task responsiveness, assignment speed, and completion timelines. Selecting these metrics through the Measures dropdown dynamically updates your report, giving you targeted insights into team performance and task flow.
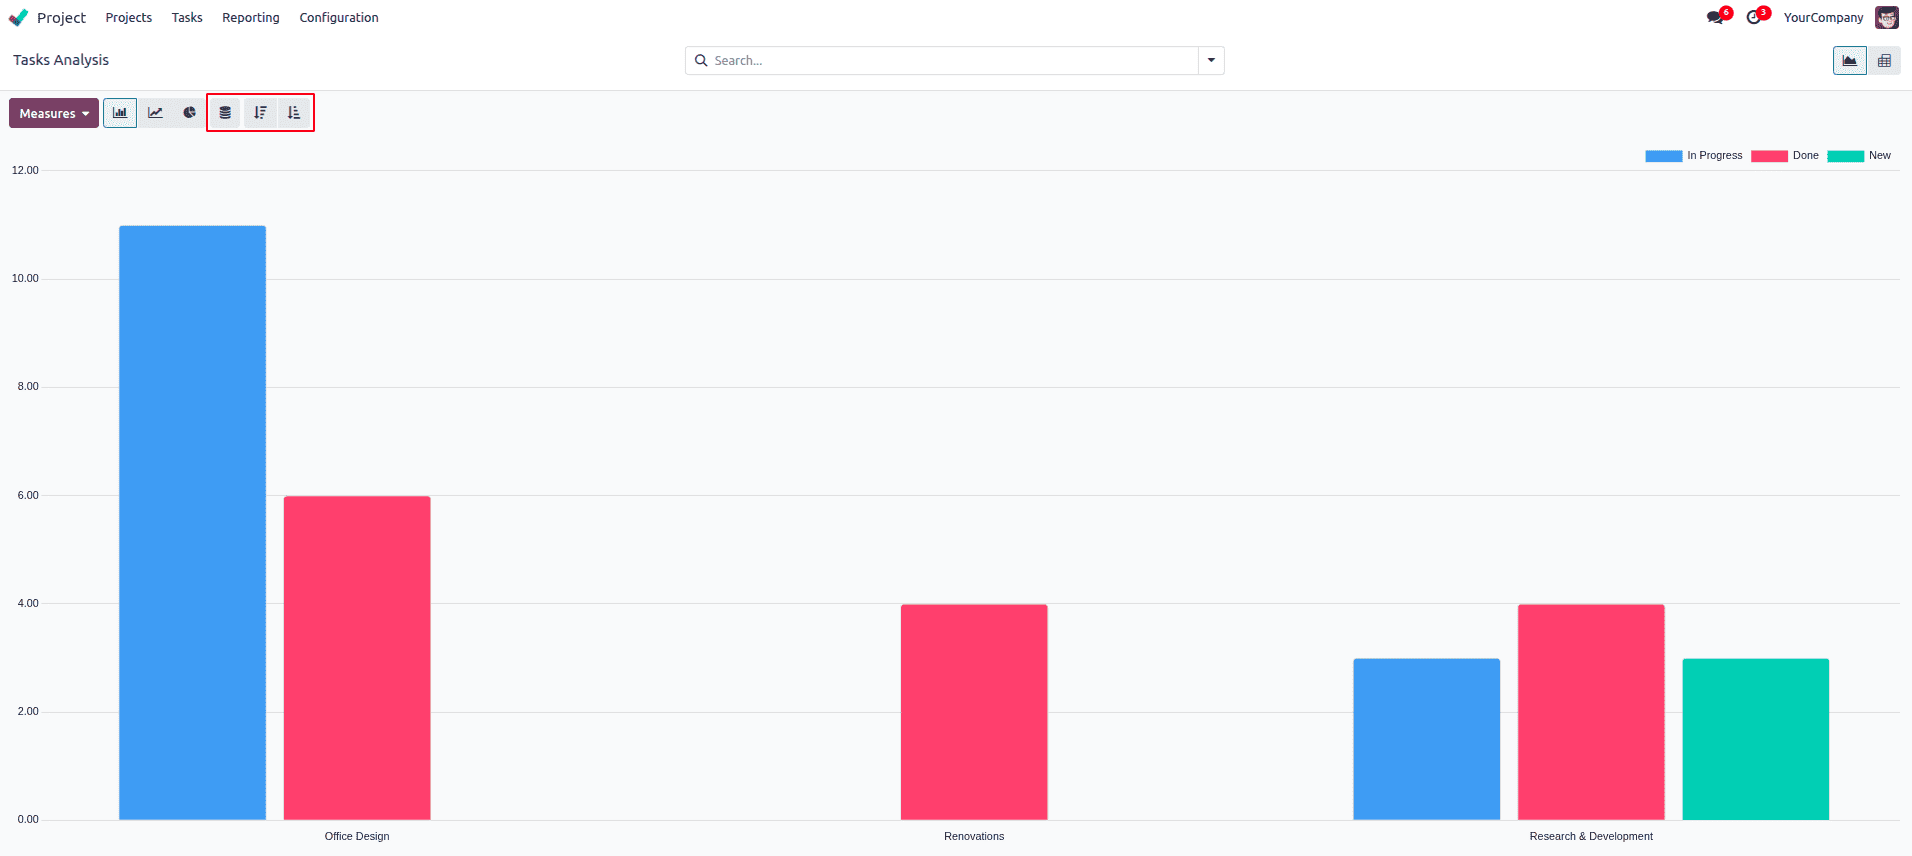
Odoo 18’s Graph view provides a highly visual way to interpret project and task performance. Once you've selected the appropriate measures, such as Planned Hours, Hours Spent, or Working Days to Close, you can switch between various types of graphs to analyze the data from different angles. The system supports multiple chart types, including bar chart, line chart, and pie chart, each offering unique value depending on what you're trying to assess.
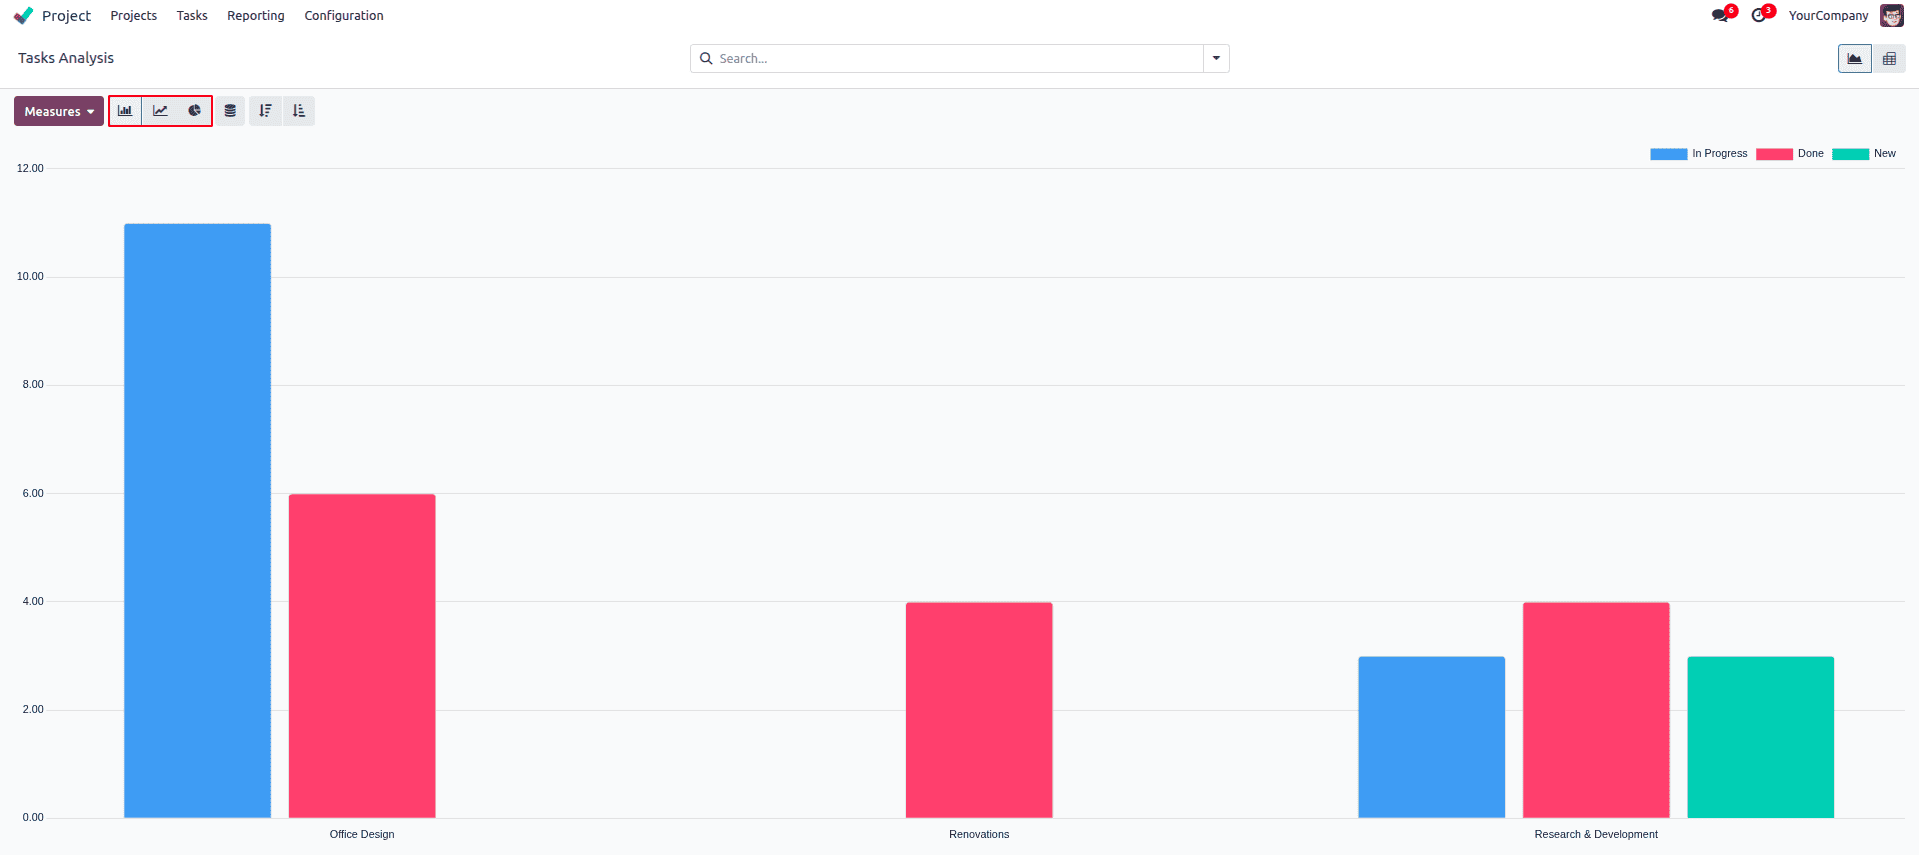
The bar chart is ideal when comparing metrics across different categories, such as projects, assignees, or task stages. For instance, if you're evaluating how many hours were spent on tasks in each project, a horizontal or vertical bar chart clearly displays the variation. This makes it easy to spot overburdened projects or uneven task distribution.

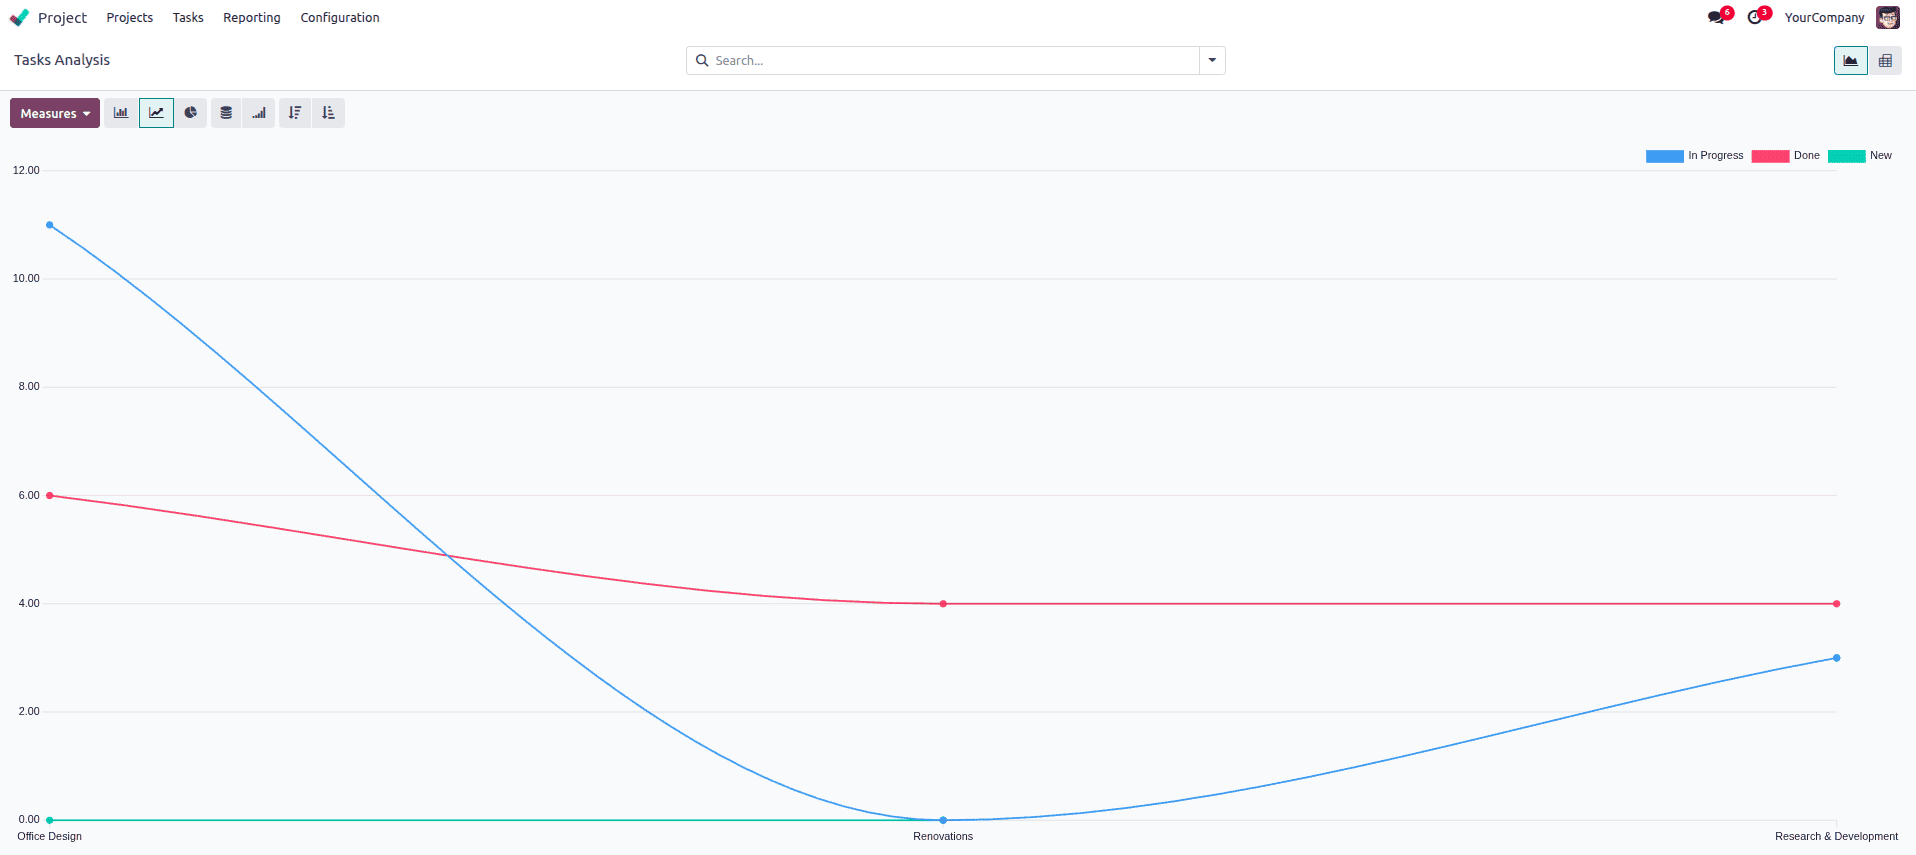
The line chart, on the other hand, is best suited for analyzing trends over time. If you're tracking performance or workload progression—say, how total hours spent are changing month over month—this chart helps visualize increases or declines clearly. It's particularly useful for identifying seasonal peaks or workflow slowdowns.
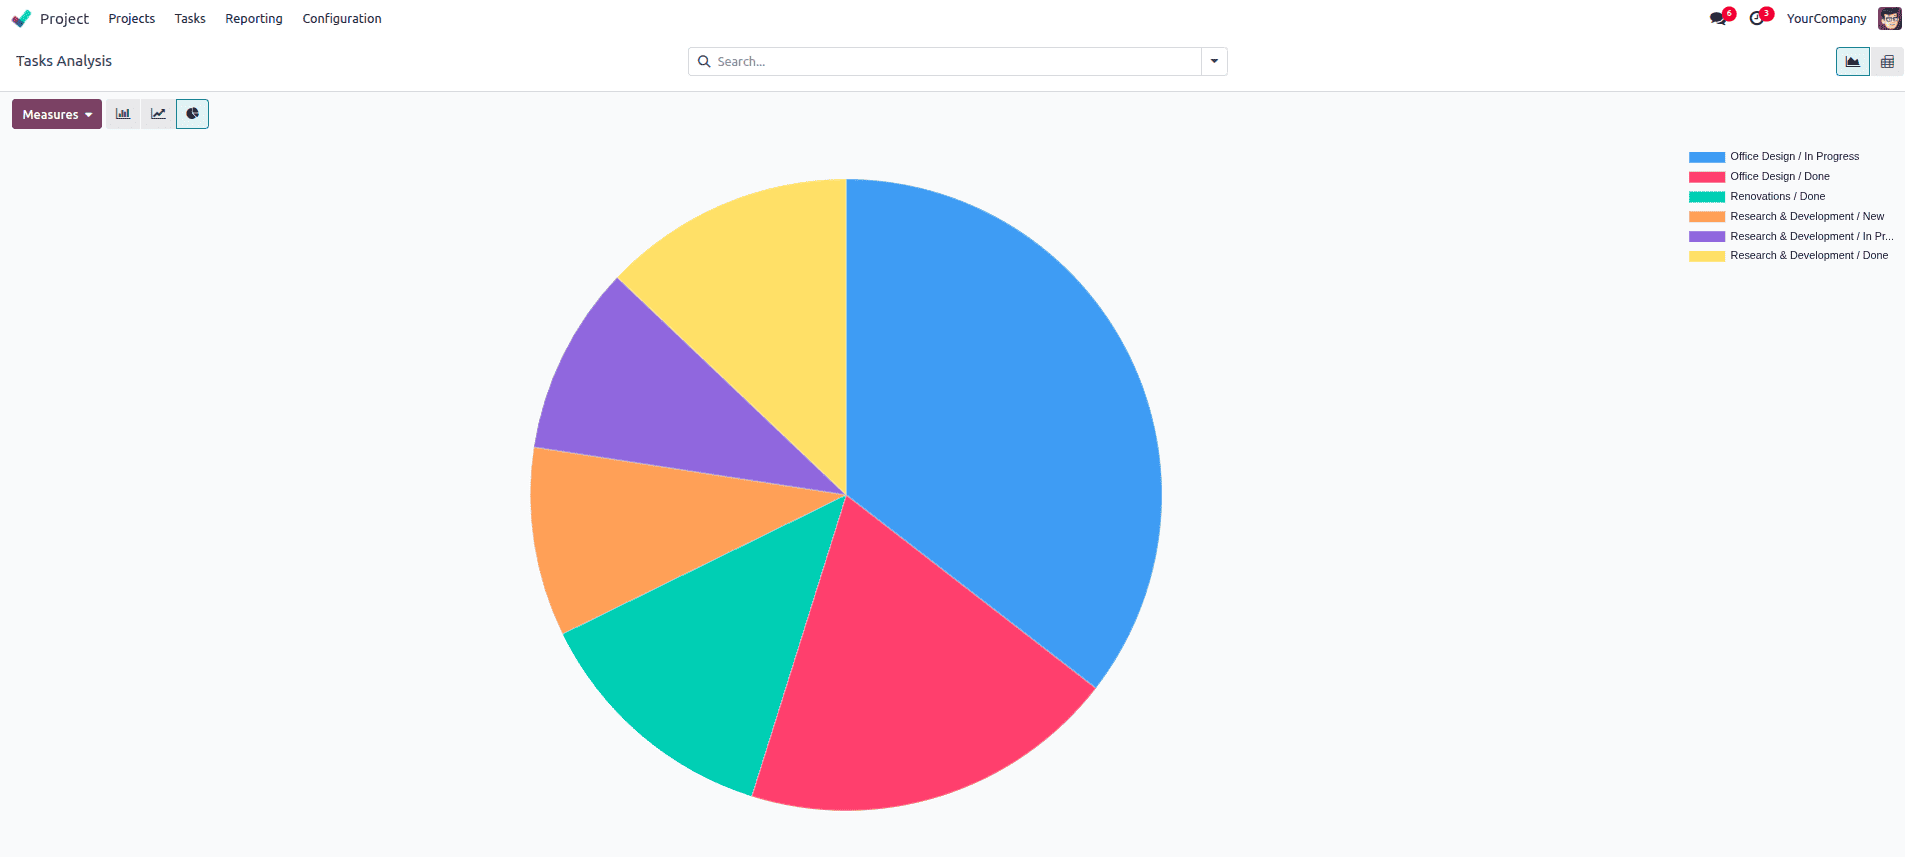
Then there's the pie chart, which gives you a quick view of proportions. If you want to see what percentage of total hours each team member or project contributes, a pie chart provides a fast, intuitive snapshot. It’s best used when the focus is on distribution rather than time-based changes.
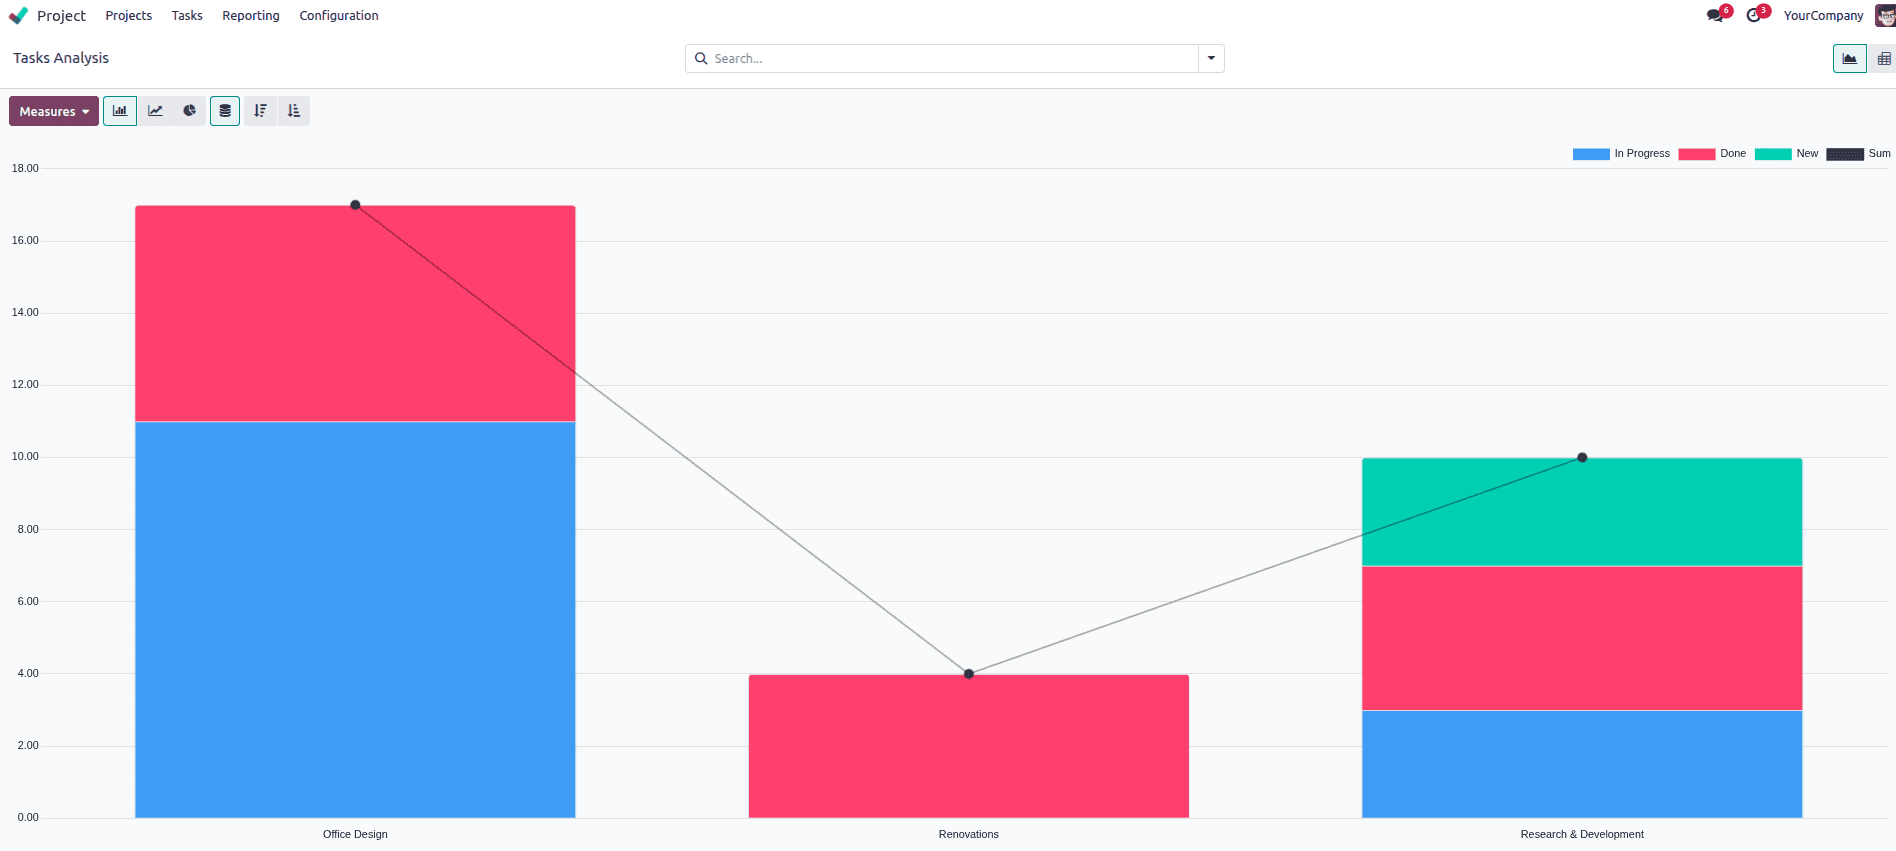
In addition to selecting the chart type, Odoo 18's Graph view also offers further customization options that enhance how your data is presented. These include toggles for Stacked, Ascending, and Descending views, all of which are accessible directly from the chart toolbar.
The Stacked option lets you combine values within the same bar. For example, if you’re showing hours by project and also grouping by task stage, using the stacked view will show all stages in one single bar per project, each section in a different color. This helps you understand how the total is made up, like how much time was spent on “To Do,” “In Progress,” or “Done” tasks in each project.
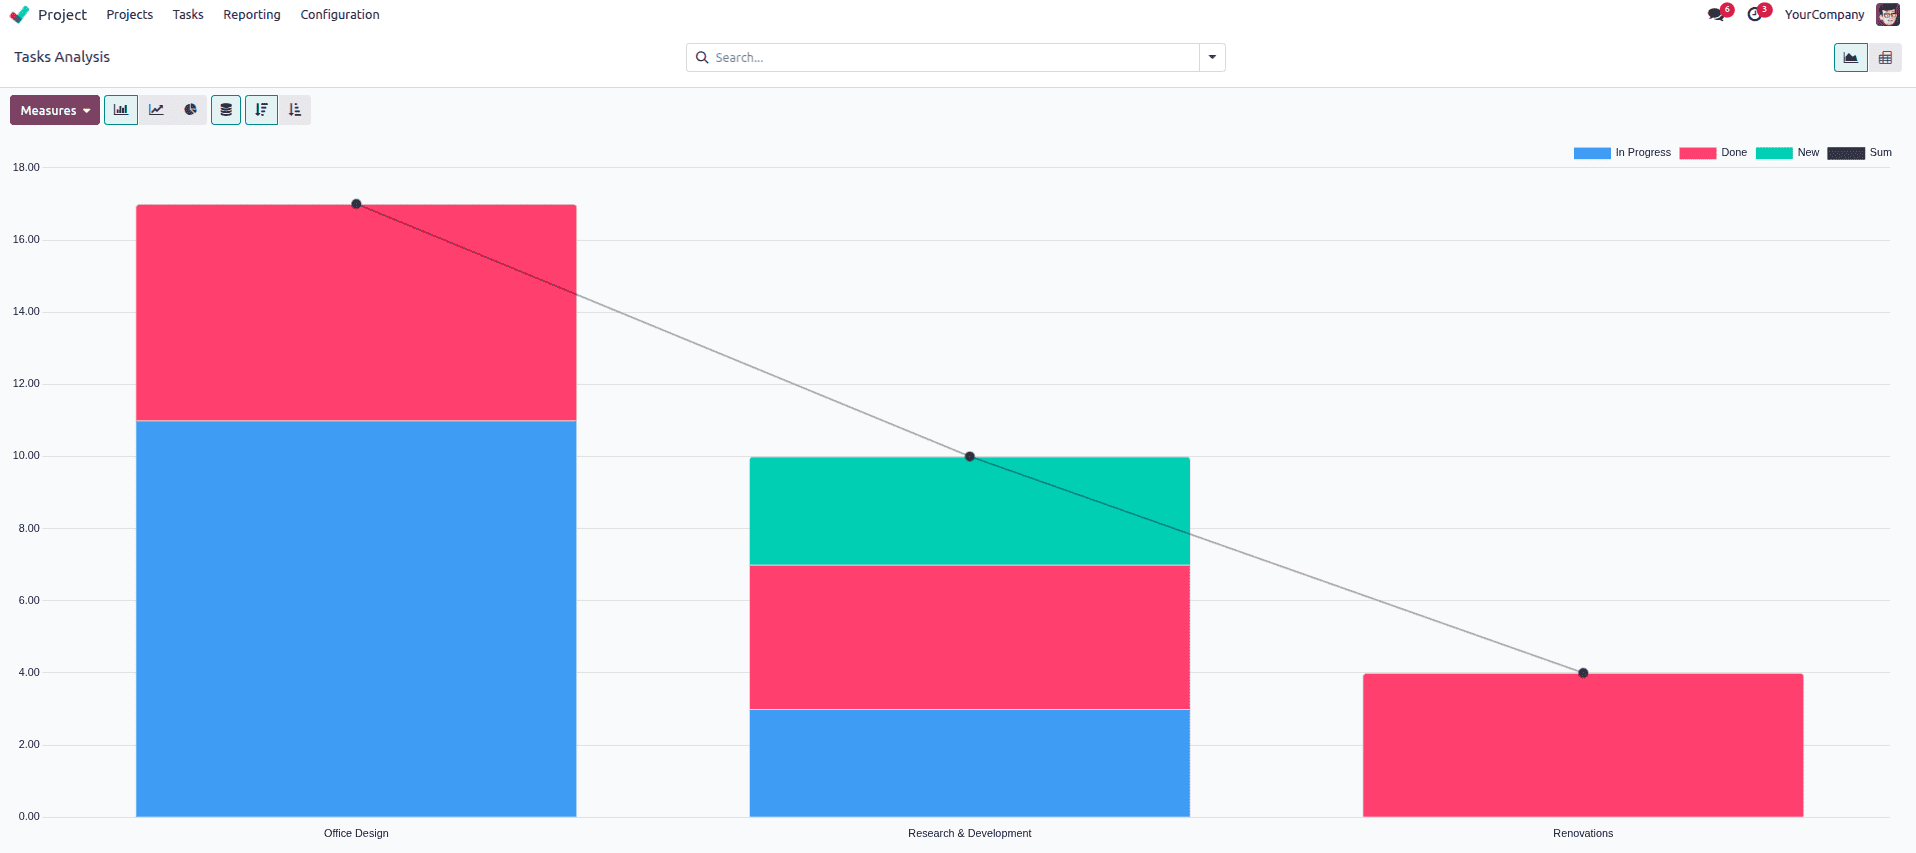
The Ascending and Descending options let you sort the bars or lines by their value. If you choose Ascending, the bars will go from smallest to largest.
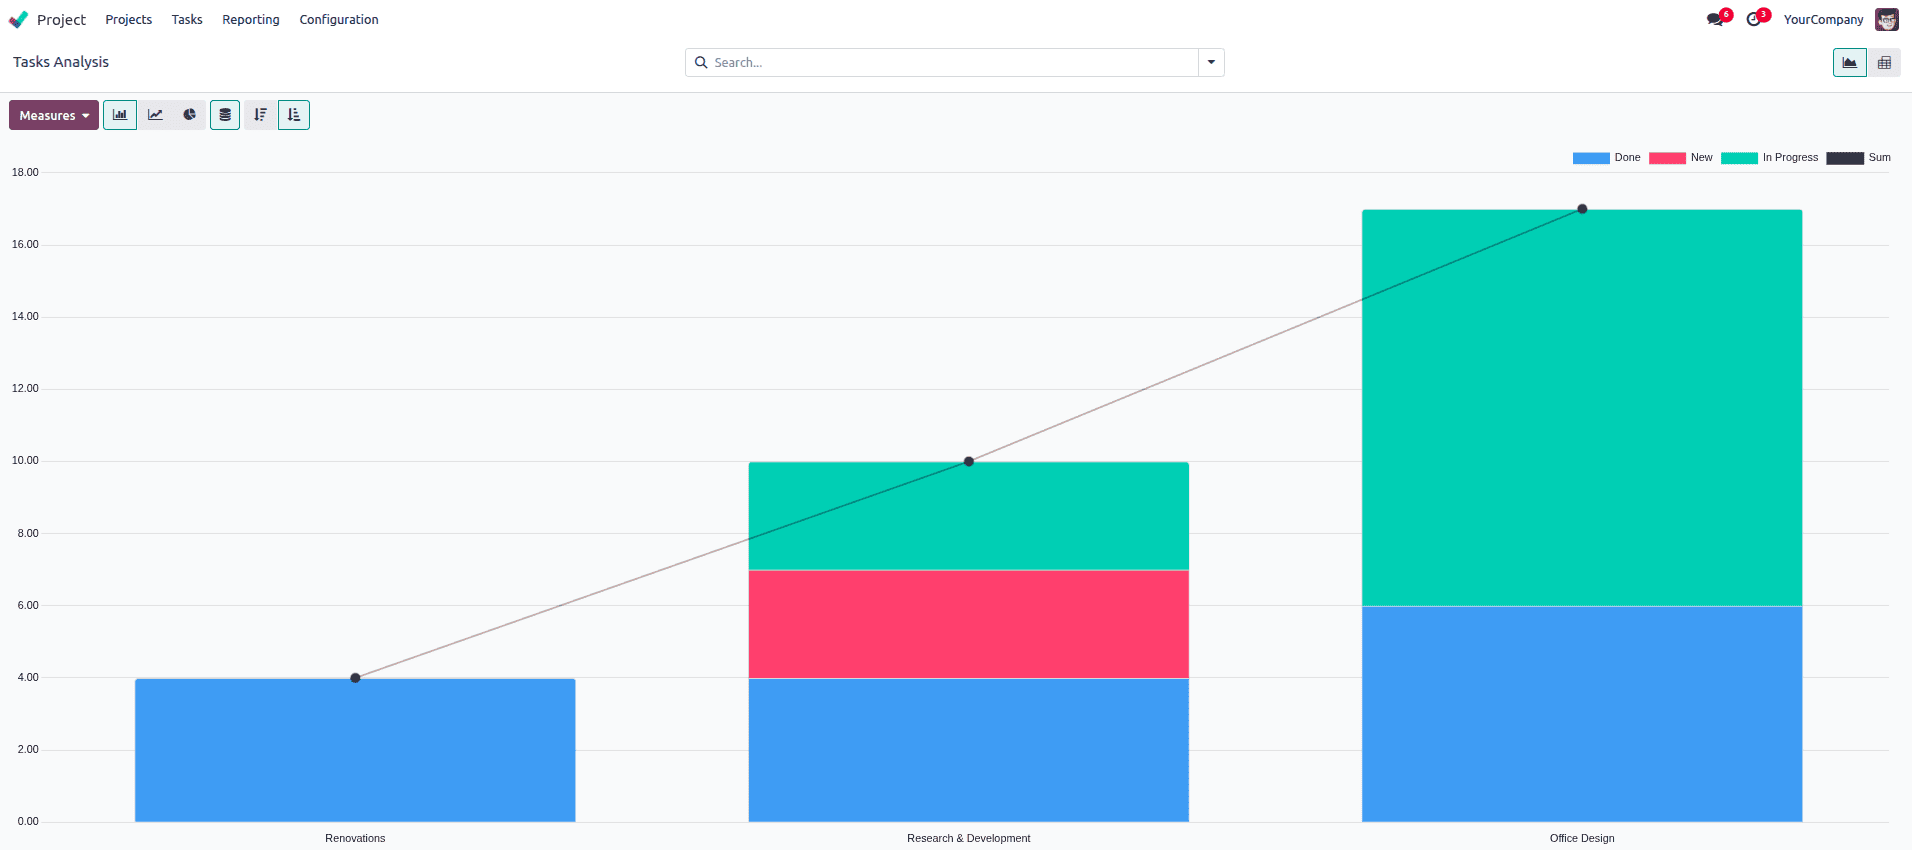
If you choose Descending, they’ll go from largest to smallest. This makes it really easy to spot which projects, stages, or users are taking the most time, or the least.
In project management, completing tasks on time is important—but making sure the customer is happy with the result is just as critical. That’s where Odoo 18’s Customer Ratings feature becomes a valuable tool. It allows you to automatically collect feedback from clients when a task is marked as completed, helping you measure satisfaction and service quality without manual follow-up.
To start using this feature, first go to the Project app. Then, click on Configuration in the top menu and select Settings. Inside the settings page, scroll down to find the Customer Ratings option and make sure it is enabled.
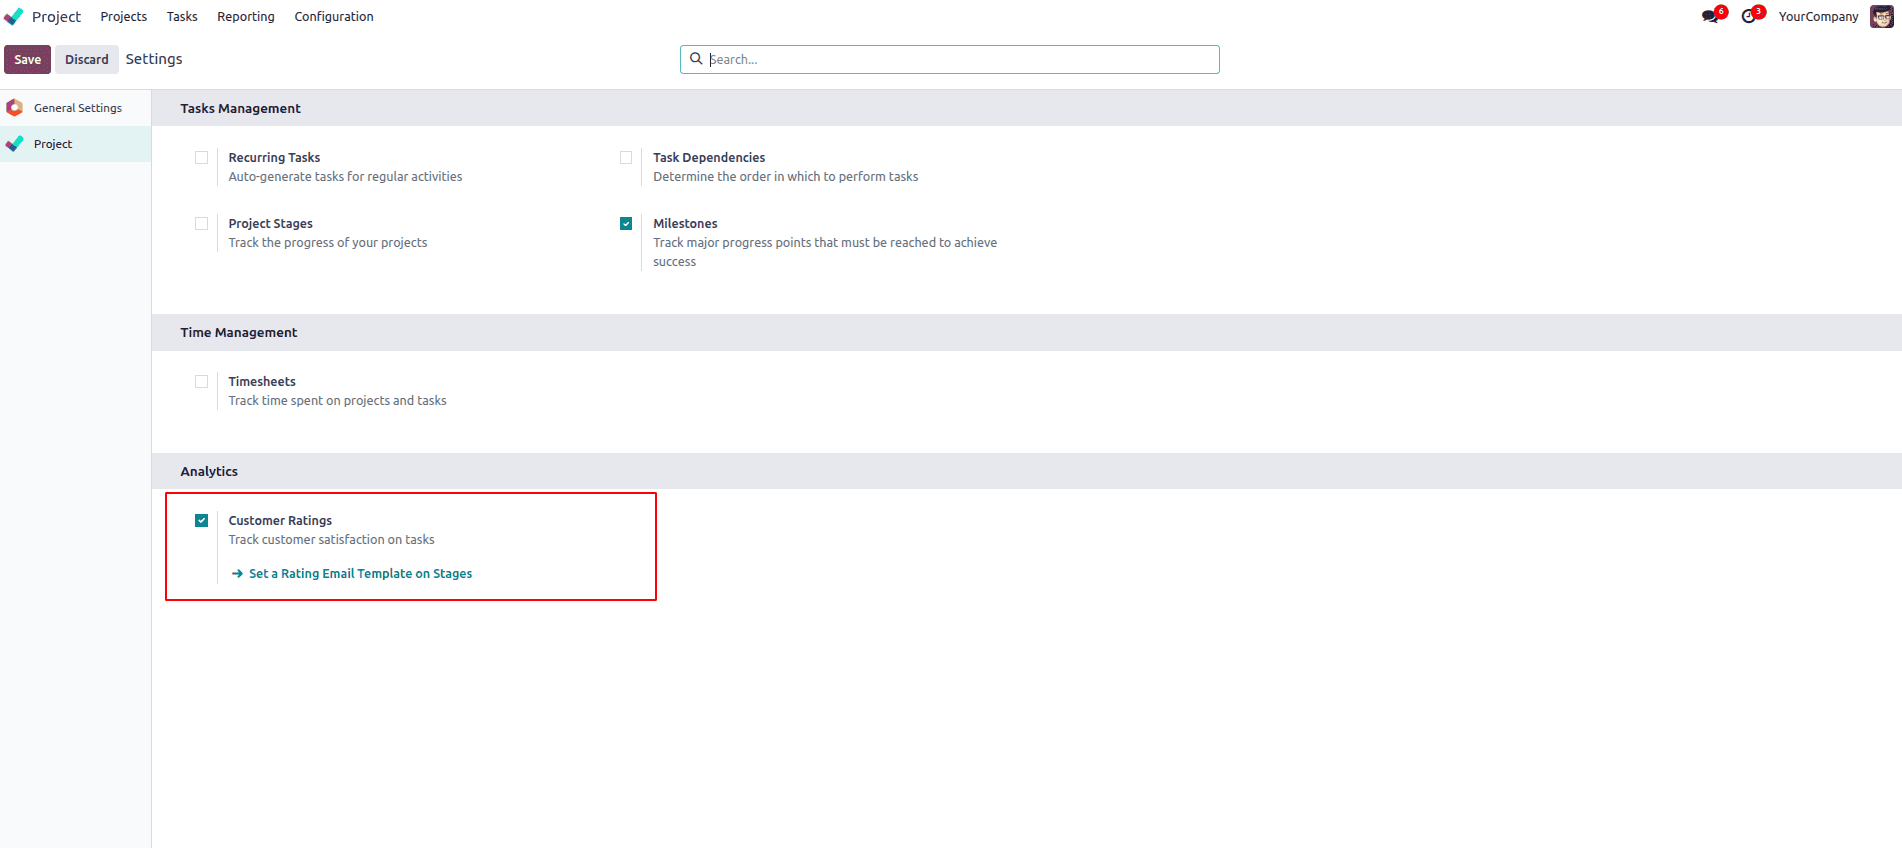
Once activated, Odoo will automatically send a rating request to the customer when a task linked to them is moved to the “Done” stage.
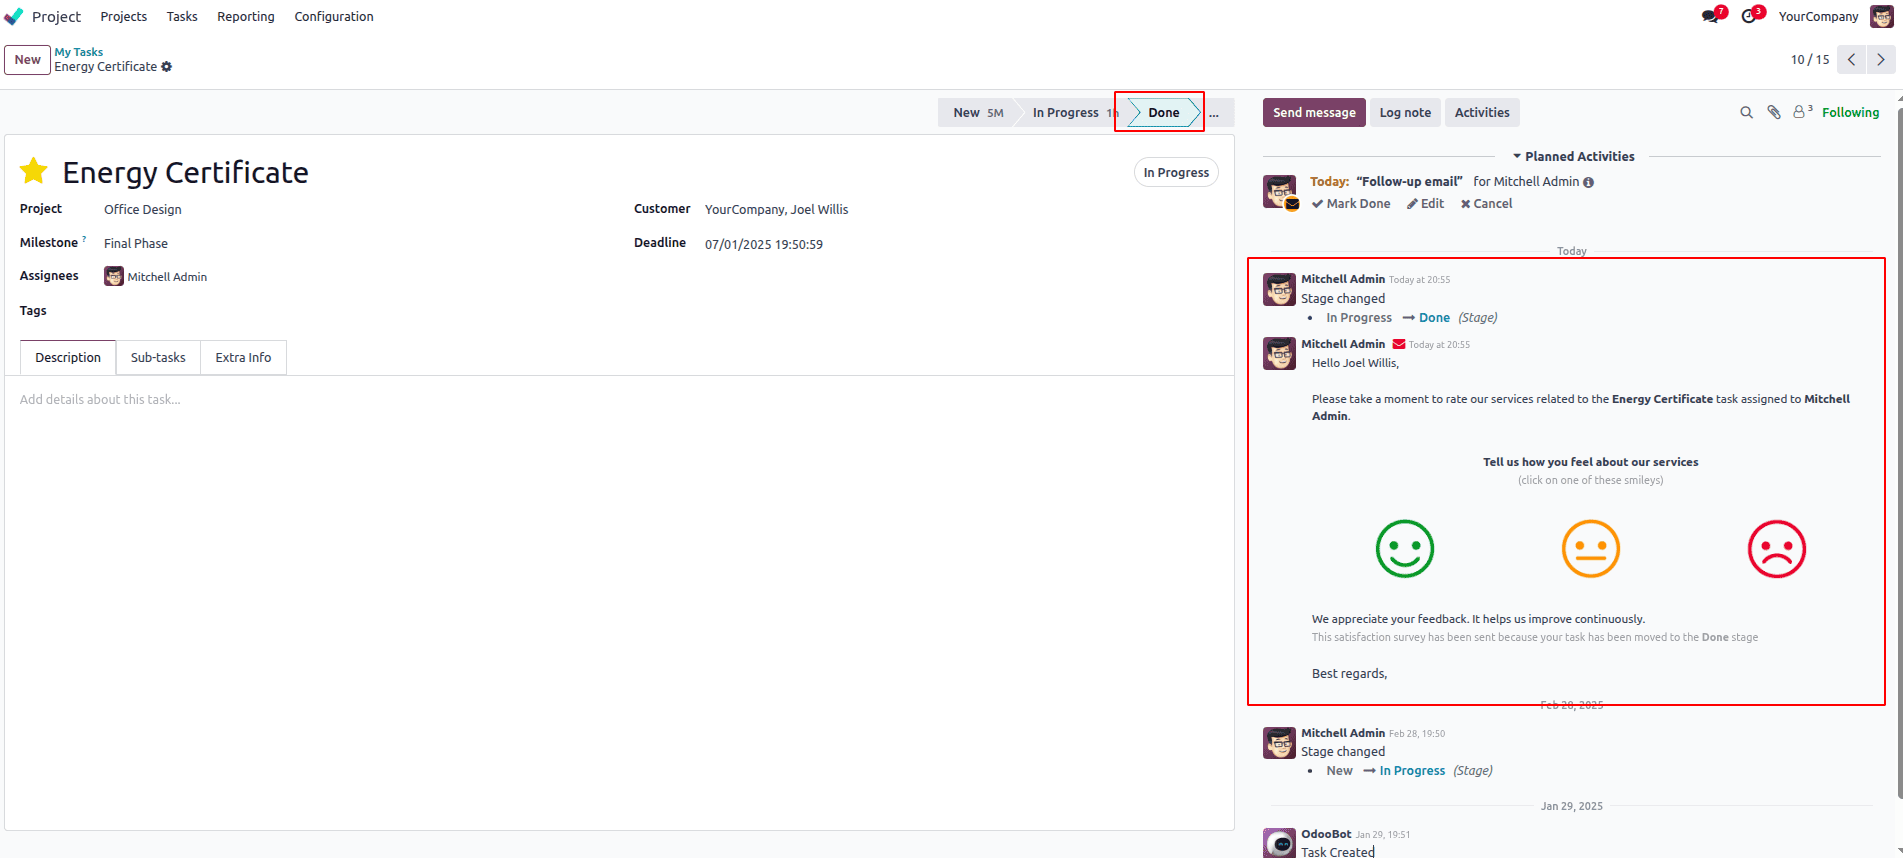
When a task is completed, the customer receives an email with a simple rating form. This process is completely automated, making it easy to collect feedback without needing to send separate emails or forms manually.
When a task is completed, the customer receives an email with a simple rating form. They can select a star rating (typically 1 to 5) and add a short comment if they wish. This process is completely automated, making it easy to collect feedback without needing to send separate emails or forms manually.
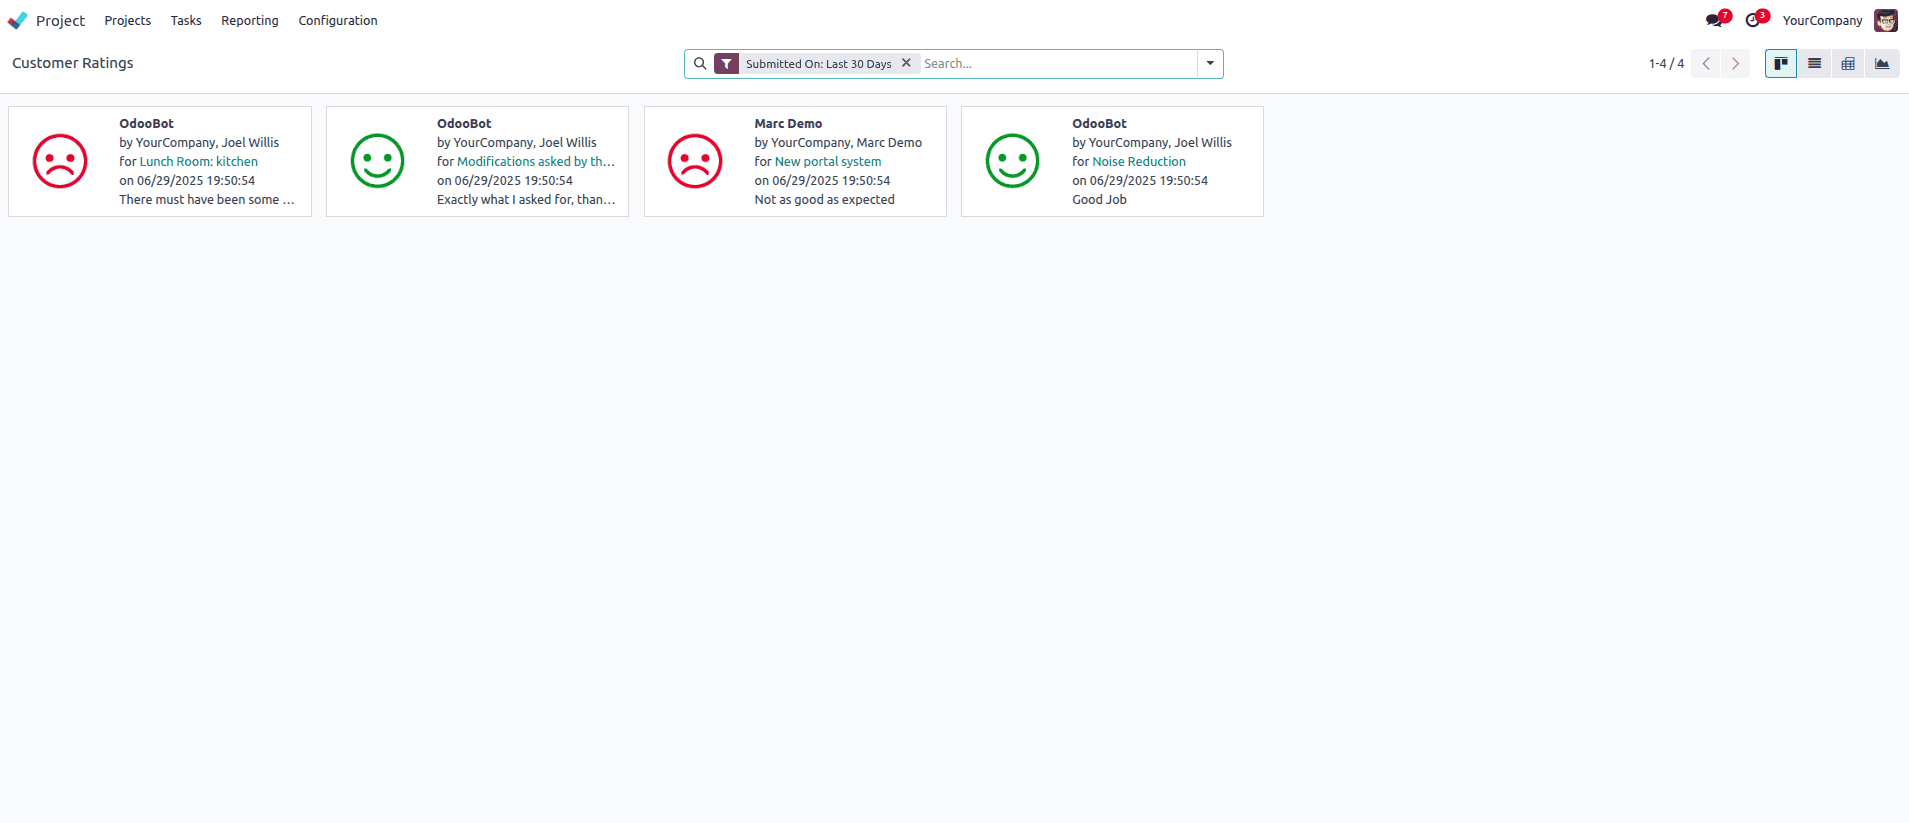
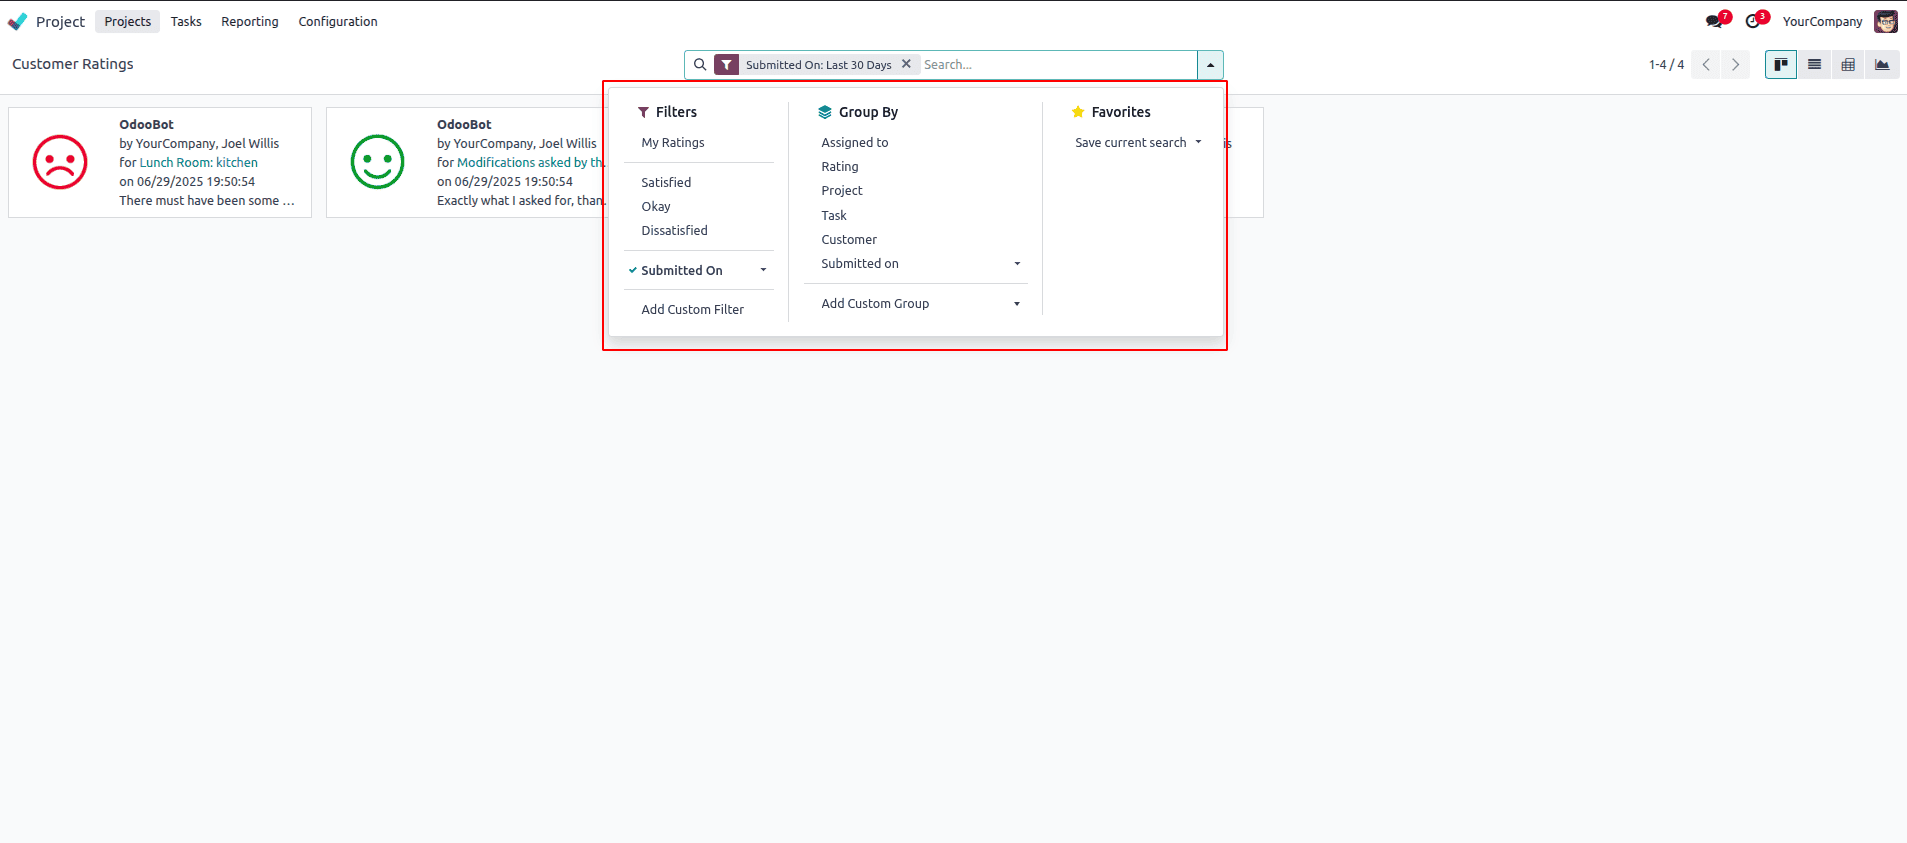
You can filter this list by project, user, date, or rating score to focus on specific teams or time periods.
Customer Ratings give you direct insight into how your work is being received by clients. Over time, this data helps you identify patterns, like which projects consistently receive high praise, or where customers are less satisfied. This makes it easier to improve communication, fix recurring issues, and deliver a better experience overall.
Odoo 18 helps you manage projects better by giving you useful tools like Task Analysis and Customer Ratings. With Task Analysis, you can track progress, compare planned and actual hours, and spot delays early. Customer Ratings let you collect feedback from clients when a task is done, so you know how satisfied they are. Together, these features make it easier to improve your work and keep your customers happy.
To read more about An Overview of the Odoo 18 Project Module, refer to our blog An Overview of the Odoo 18 Project Module.