Reporting and analysis are significant for all types of industries. The rental industry has no exemption. Industries that work purely with manual management systems also generate reports and analyze the performance levels. The difference is there the task will be completed manually by collecting all the transaction details, account details, expenses, and revenue for a particular period. This could be a tiresome task as it may require you to spend hours or days gathering the details and synchronize them to prepare an efficient report. Not all ERP tools may offer you the best support for report generation and performance analysis. There may be some technical glitches in creating reports for an older period or for a prolonged period if the ERP tool does not function in a smooth way.
Odoo open-source on the other hand is the favorite choice of many to generate reports. It comprehends the procedures and makes report preparation a task a click away. With this systematic management, we can generate the report for any period. The period here can be a month, a year, a quarter, etc.
How significant is reporting and analysis for rental business?
Analysis and report management are the keys to any business. In the rental business, the investor may want to know the growing pattern of the business. Then we can select the period for which the report is required and create a graphical or pivot view of the report. This will help the investor to analyze the rental orders generated during different months, daily order, daily pickup, and other factors which would help the investor or the manager to give a push to the business. It will also help the business to manage the performance of the sales team and analyze the business achieved by different salespersons. The prime customers, the product that is of more demand, and other such data could also be generated and analyzed using Odoo Rental Reporting.
This blog will help you learn more about Rental Reporting and Analysis.
All those using the Odoo Rental module can use this.
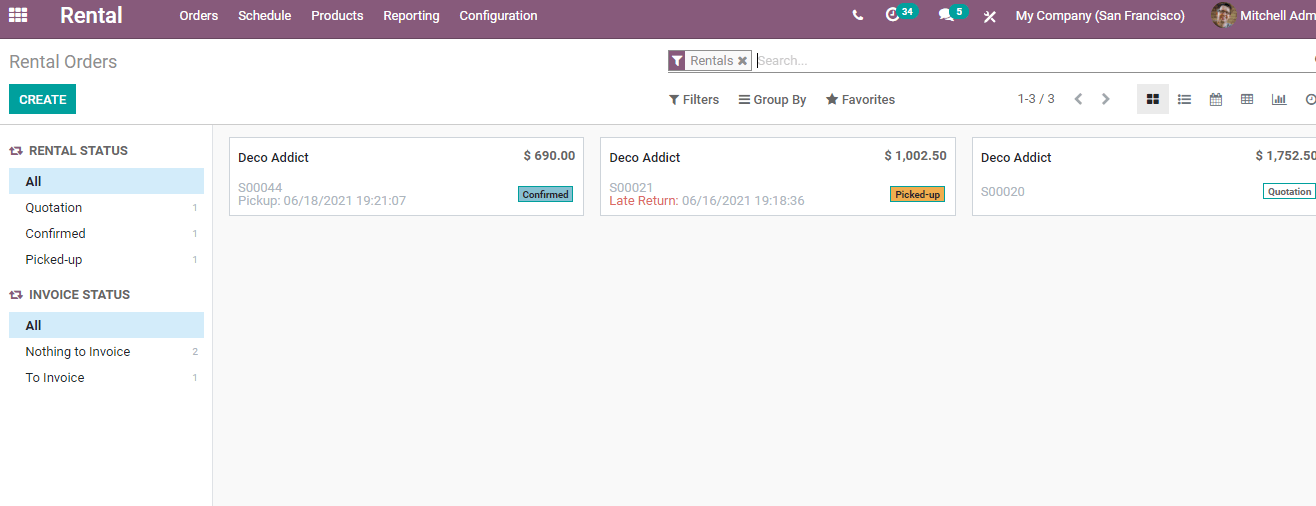
Here, we have different menus and can go to the reporting menu directly.

This page will help us to understand the performance of the company. This feature supports us to use different measures to prepare the report and filter the reports. We can also group the reports based on different criteria. Unlike many other reporting support tools, Odoo Rental Reporting can also be used for the comparison of the report for different periods.
We can check the reporting feature based on different measures.
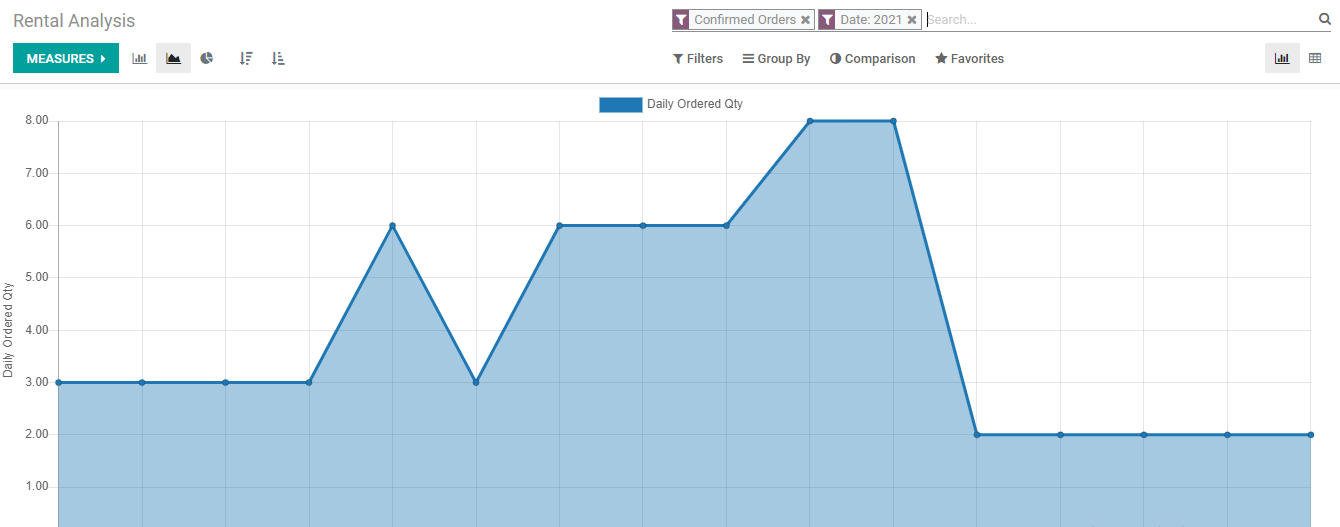
The analysis is made based on daily ordered quantity on a different dates.
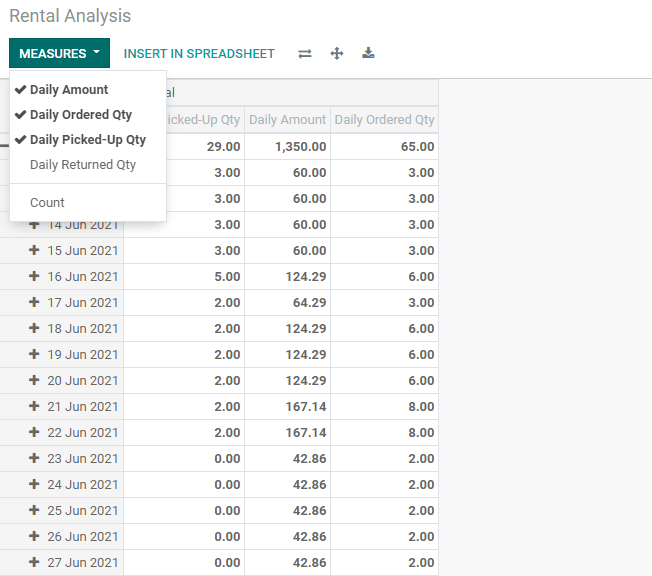
Measures
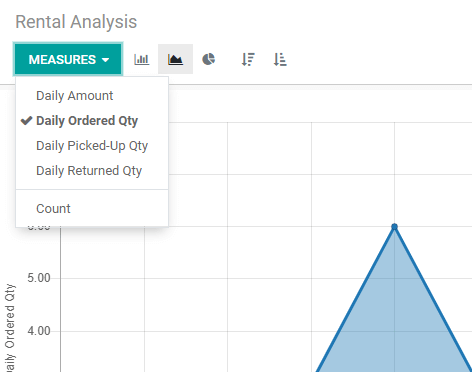
Odoo Rental Module helps us to generate reports and analyze the business based on the daily amount collected, daily order quantity, daily pick-up quantity, and daily return quantity.
Let us see how we can operate these measures.
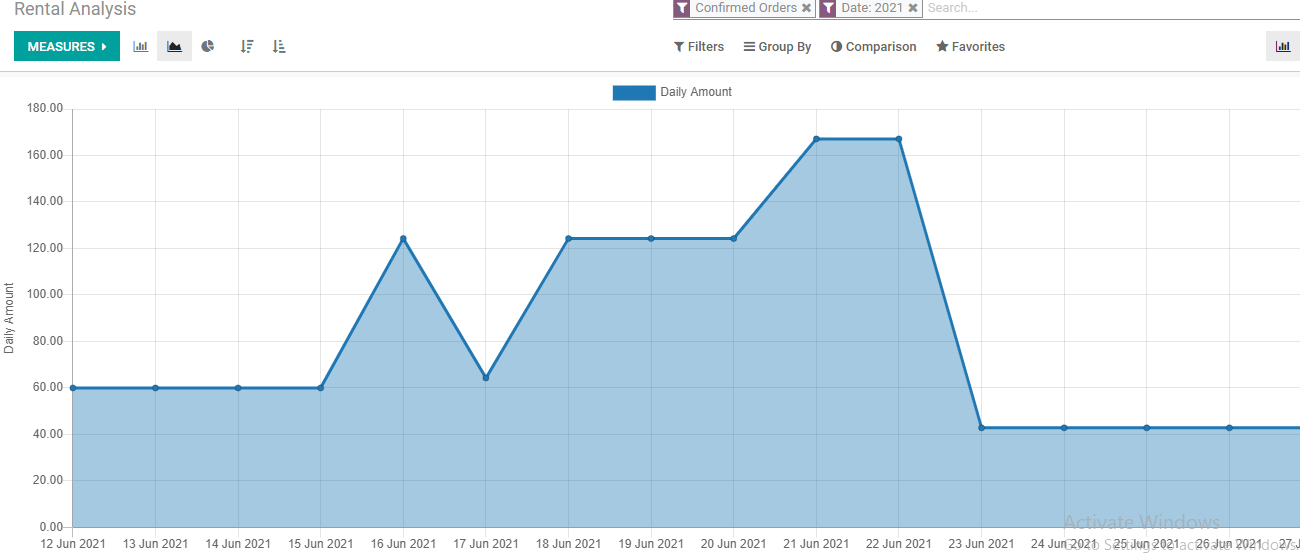
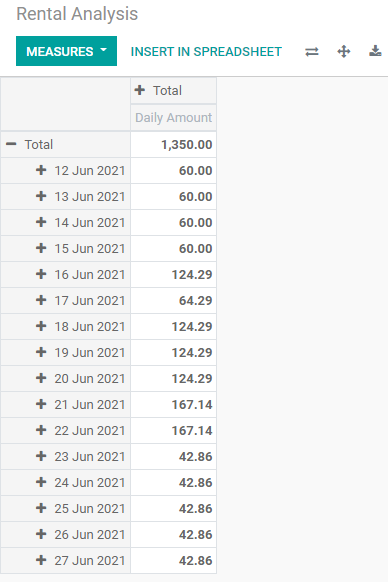
This above is the daily amount generated on different days in June. We can find that the maximum amount was generated on June 21 and 23. This way we can understand the statistics with graphical support.
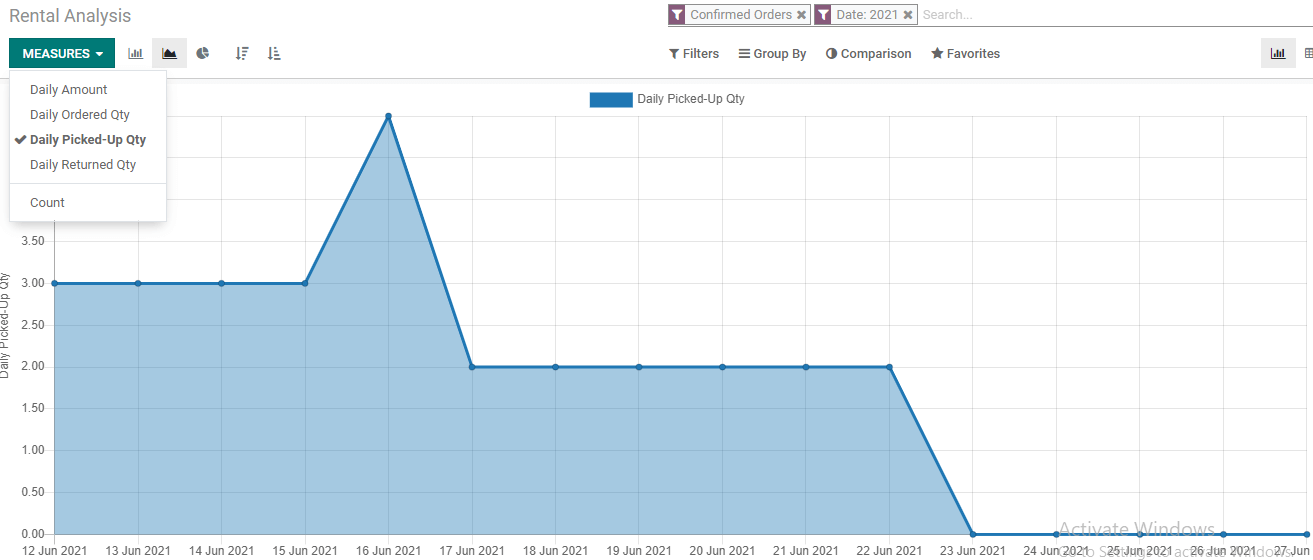
The above graph shows you the daily picked-up quantity for the month. The graph shows us that the daily pick up was the highest on June 16.
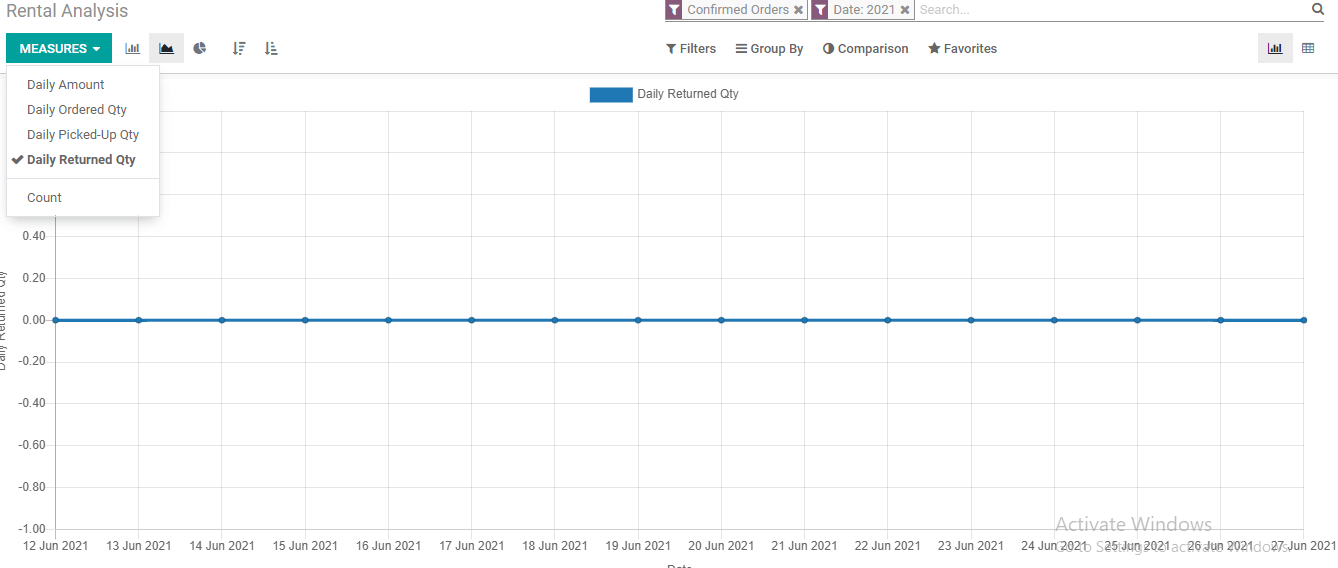
This indicates the daily return quantity on different days in the selected month. From the graph we can understand no was returned to the rental company during the selected period.
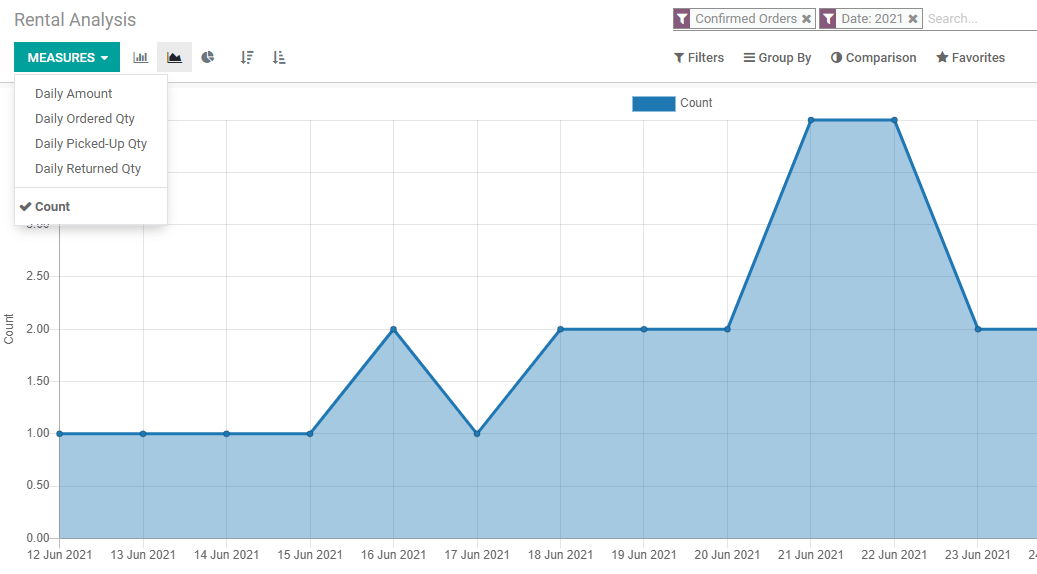
The above graph indicates the analysis based on the count.
Different Views
Odoo Rental Module offers us support to generate different views of the rental analysis. For the same measures, we can generate different views.
First we can check which are the views
Pivot view and graph view are available for all types of analysis.
Of these, we can first check the Pivot View
PIVOT VIEW
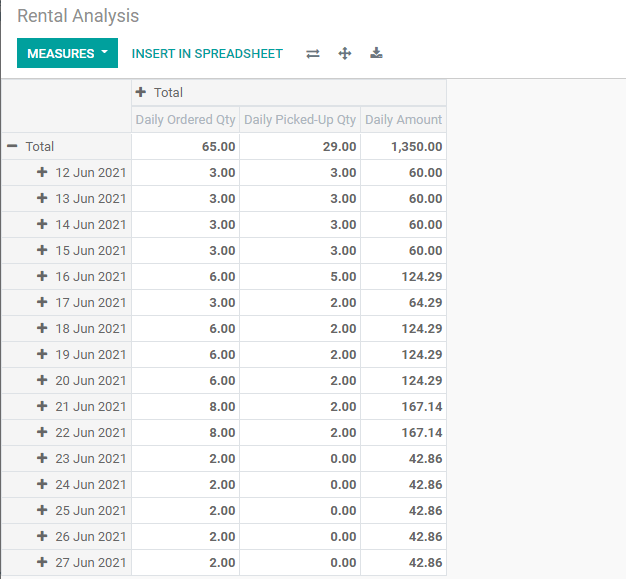
In this pivot view,
we can find daily order quantity, daily picked up the quantity, and daily amount for each day.
Pivot view also supports us to add a spreadsheet.
Here, we can view all the measures together as we have enabled all the Daily amount, Daily Ordered Quantity, and Daily picked up quantity. This feature of checking all measures together is possible only with the pivot view. We can also create separate spreadsheets for different measures.
That means we can generate reports to meet our demand.
Graph View
The graph view is a major attraction of Odoo and all Odoo modules are supported by graph view.
We have different types of graph views.
The bar chart will give you the report for different days in the form of bars, the Line Chart in the form of a line and the Pie Chart will give a pie representation.
Bar Chart
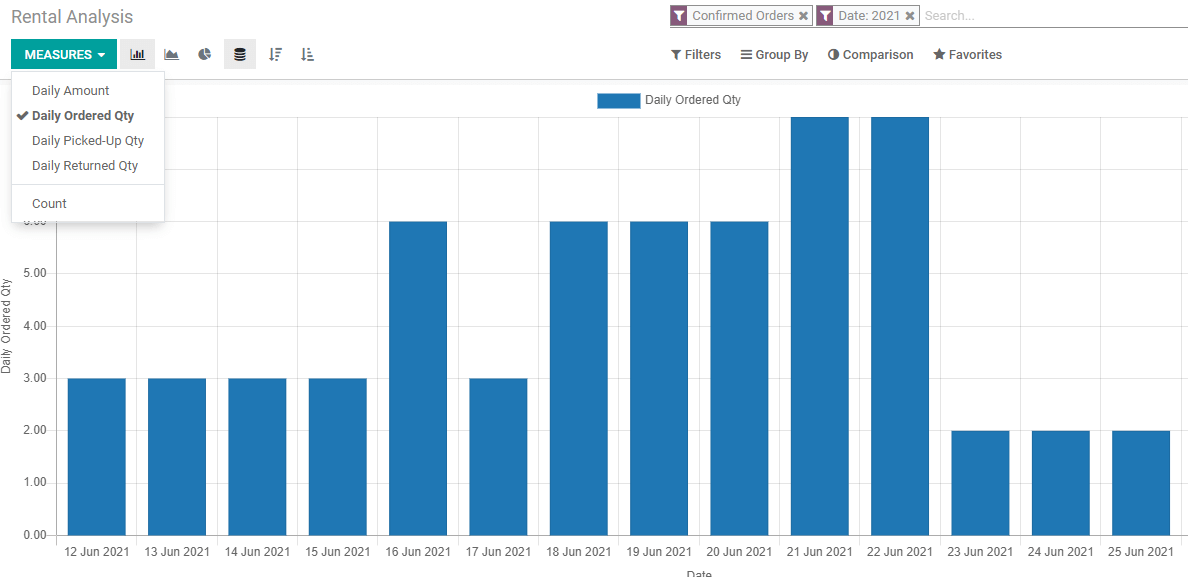
This is the bar chart of the rental analysis. This is the graph for the daily ordered quantity. This helps us to easily understand that the company experienced good business on June 21 and 22.
Line Chart
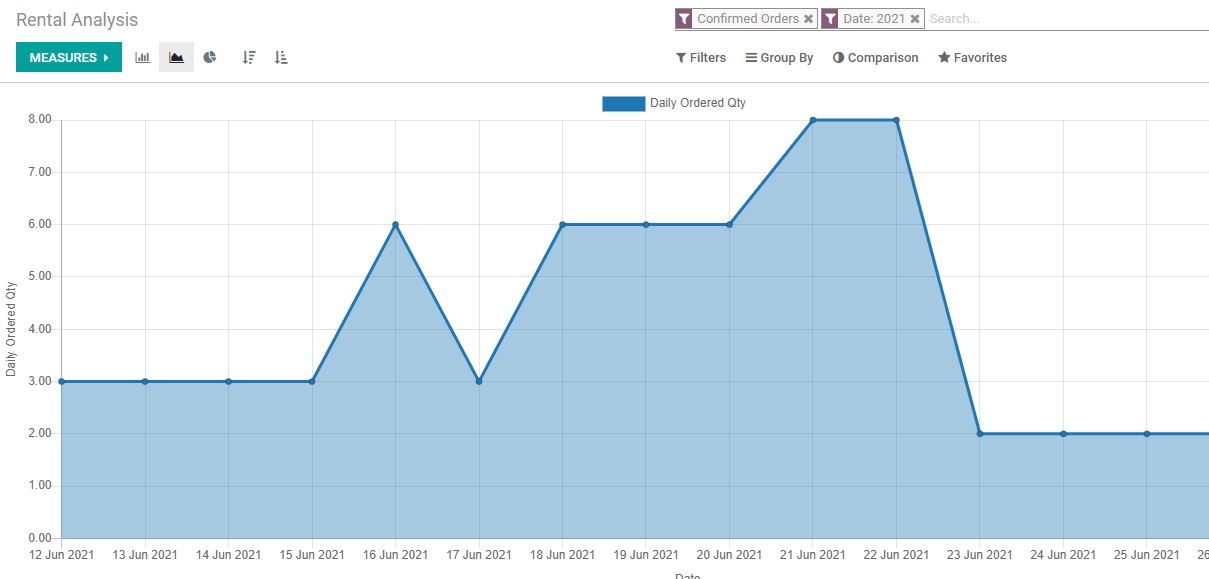
You can view the Line chart representing the report above.
Pie Chart
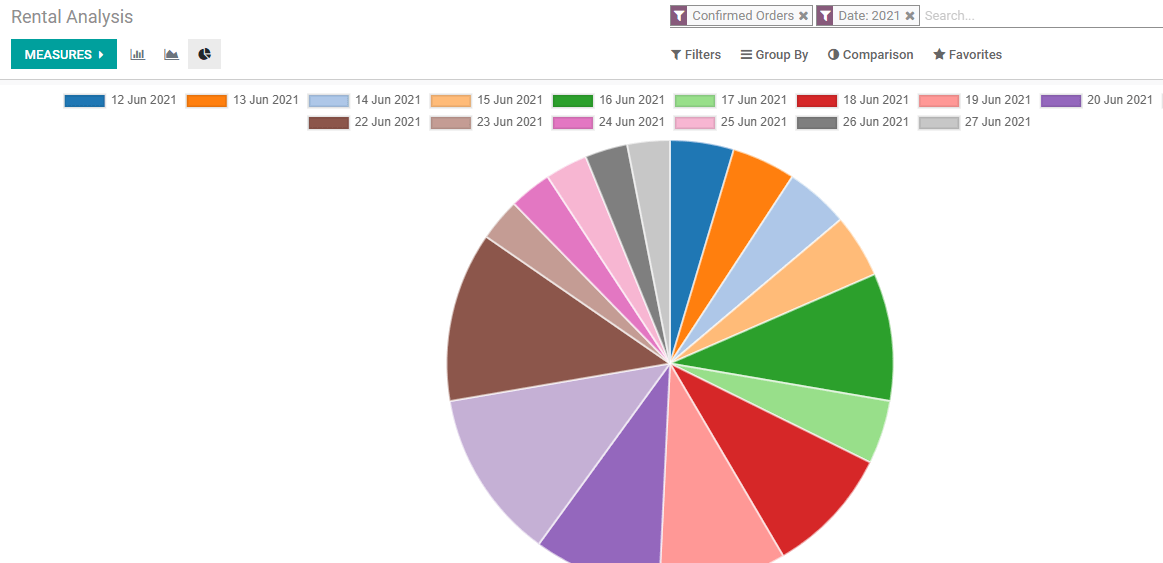
This is the pie chart representing the same. Here, different dates are represented with different colors for easily understanding the report.
Filters
As we have discussed the views we can now move on to Filters.
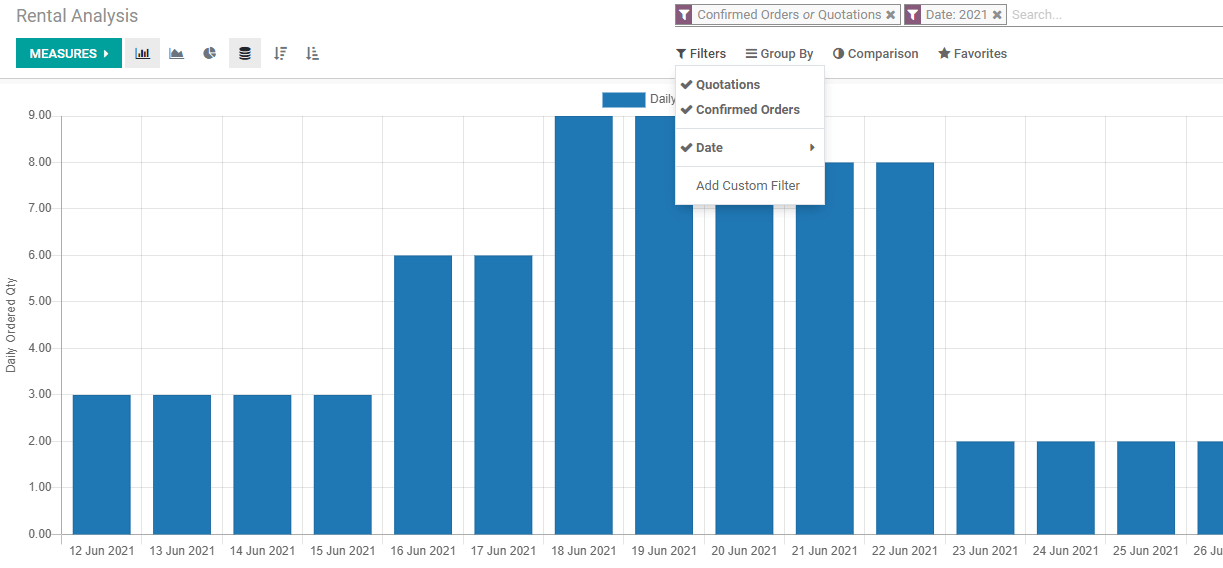
Filters help us to filter the report to suit or need.
Here we can filter the report to check the analysis of quotations or confirmed orders. The analysis can be made for a particular period of time.
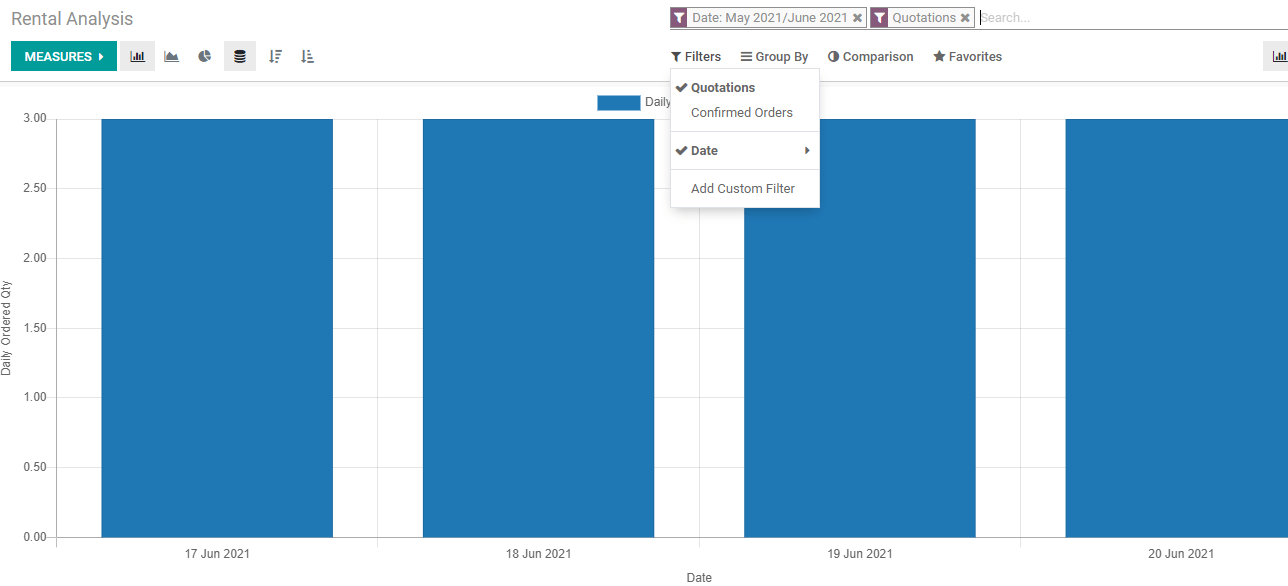
As given in the below image we can find the report for different years, quarters or months.
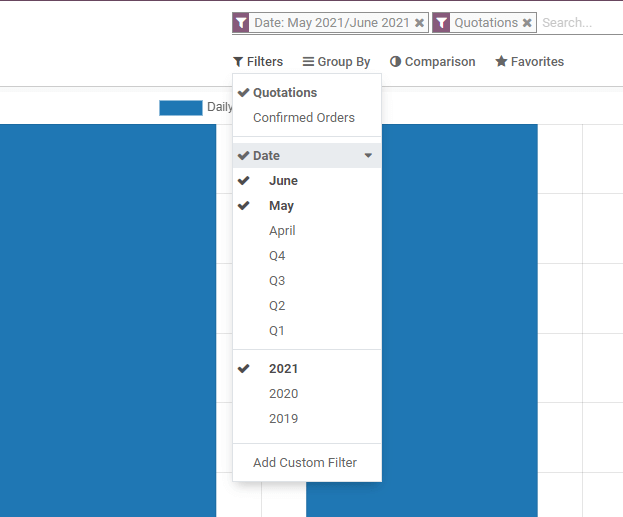
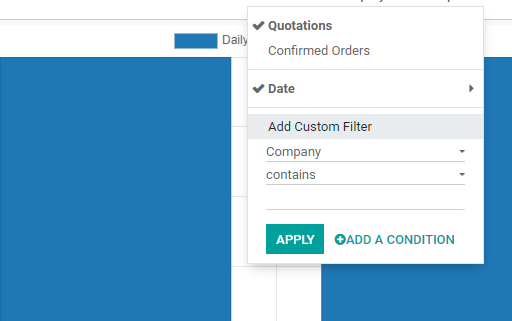
Custom filter option is also available her
Group by
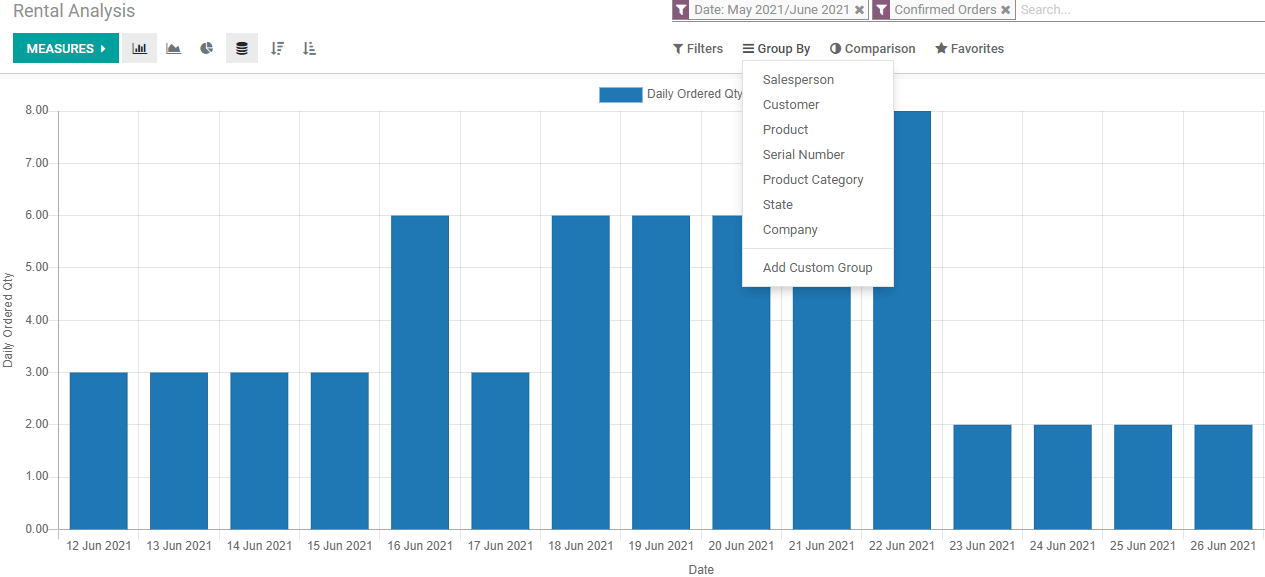
Another option we have is a group-by.
We can analyze the performance of salespersons.
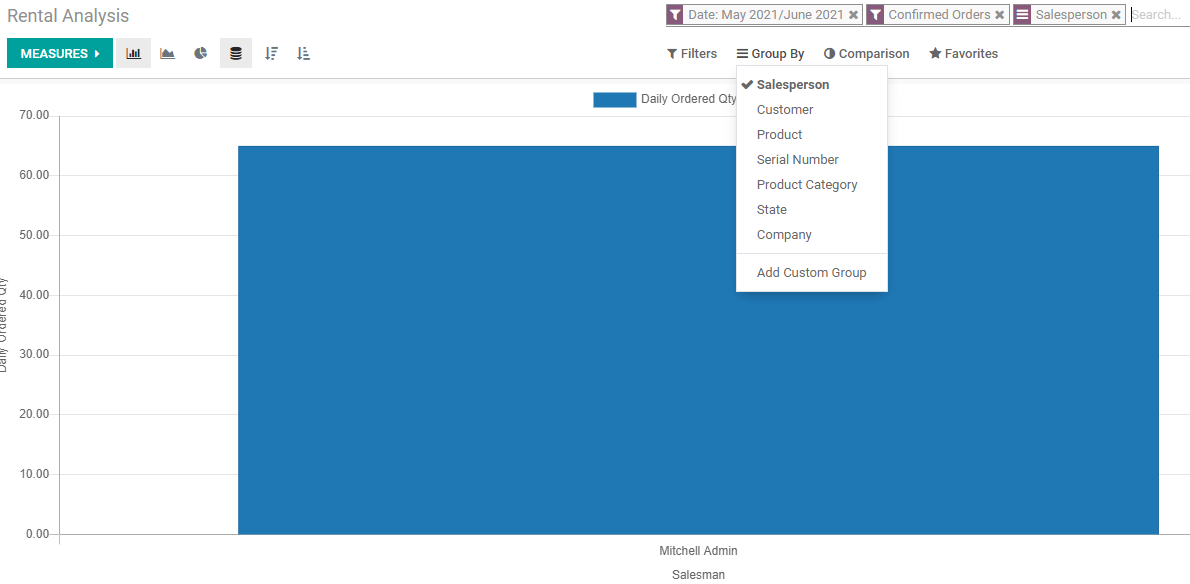
Here, we have only one salesperson Mitchell Admin.
Now I have selected the customer option to group by and I got the below graph
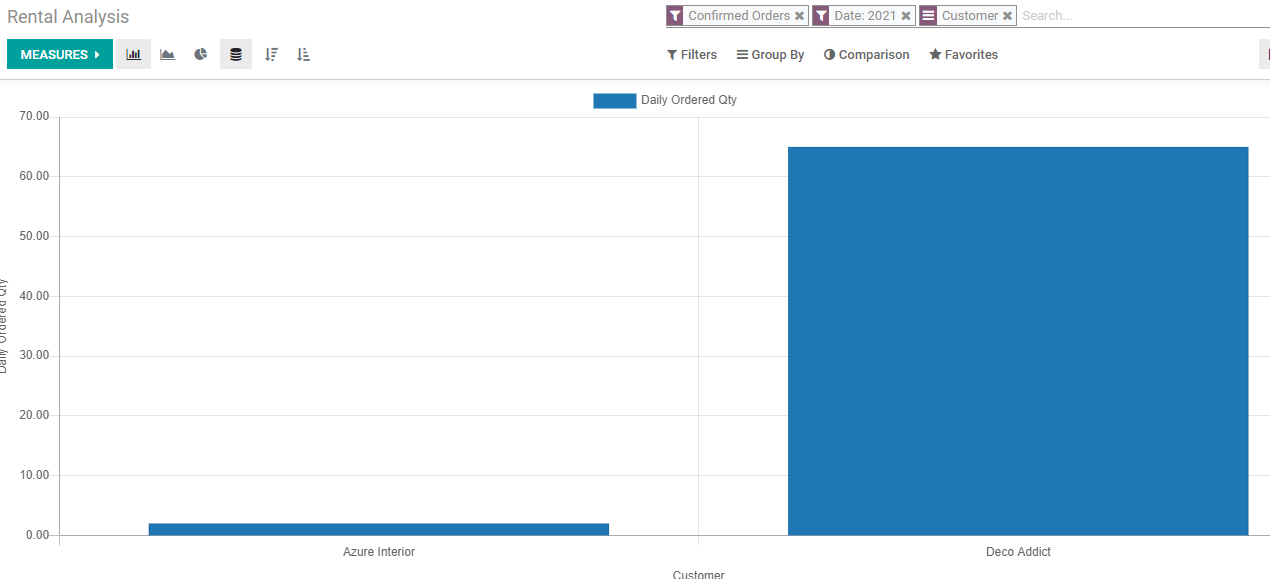
Here, we can find that the company has two customers. We can also view their business rates.
In the same way, we can find the demand for different products, serial numbers, product categories, sales from different states, etc.
Below is the analysis of the demand for different rental products.
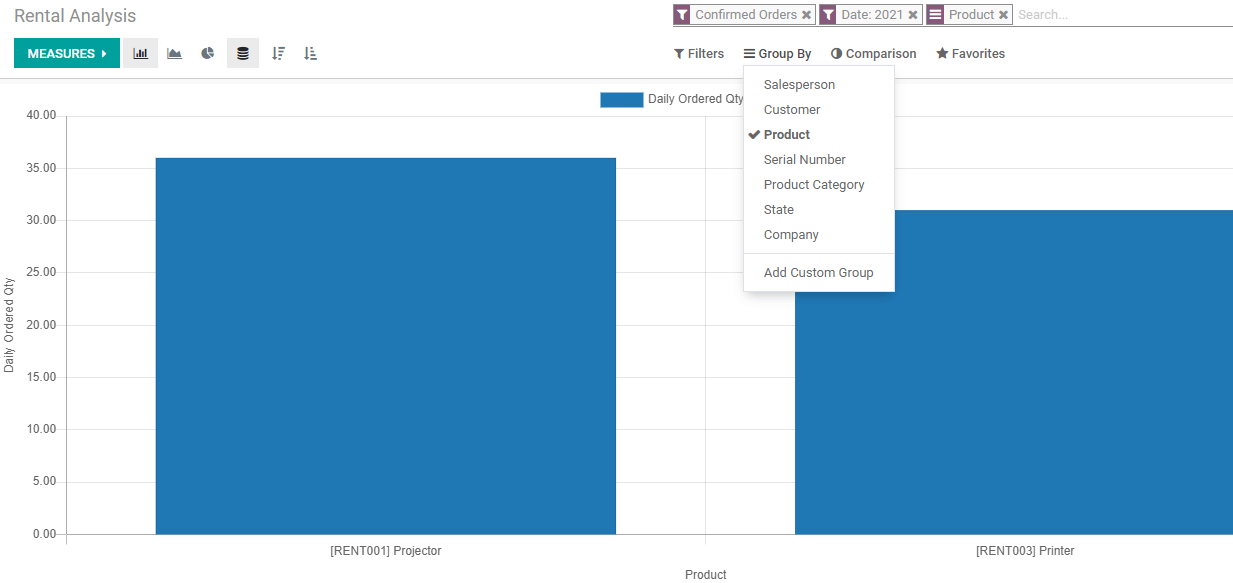
From the above graph, we can understand that only two products Printer and Projector were booked or rented by customers during the selected period.
Comparison
We can compare the performance of the company for different periods. We can compare the period with the previous period. We can also view the comparison for the previous period.
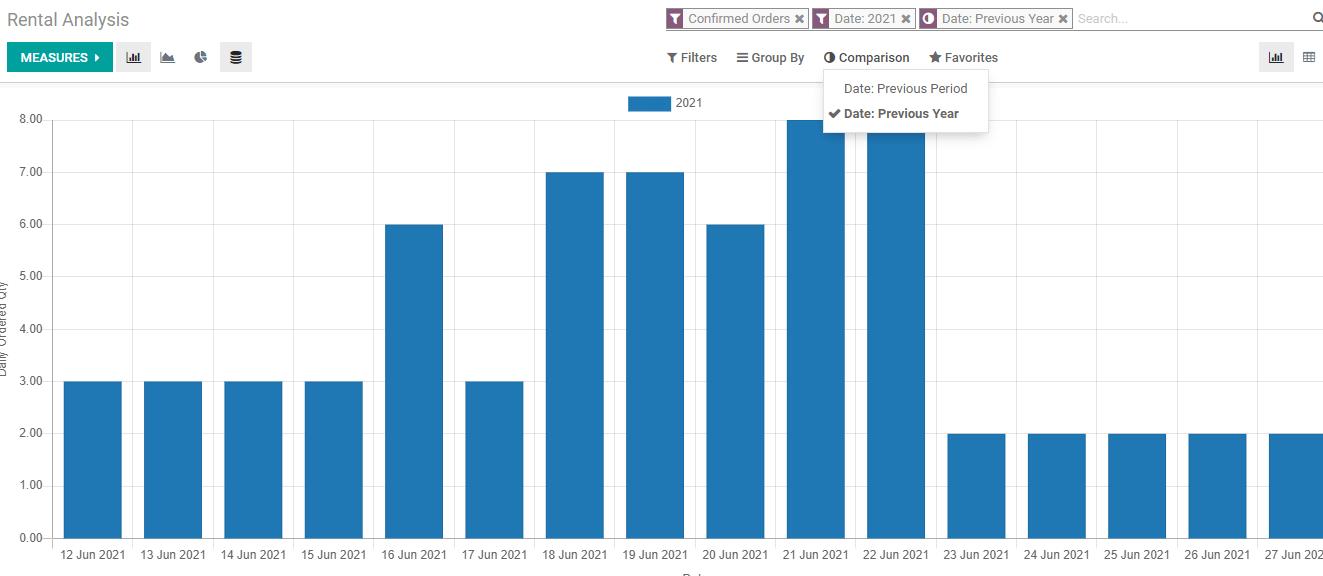
In the bar chart it is not clearly visible as we do not have any data available for the previous year or period. But it could be more clear with the pivot view.
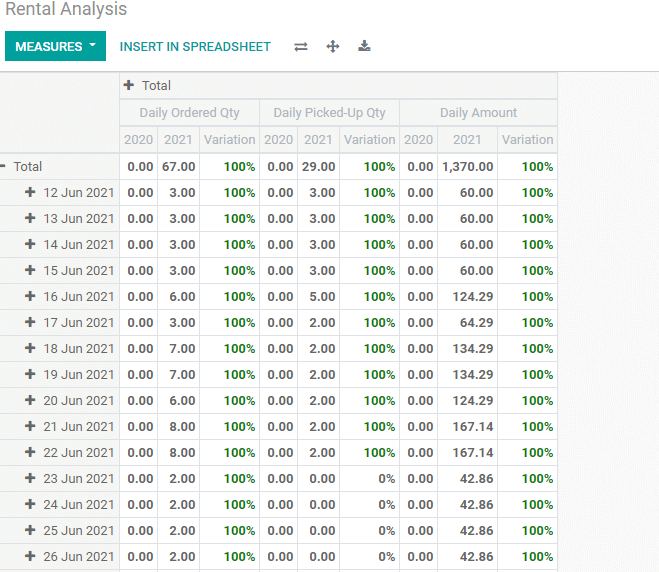
This is the pivot view of the comparison. We can see that the data for 2020 has been taken as 0 as no data is available for the period. That is why we are getting 100 percent of the variation status. If we have data for the previous year we can find whether the company witnessed positive or negative growth during the period.
We can check other aspects of the Odoo Rental module in our new blogs.