Odoo 17 CRM is a modern, intuitive CRM designed for sales professionals. It offers a dashboard for a better overview of sales activities and provides tips for configuration and deployment. The mobile user interface allows users to sell on the go, reduce data entry, and manage their pipeline with ease. The CRM features lead nurturing, lead scoring, import leads, online acquisition, geoIP detection, live chat, deduplication, assignment rules, call-to-actions, URL trackers, and more. Activities and call management to allow users to organize sequences of activities per opportunity, schedule meetings, plan next actions, and have overall visibility of all the CRM-related activities. The software also enables users to quickly initiate VoIP conversations or log calls and analyze missed opportunities. Customers can share an address book among salespersons, and efficient communication is provided through email templates and gateways. Odoo CRM offers customizable filters, grouping, drill-down, and comprehensive reports on sales activities, including trends, leads, and marketing campaigns.
Reporting in Odoo 17 CRM
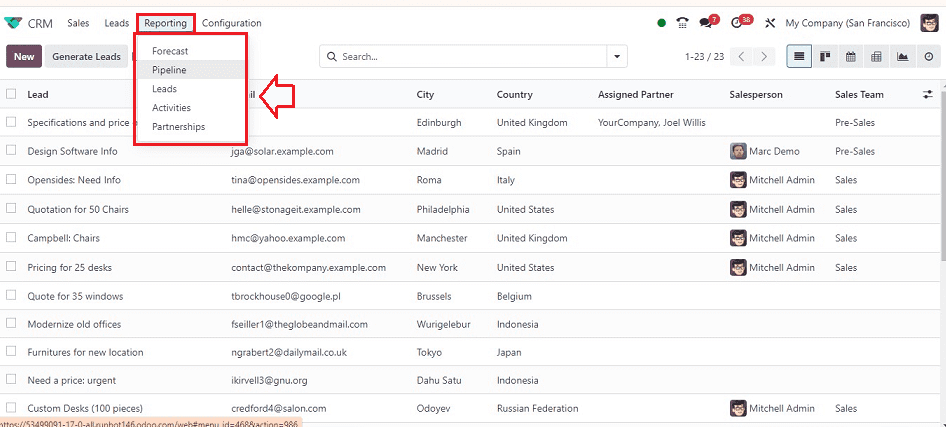
The reporting tool in Odoo's ERP system is an inevitable and important factor since it offers an in-depth analysis of a module's performance daily, monthly, and annually. This feature enables the firm to identify trends, activities, relationships, and leads so that appropriate measures may be taken to increase productivity. The Forecast, Pipeline, Leads, Activities, Partnerships, and Lead Generation views are just a few of the Reporting views available in the CRM module's “Reporting” menu.
Forecast Reporting
For analyzing expected revenues, the Odoo 17 CRM module includes a “Forecast” reporting tool. In order to enhance forecast reports. Users can personalize metrics, groupings, and filters using the platform's Kanban, Graph, Pivot, and List views. The users can track prorated income by using the Kanban view dashboard of the monthly revenue reports.
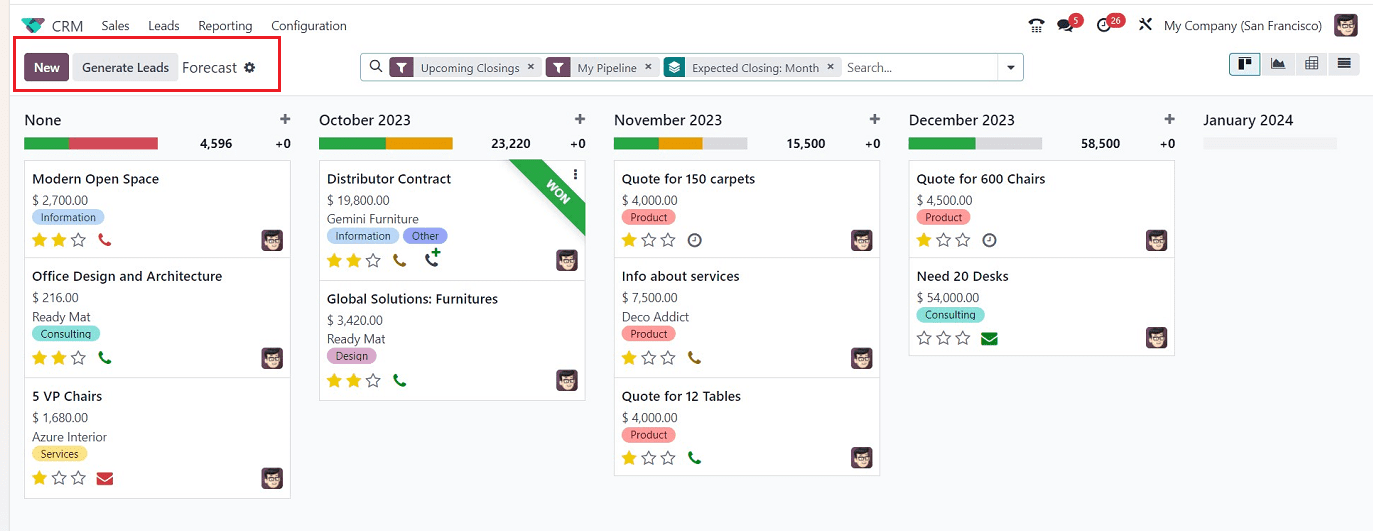
This reporting view is similar to the usual dashboard windows. You can create new Forecasted Pipelines using the “New” button and quickly generate new leads using the “Generate Leads” button. The “Action” menu can be used to Import the Report records and create Articles, Dashboards, and Spreadsheets. Inside the Forecast reports window, you can open each Kanban view of the Forecasted Pipelines or Sales Orders to access its form view. You can check the Graphical view of the reporting window by clicking on the Graph icon.
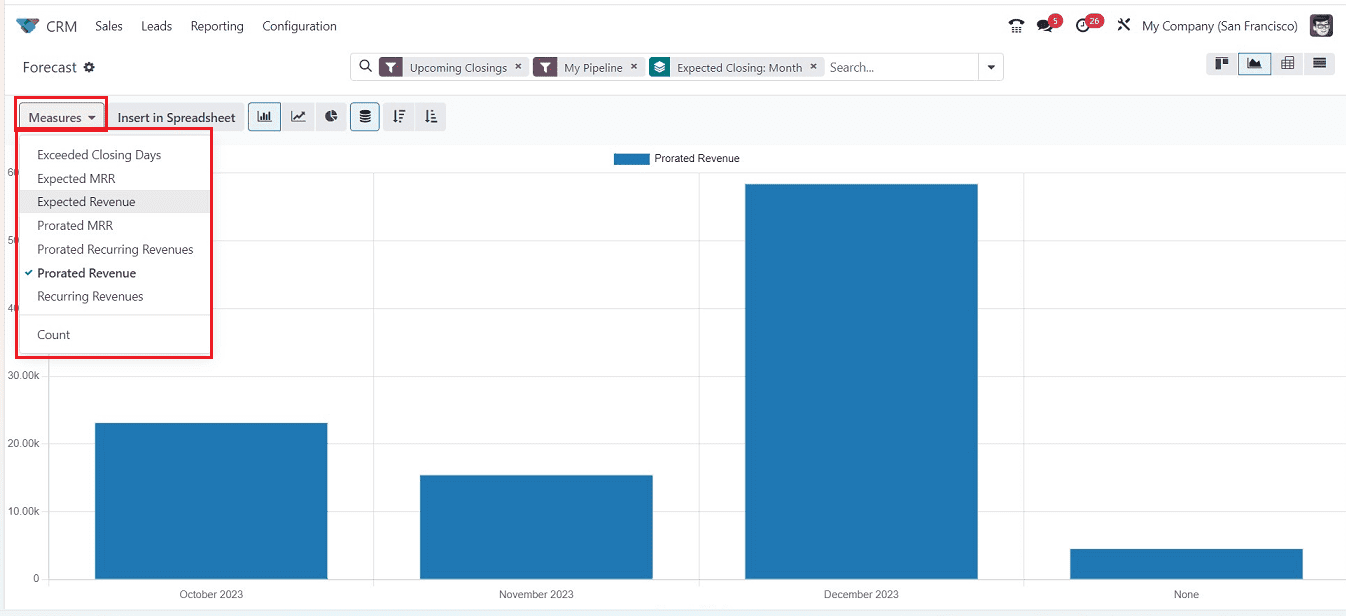
Various options provided in the "Measures" portion of the graphical view can be used to alter the forecast reporting viewpoint. Using the advanced search bar, you may categorize, sort, and filter the data as well. To get complex report analysis, several graphical perspectives may be employed, such as line charts, pie charts, stacked bar charts, ascending bar charts, etc.
Pipeline Reporting
The "Pipeline" Reporting feature in the Odoo 17 CRM module enables users to quickly obtain the report of generated pipelines, which can be seen in the Graph view on the X-axis and the Count on the Y-axis.
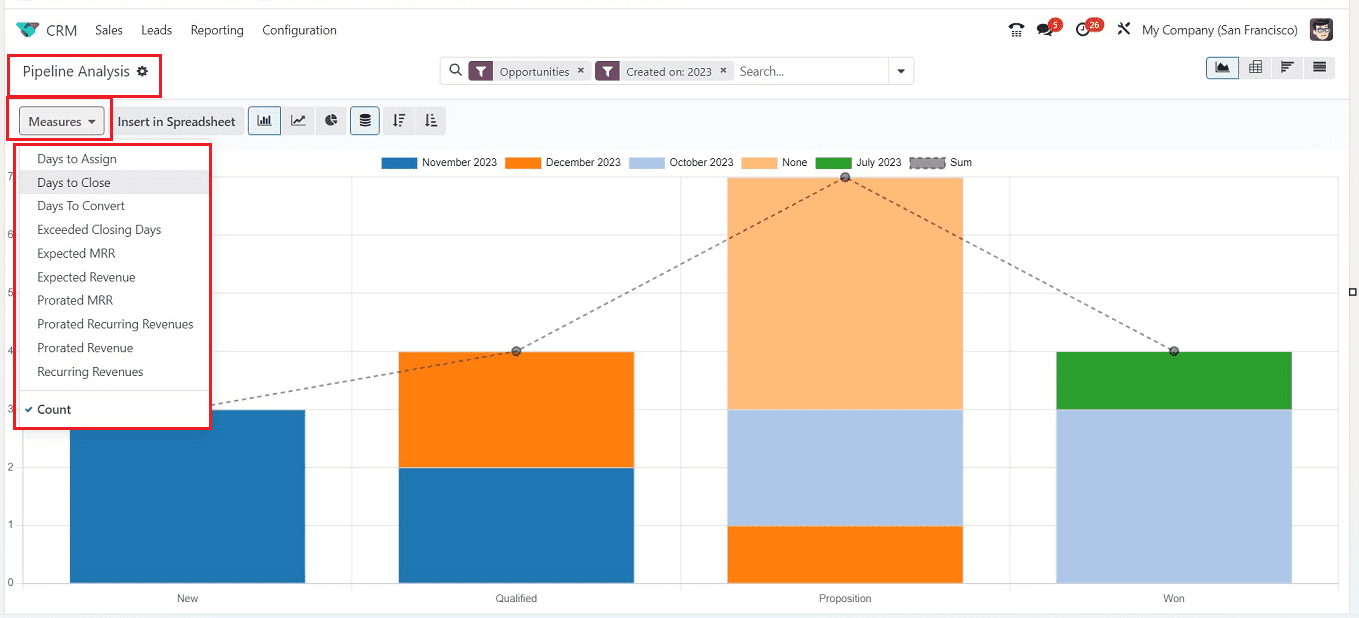
The “Measures” button can be used to set the graphical representation to display the count of each stage in a year, with measures like Days to Assign, Days to Close, Expected Revenue, Expected Closing Days, Expected MRR, Prorated MRR, Prorated Revenue, Recurring Revenues, and more can be added.
A dashboard for examining graphical, pivotal, and cohort data is available in the Pipeline analysis window. The Cohort table can be sorted by month, day, week, and year and shows the average of pipelines based on a closure date at a percentage rate. The Pie chart format allows for data in a circle format, with each stage count displayed in different colors.
Leads Reporting
The Leads reporting platform in the Odoo 17 CRM module allows users to view reports for all leads created through multiple channels. You may efficiently analyze the leads in the module and make wise decisions to optimize the lead creation operations by utilizing sophisticated reporting capabilities.
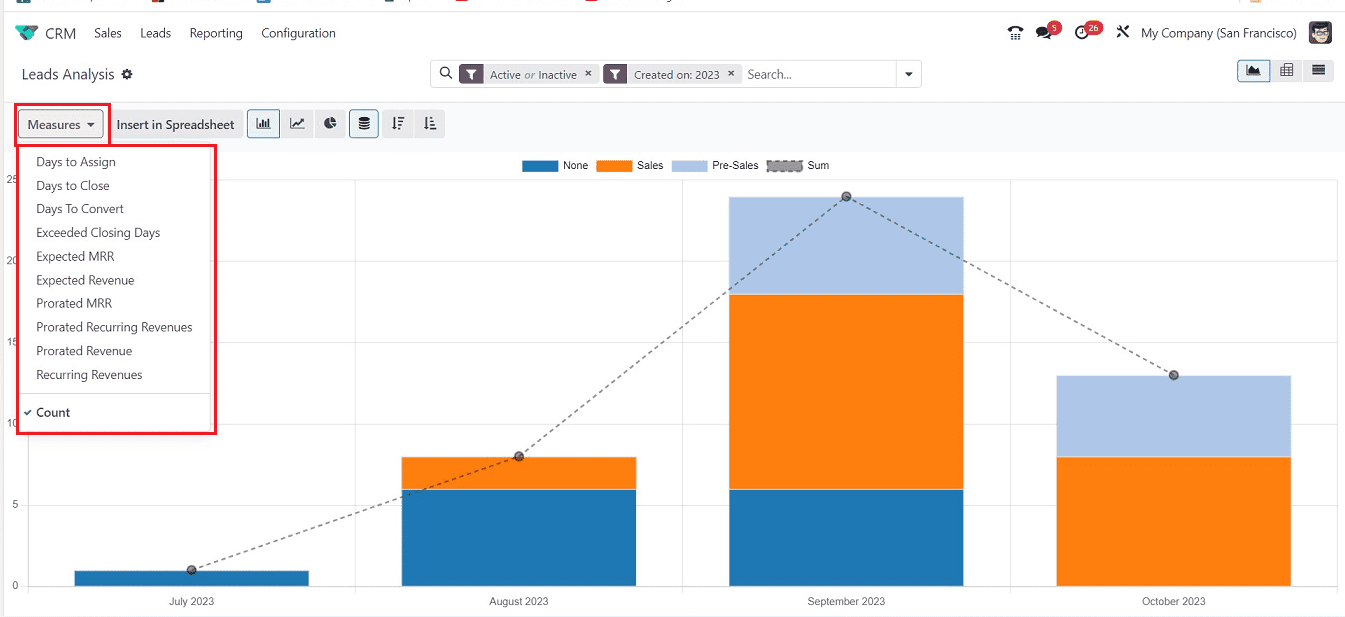
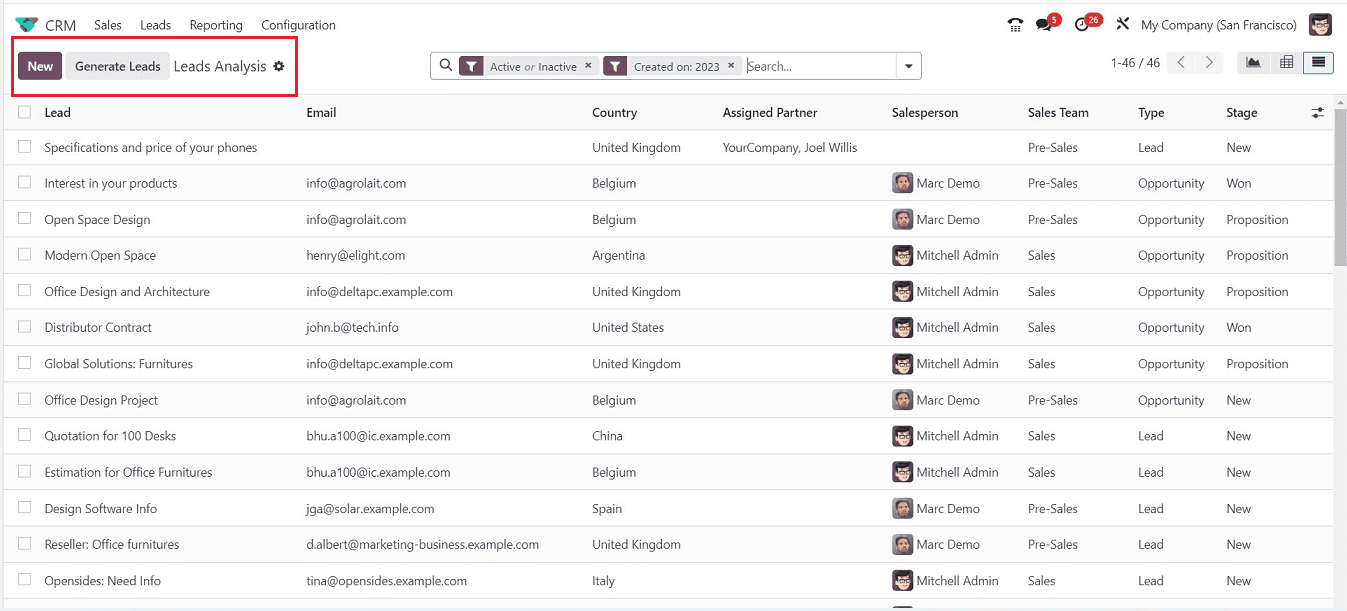
The Lead Analysis window's Graph view offers a graphical depiction of the lead count for various months. Users can customize the report display using the "Measures" button depending on several parameters, including Days to Assign, Days to Close, Expected Revenue, Expected Closing Days, Expected MRR, etc. You can also insert spreadsheet data into the reporting session using the “Insert in Spreadsheet” button. The List view provides a record of all leads, including email, stage, company, lead, and salesperson details, in a dashboard, as shown below.
Activities Reporting
All planned and completed activities in the Odoo 17 CRM module are reported under the “Activities” option under the “Reporting” menu, as shown below.
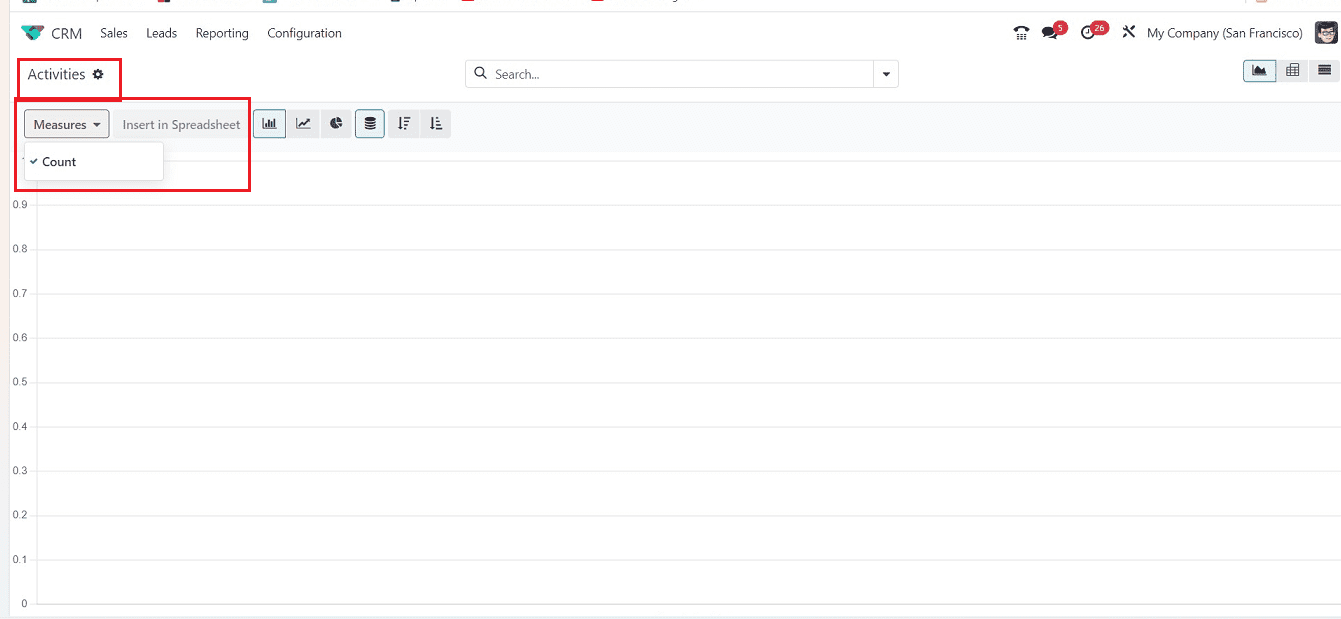
The “Activities” reporting tool enables easy examination of business operations, including leads, on the Y-axis of the graphical view. Inside the “Measures” section, activity counts are shown. The "Insert in Spreadsheet" button in the Activities window allows users to pick a spreadsheet for the graph. Now, the section seems to be empty.
Partnerships Reporting
Users may create reports on opportunities they've created with their partners using the “Partnerships” Analysis platform, which is located under the “Reporting” menu. It offers a graphical representation of financial turnover with partners.
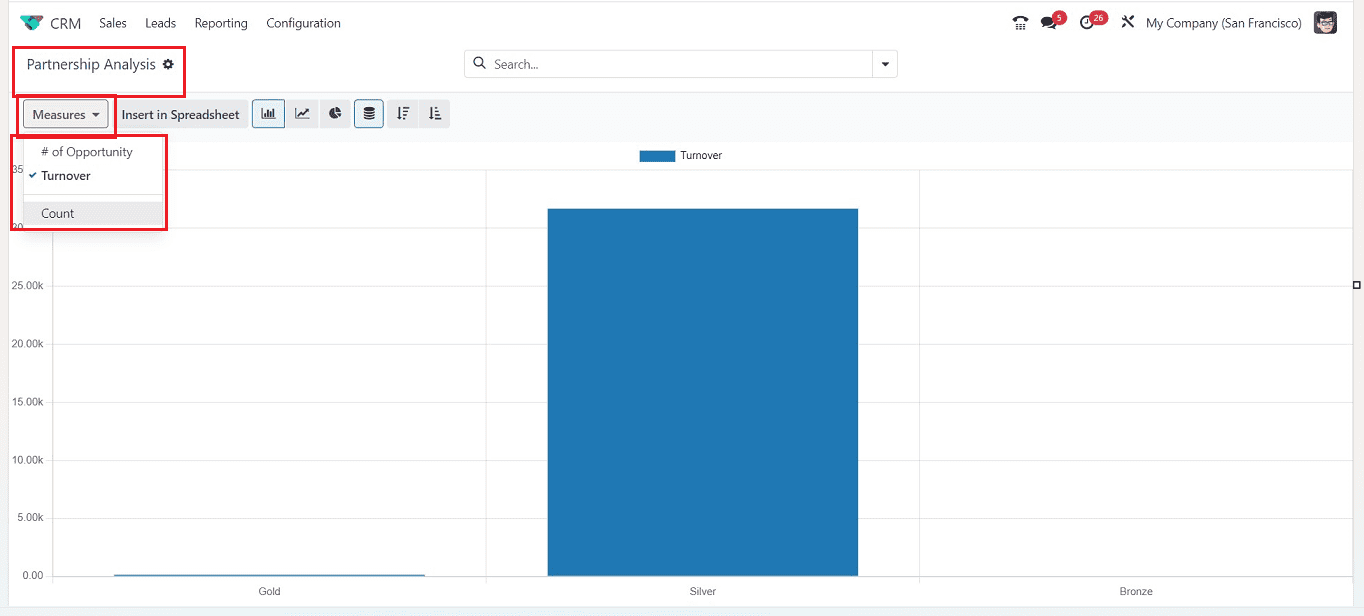
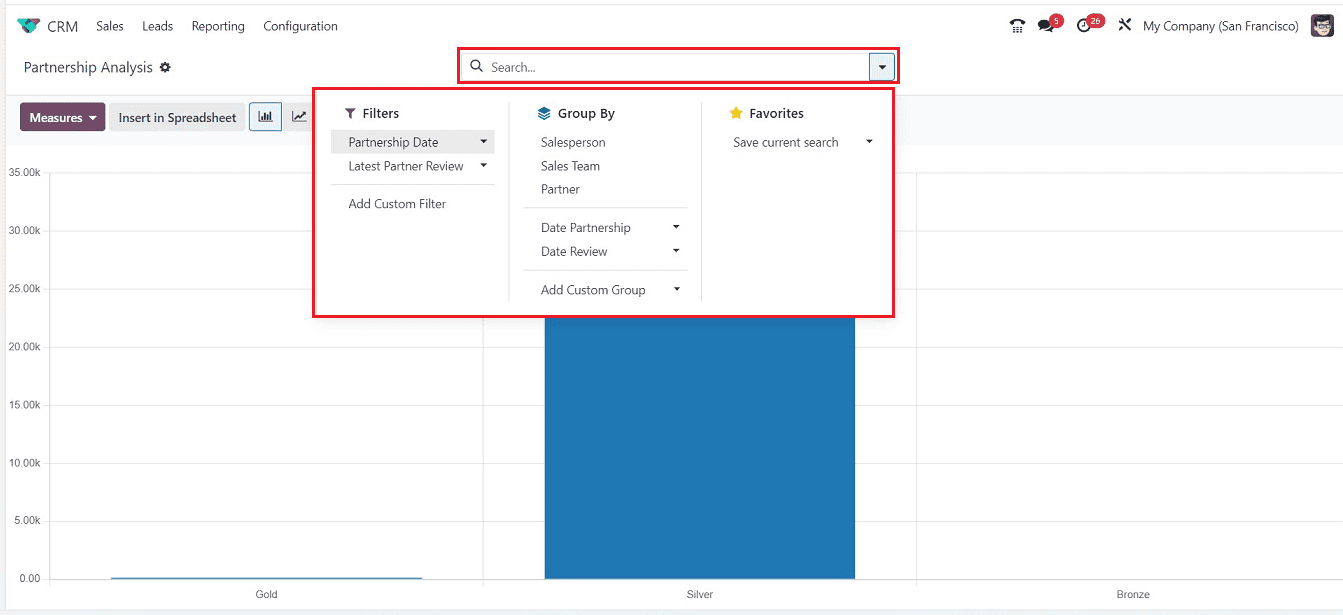
For rapid data review, the Partnership Analysis window shows a graphical representation of turnover information on the Y-axis that is also available in Pie, Bar, Stacked, Line, Descending, and Ascending formats. The “Measures” section can be used to change the graphical measures based on the number of opportunities, counts, and Turnovers.
You can sort out the required data, group data, and mark your favorite data using the “Filter,” Group By,” and “Favorites” options provided inside the advanced search bar located in the Odoo 17 application platform.
These are the Reporting sections provided in the Odoo 17 CRM platform. Odoo ERP's Reporting feature allows users to analyze data in specific modules, and companies can make improvements at the end of every year and create revolutionary modifications in certain areas.
To read more about reporting features in the Odoo 16 planning module, refer to our blog What Are the Reporting Features in the Odoo 16 Planning Module