The Recruitment module in Odoo 18 is a powerful tool designed to simplify and automate hiring for companies. It accounts for HR posting jobs, following applications, scheduling interviews, and even collaborating with a hiring team, all within a single framework. The Odoo 18 Recruitment module’s Reporting feature is essential for assisting HR managers in making well-informed hiring decisions. It offers visual insights and real-time statistics on a range of recruitment measures, including source efficacy, time-to-hire, pipeline status, and application volume. Organizations can evaluate their recruitment performance and refine strategies using these insights. With the use of graphical reports, pivot tables, and configurable dashboards, Odoo 18 enables hiring teams to transform unstructured data into actionable insights. This blog helps you learn about the features of the Reporting option in Odoo 18's Recruitment module.
Firstly, install the Recruitment module from the Odoo App store. There, we can manage job positions, schedule interviews, and track applications.
In the Recruitment module, navigate to the Reporting option. When you click on the Reporting option, you can see four types of reporting options - Applicant Analysis, Source Analysis, Velocity Analysis, and Team Performance.
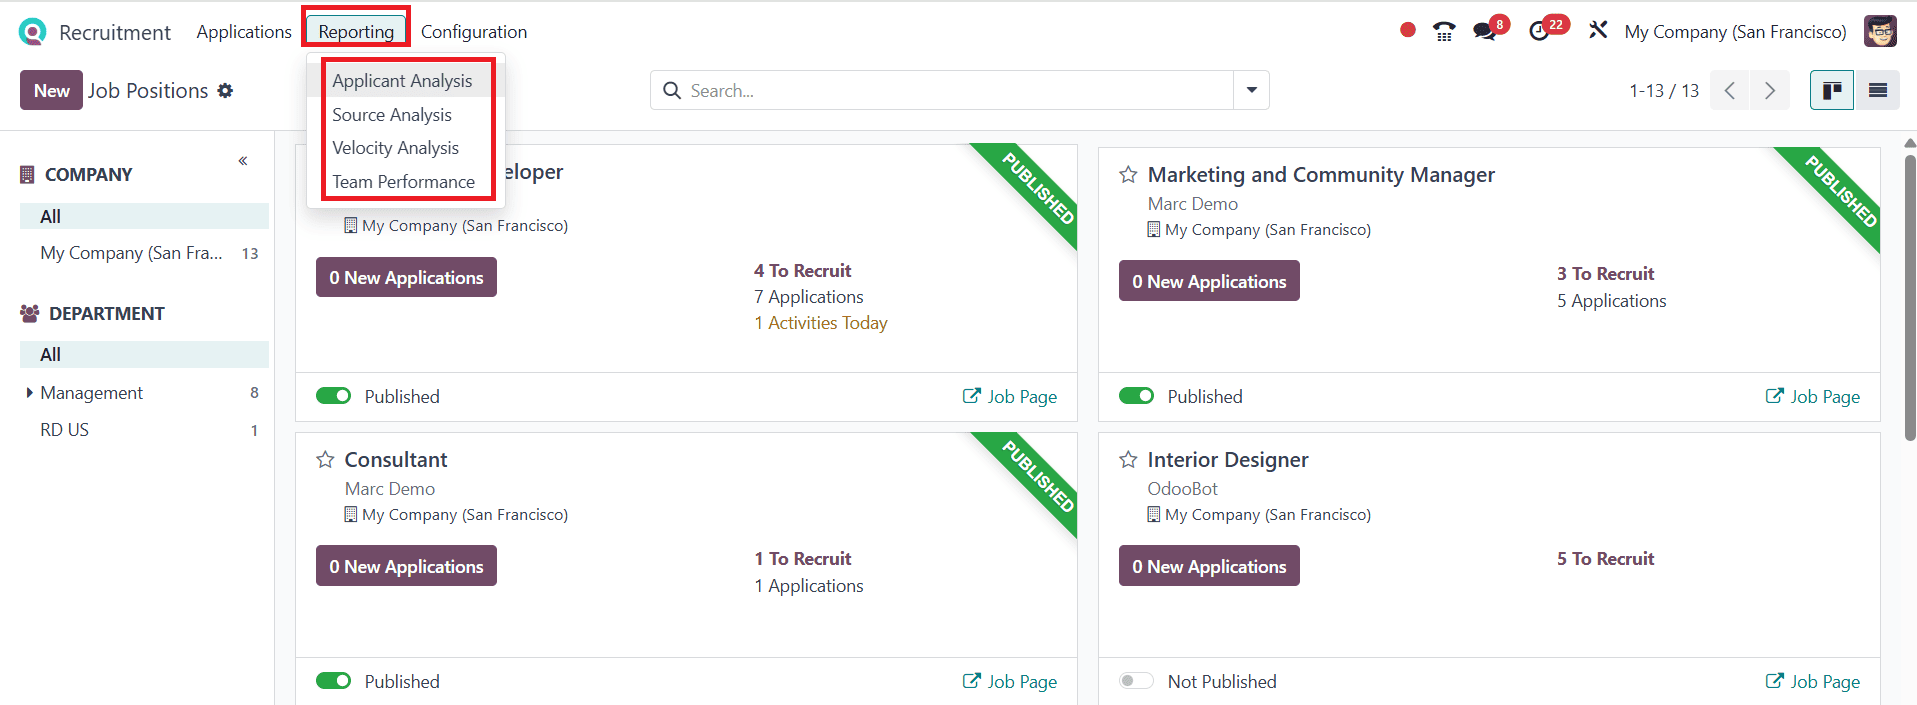
Applicant Analysis:
A key aspect of the Odoo 18 Recruitment module is Application Analysis, which enables HR managers to evaluate and analyze application data in an organized and insightful manner. It helps to monitor candidate progress, assess qualifications, and find job vacancies and recruitment campaigns.
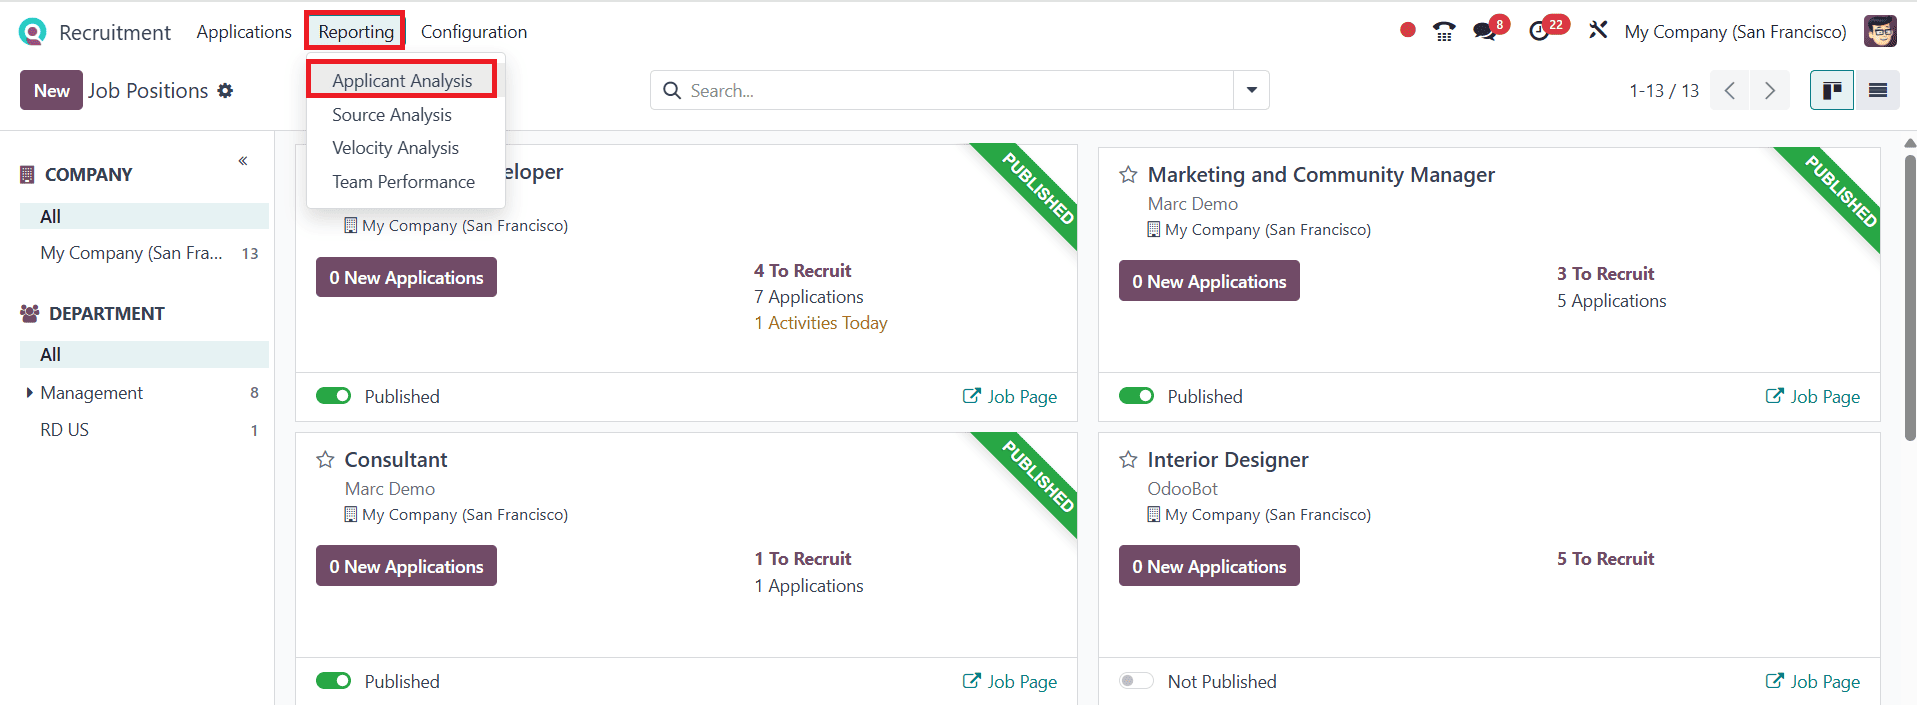
Select the Applicant Analysis from the Reporting tab as shown below:
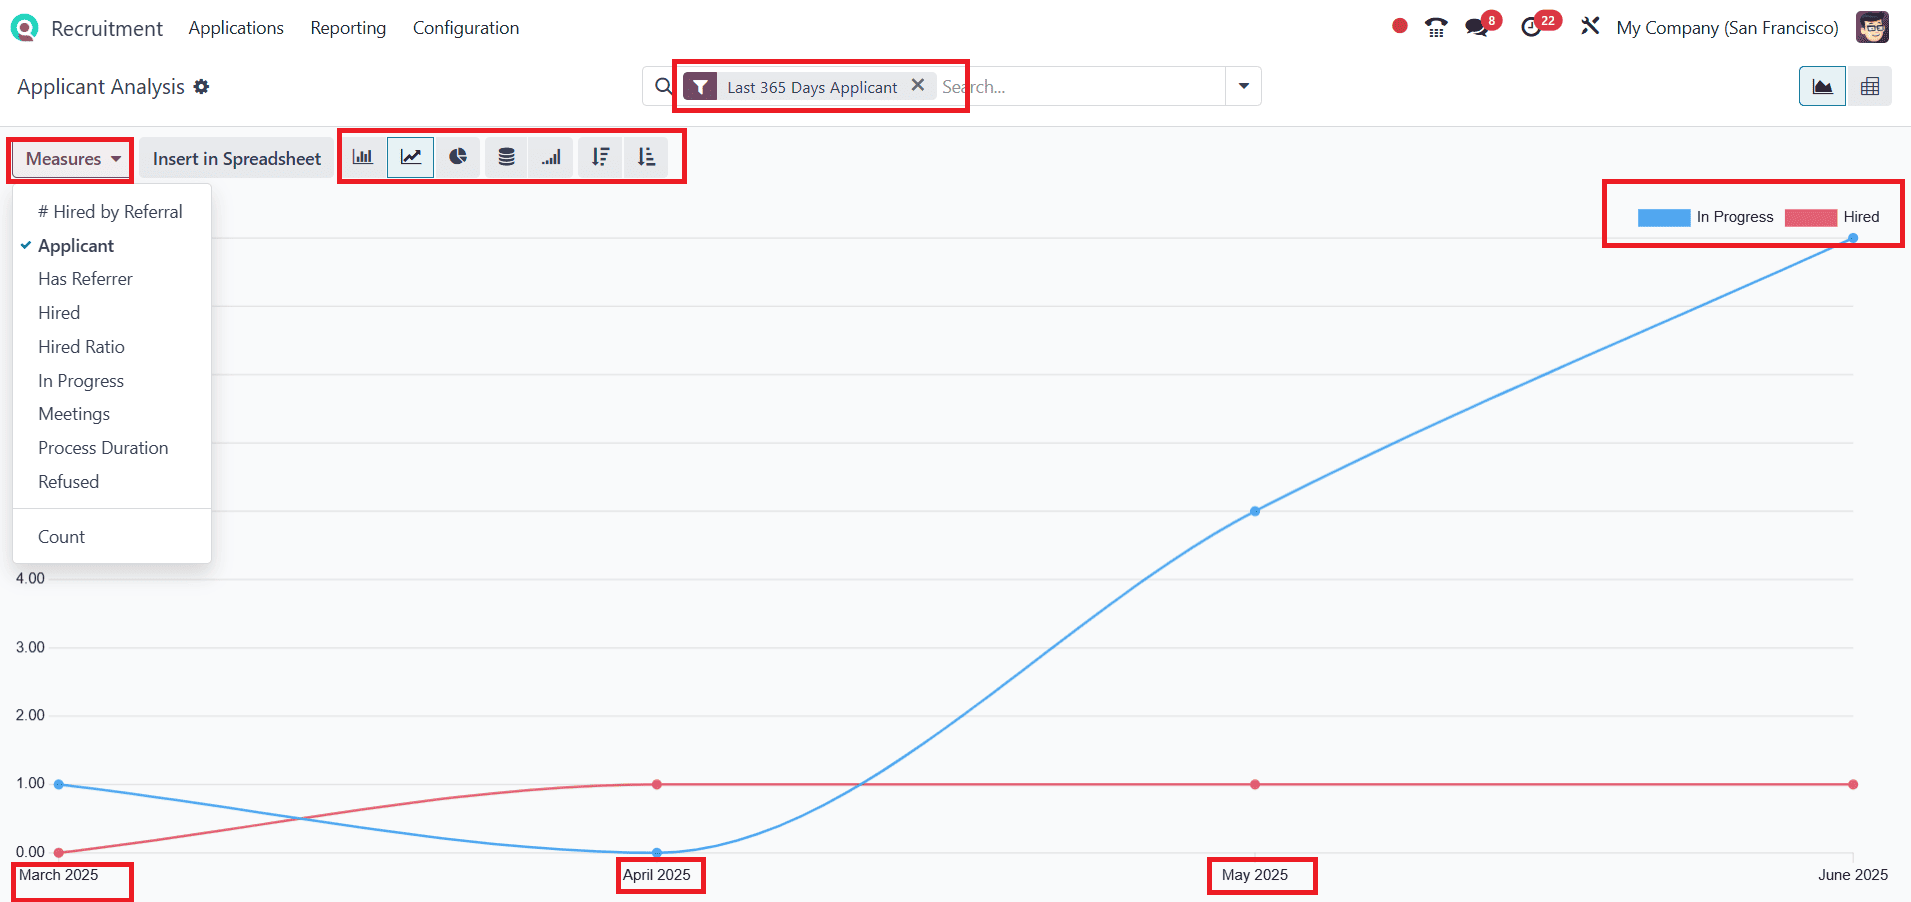
You can use the filter option to arrange the details of applicants. Here, the graph shows the details of applicants from the last 365 days. The X-axis of the graph shows the source data of the applicants in different months. The Y-axis indicates the number of applicants. You can analyze the graph as In Progress or Hired. You can also arrange the graph in the form of a bar graph or a pie chart and set it in ascending or descending order. By clicking on the Measures options, you can select several other values for the graph as shown below:
To change the view type, click on the Pivot view. Here you can see a list of job positions arranged. Then, click on the Experienced Developer or any other appropriate option, and you can see the various options, including State, Job Position, Applicant Name, Source, Medium, and Company. Select Applicant Name as shown below:
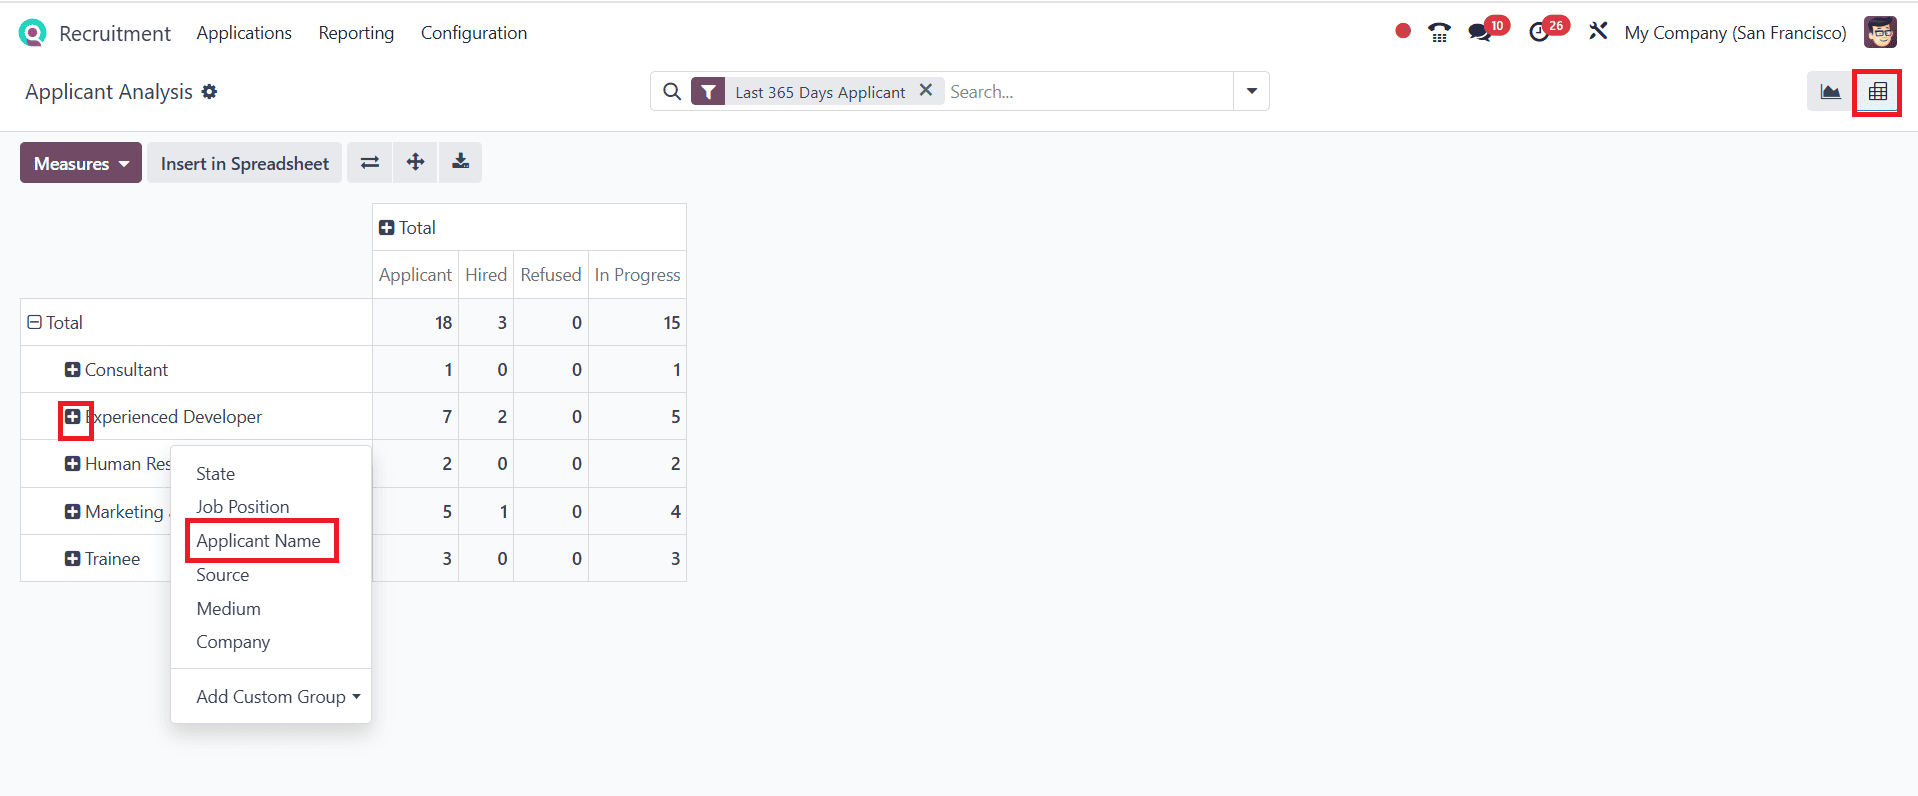
Based on each applicant's name, the applicant analysis is shown below:
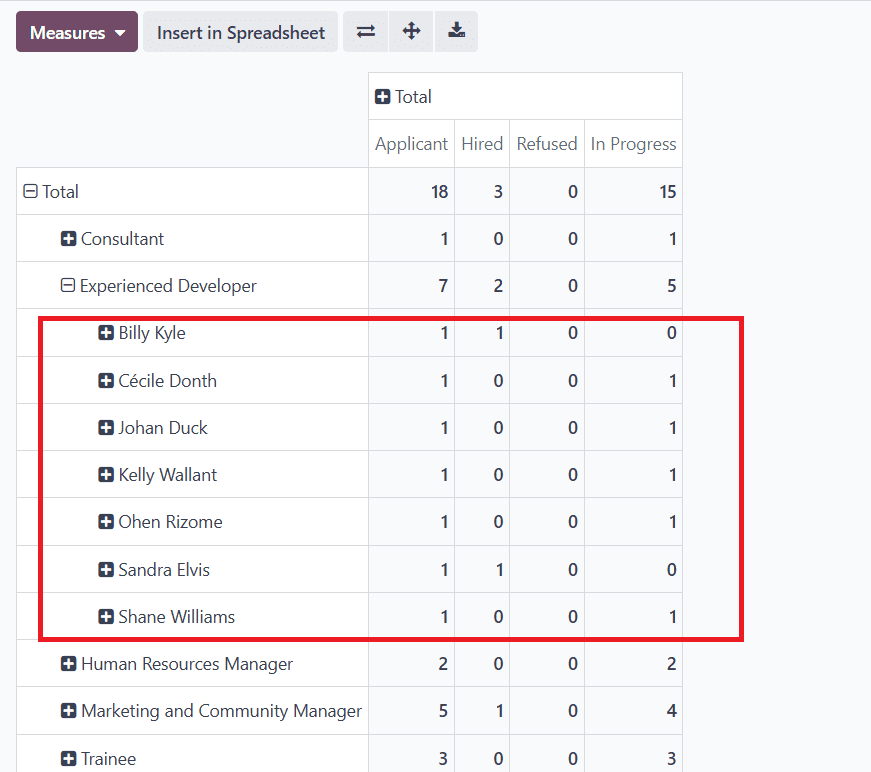
Click on the Flip axis icon to switch the information arrangement to rows (source) and columns (job positions). Here you can also expand and download the information.

Source Analysis:
Source Analysis of the Odoo 18 Recruitment module helps HR managers identify which sources are producing the best job candidates. Odoo gives a view of the quality and quantity of applications per source by monitoring the source of each application.
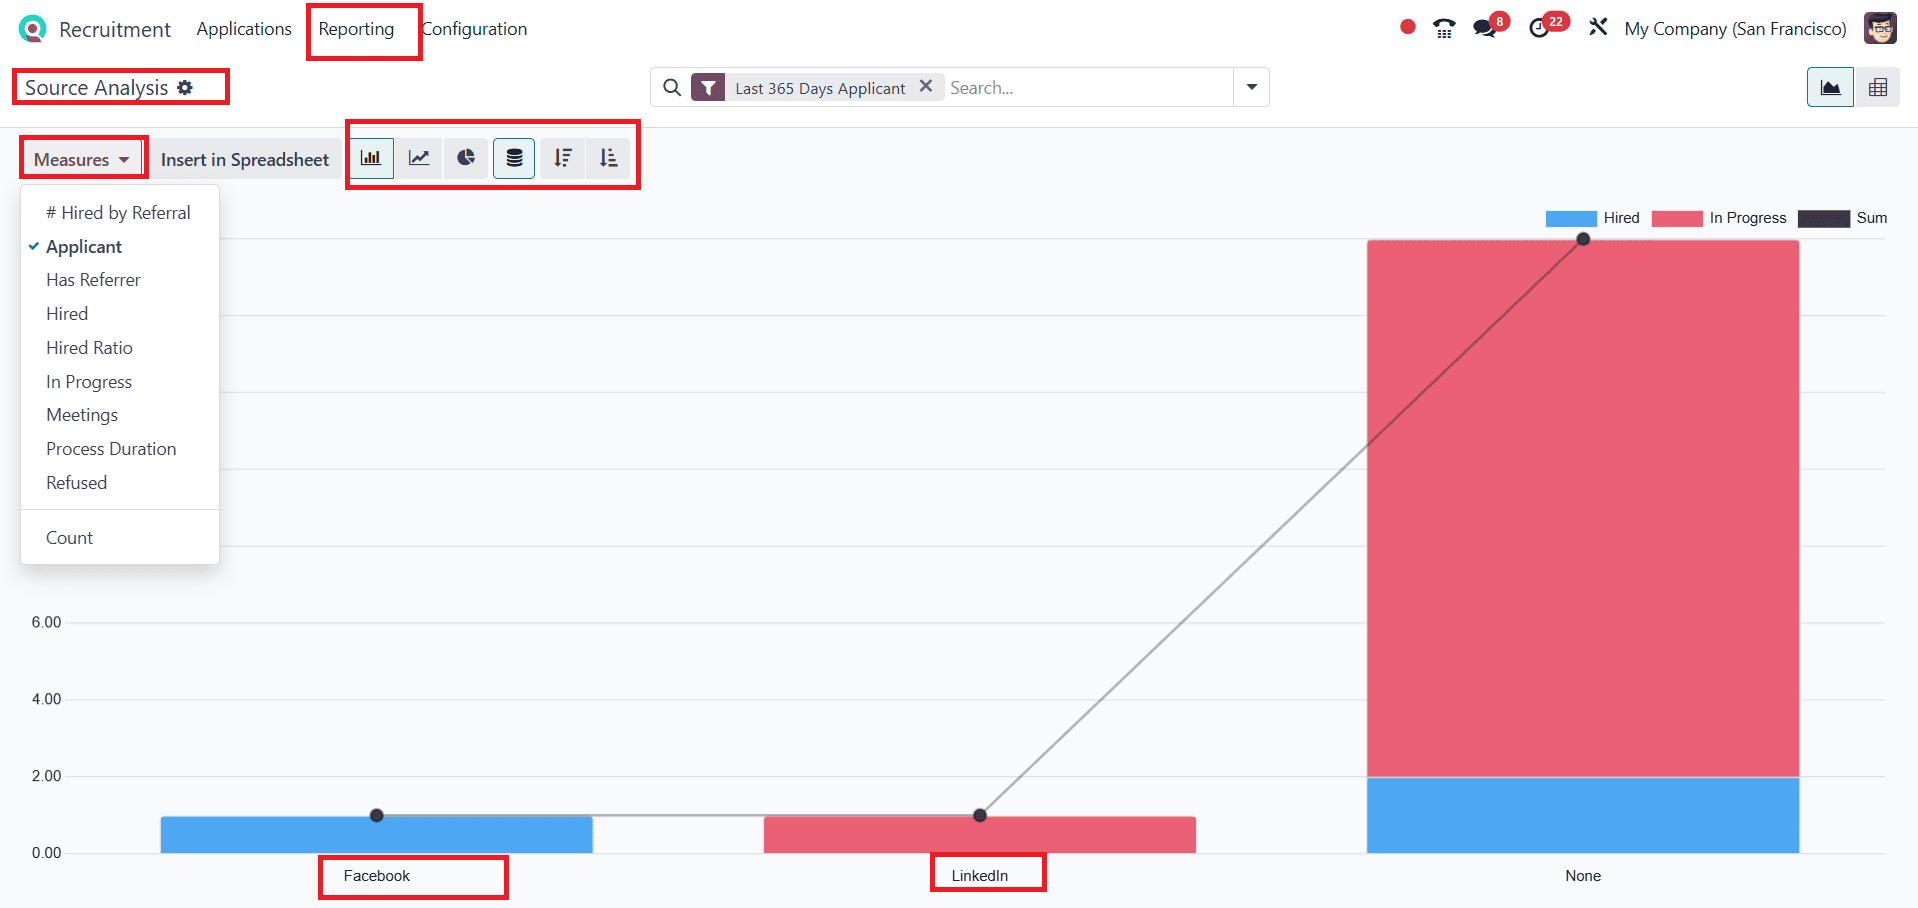
To get the Sources Analysis, navigate to the Reporting tab and then select Sources Analysis. Here, the x-axis represents the sources of the application, and the y-axis indicates the number of applicants. You can also add more options to the graph by clicking on the Measures option, as mentioned above. You can also set the graph to display as a bar chart, a pie chart, or arrange it in ascending or descending order.
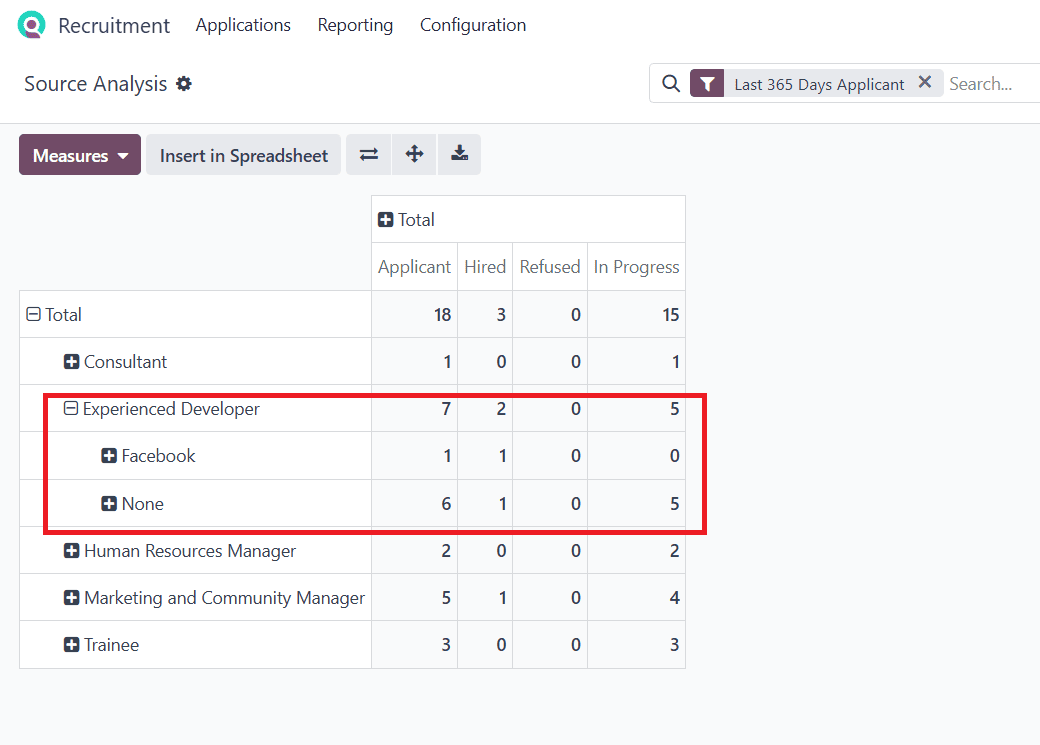
The Pivot view of the Source analysis shows a list of job positions. Click on the Experienced Developer option and select Sources. There, you can see the source analysis of different sources.
Velocity Analysis:
In Odoo 18 Recruitment, Velocity Analysis is the process of measuring how quickly applicants progress through the hiring process. This involves examining the duration that candidates spend in each step, including initial screening, interviews, offers, and hiring, as well as the speed at which these steps are filled.
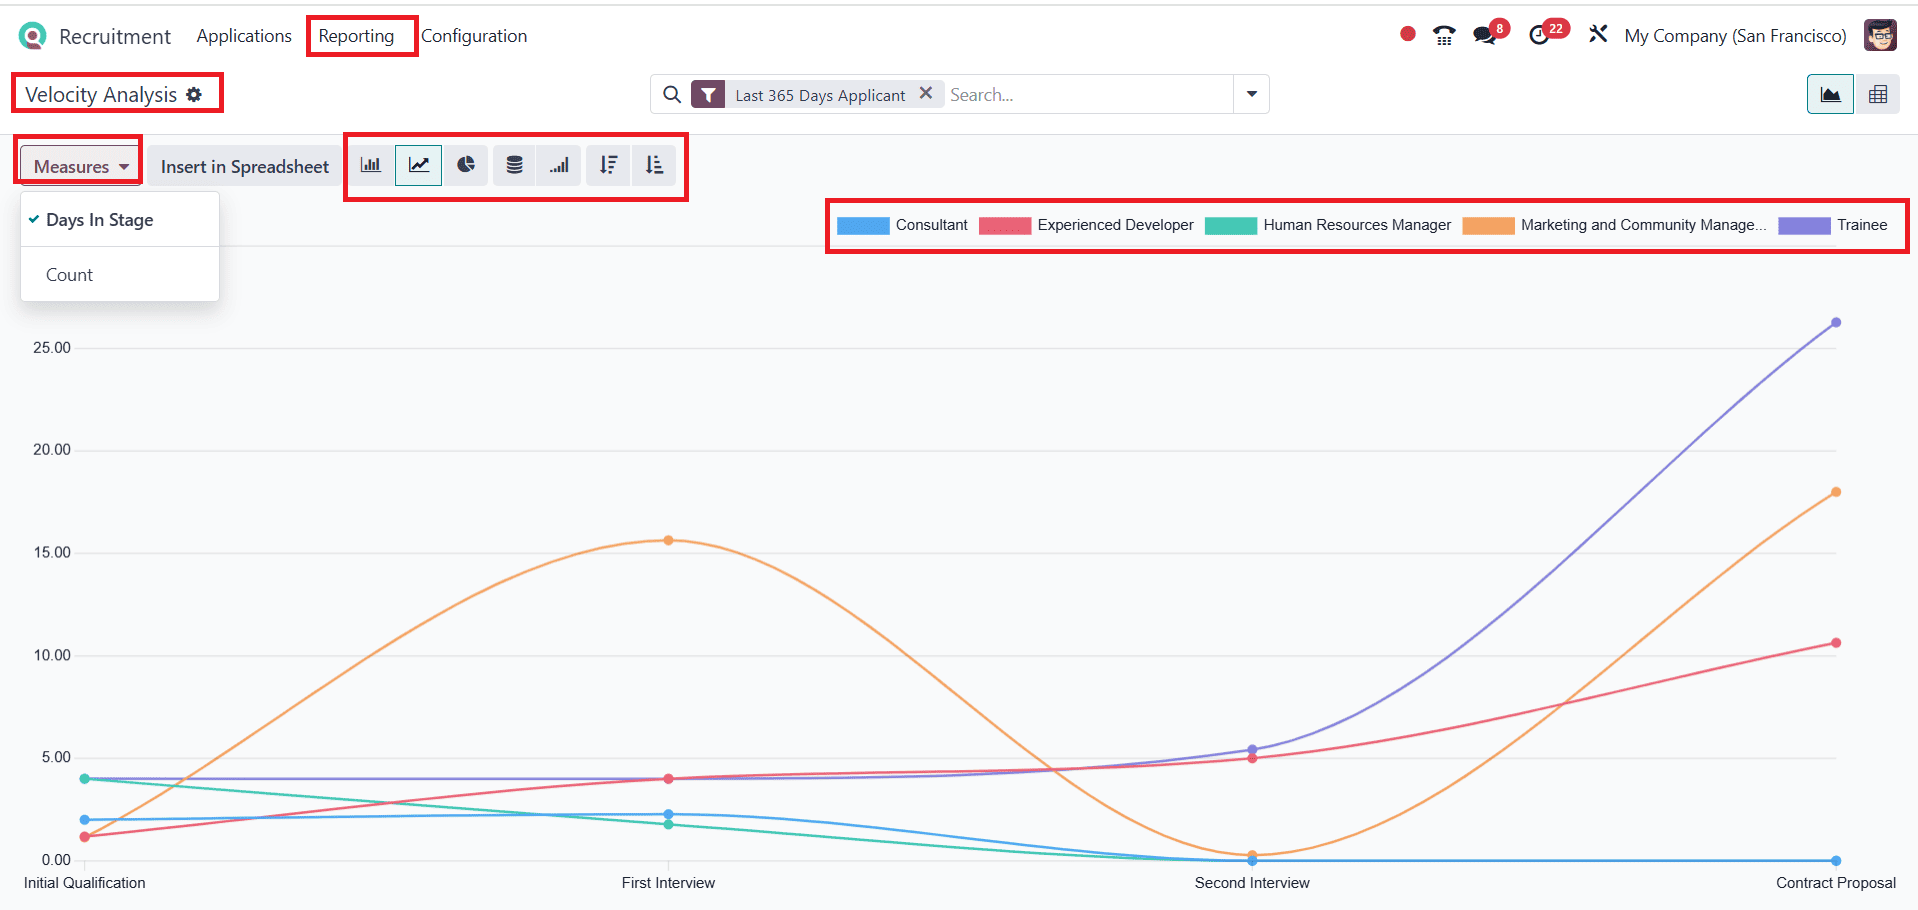
To access Velocity Analysis, navigate to the Reporting tab and select Velocity Analysis. The different colour shows the various job positions. When you click on the Measures button, you can see that the graph is arranged by Days In Stage. You can arrange a graph in the form of a line chart or a pie chart. The X-axis of the graph shows the stages of the hiring process.
In the Pivot View, you can also easily view the details.
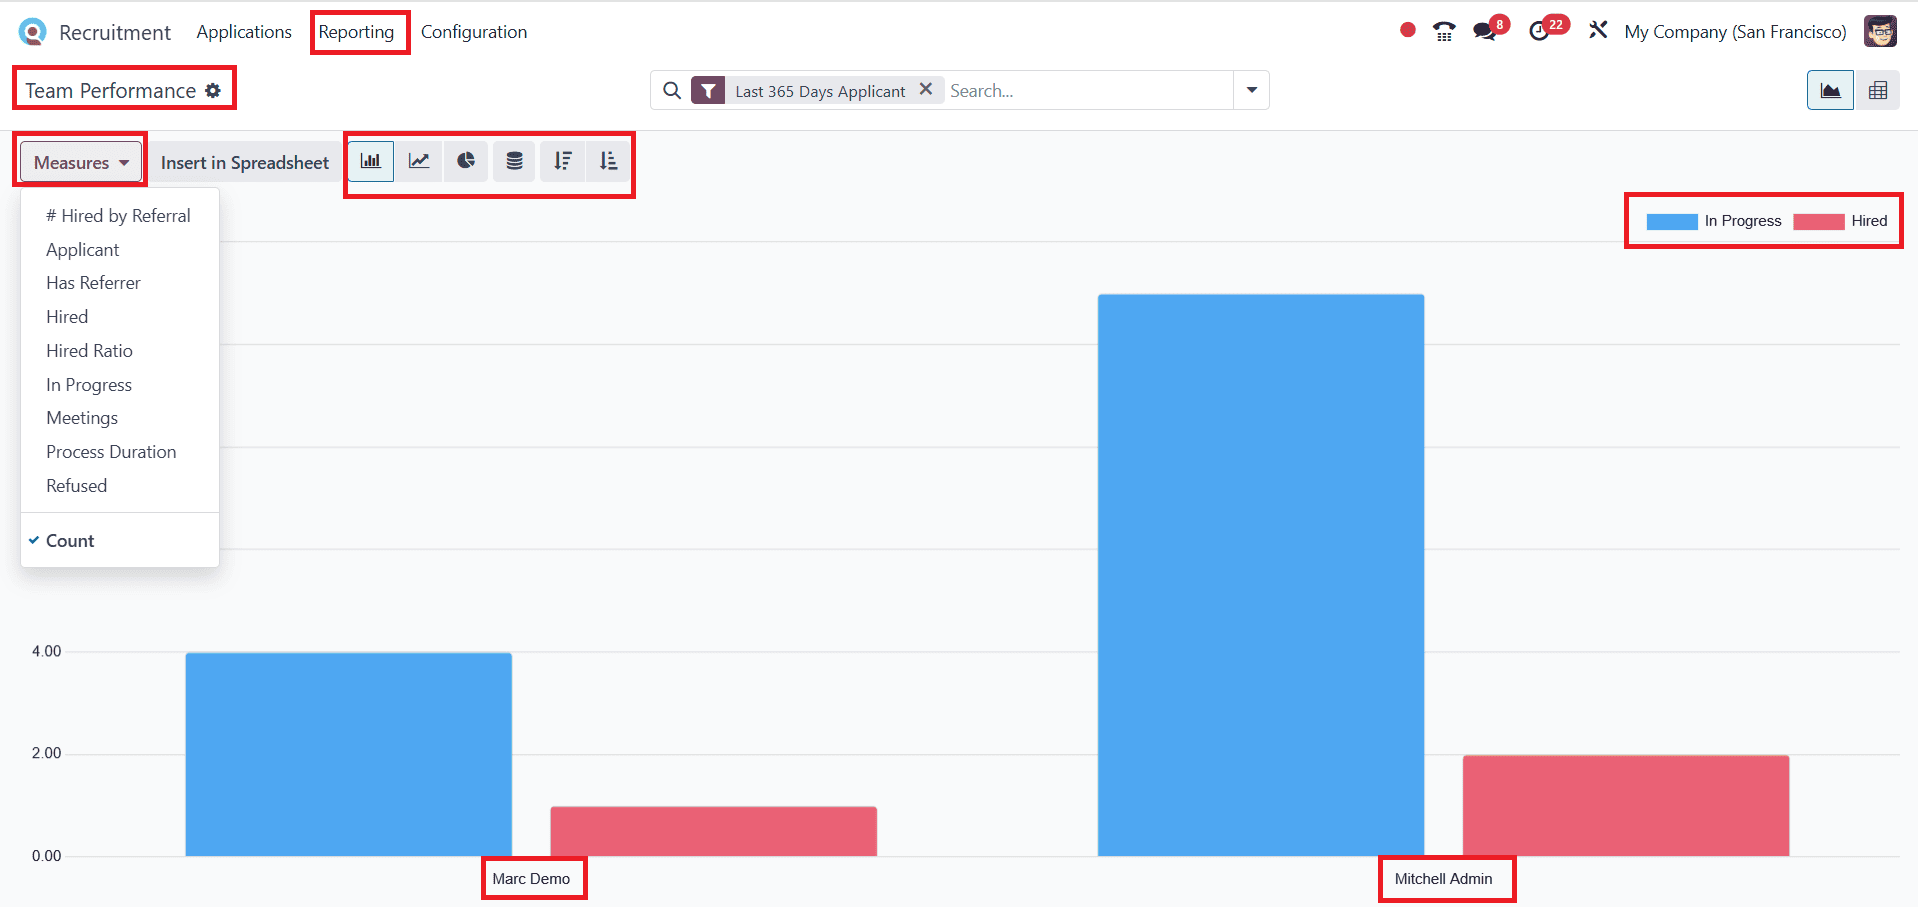
Team Performance:
The Team performance analysis in Odoo 18 Recruitment is designed to monitor and evaluate the effectiveness of the recruitment team, including HR officers, recruiters, and hiring managers.
In conclusion, the reporting capabilities in Odoo 18’s Recruitment module enable organizations to go beyond basic applicant tracking and gain strategic insight into their hiring processes.
To read more about How to Manage Recruitment in Odoo 17 Recruitment App, refer to our blog How to Manage Recruitment in Odoo 17 Recruitment App.