Debugging is the procedure for finding and removing programming errors. Problem simplification, unit testing, bug clustering, backtracking, control flow analysis, coordinated testing, and profiling are examples of debugging approaches. The vast majority of programming and programming development tools include projects to aid in debugging. Even though programming errors are relatively common, we must concentrate on effectively removing them. For software to operate effectively, debugging is essential. For the development of Odoo, several debugging tools are available.
ENABLING DEVELOPER MODE
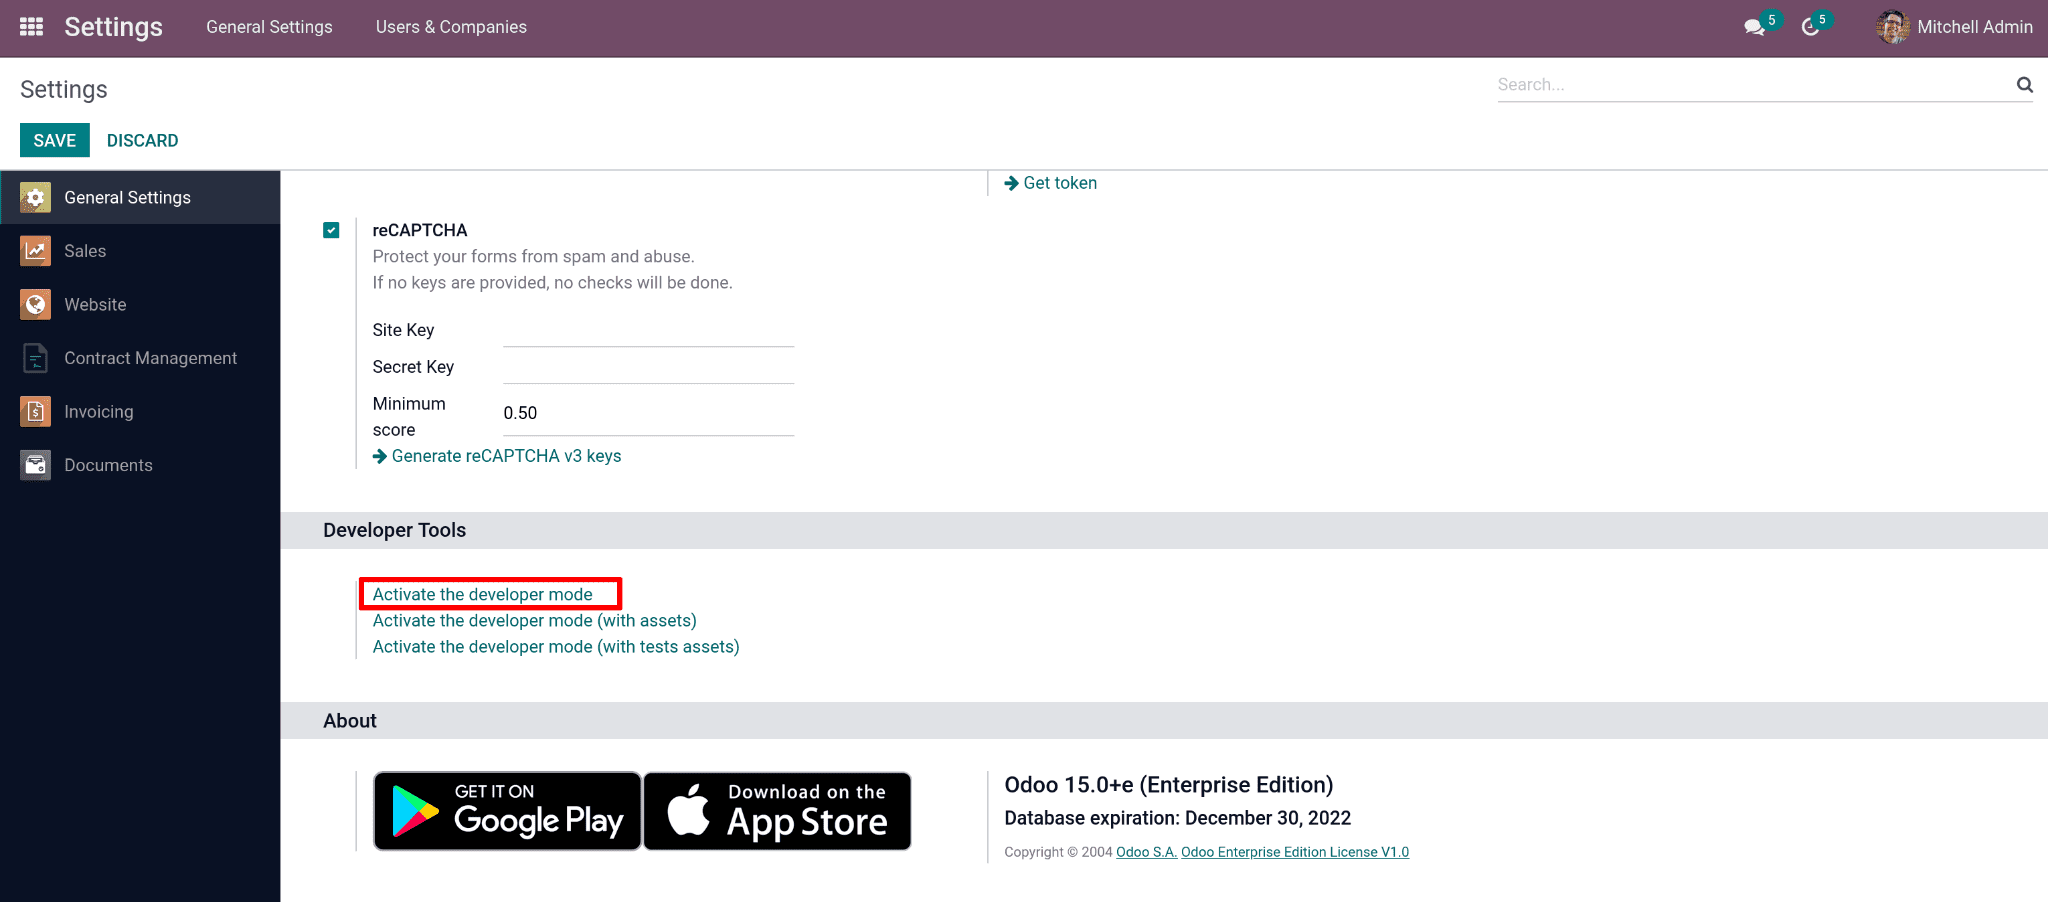
A developer or administrator can obtain technical data about data by using the developer mode tool. As you explore the interface in developer mode, Odoo will provide you with a lot more information on the screen and allow you access to certain technological functions. Let's look at how to activate the developer mode in Odoo ERP.
Go to Odoo interface > Settings > scroll down
Now that developer mode has been activated, when you hover your mouse pointer over a field, information pertaining to that field will be displayed, as shown in the screenshot below.
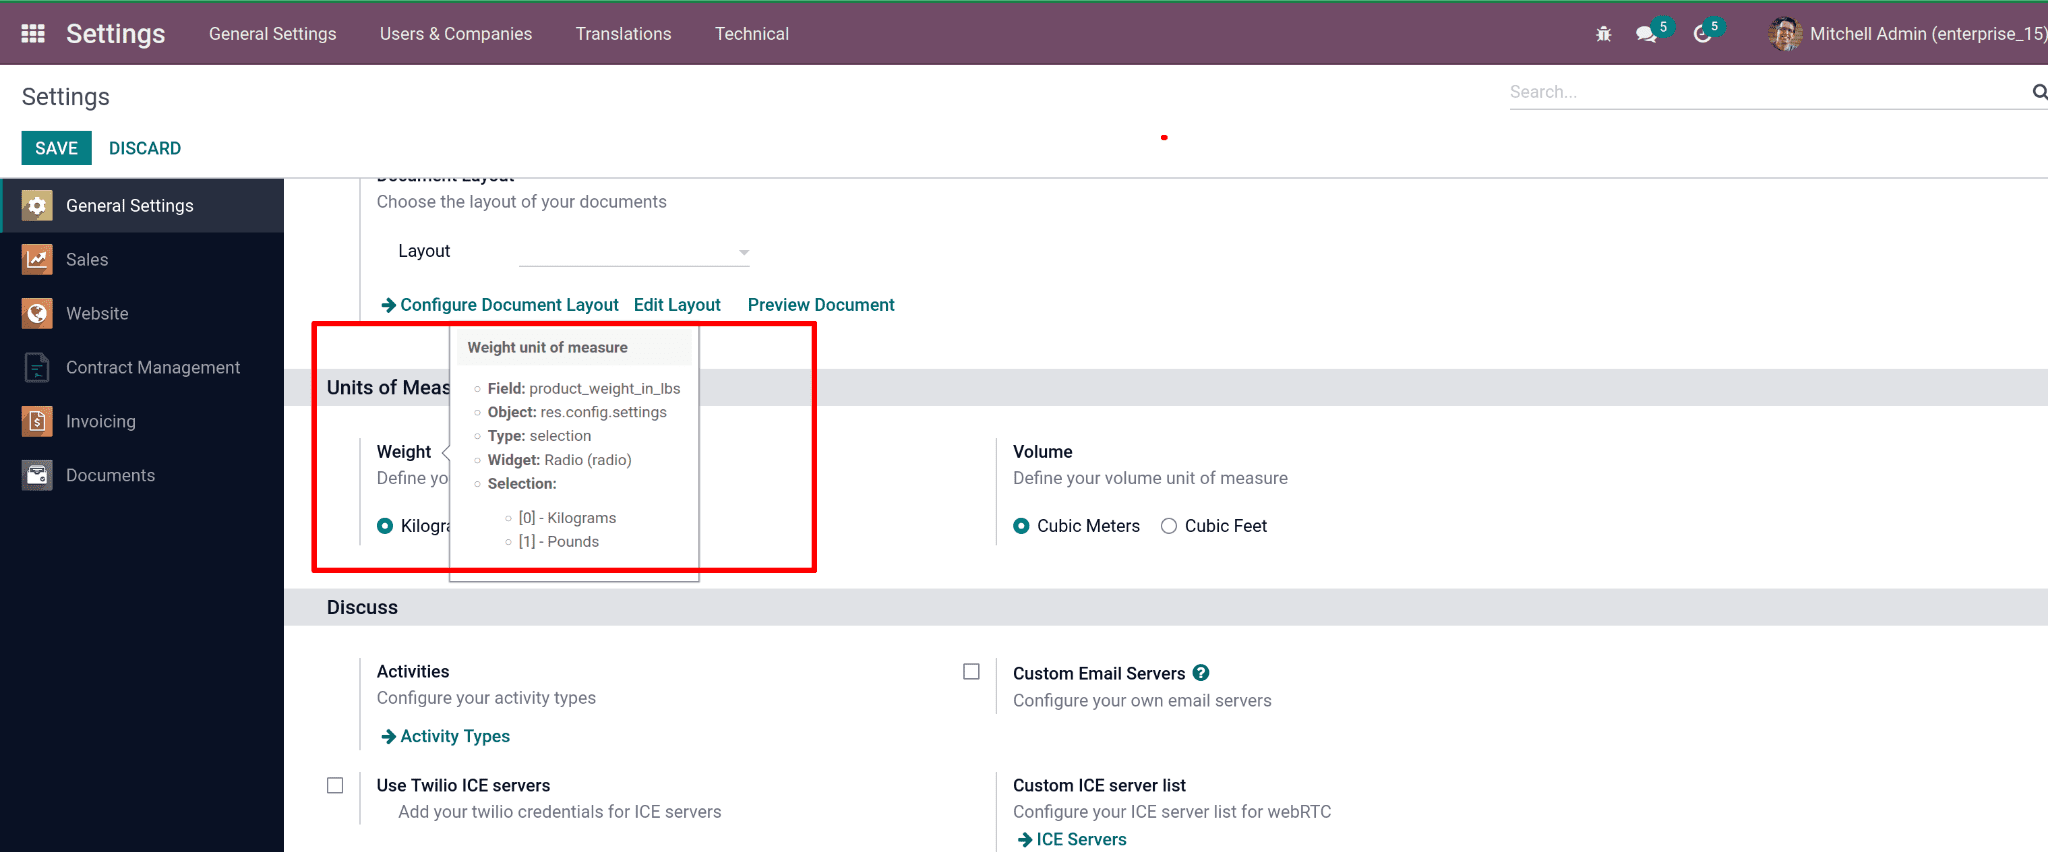
We can now see a field's name, model name, field type, and many other details. Using add-ons for Chrome and Firefox, we can easily enable developer mode. We can get the Odoo debug add-ons, which take more time to use in developer mode, by going to the Chrome Extensions page. Moving on to more sophisticated Odoo debugging, developers can now use the terminal to execute debug. You should conduct it as a regular user, for instance (no root).
/usr/bin/odoo.py --log-level=debug
PYCHARM DEBUGGER
Another way to figure out how our code flows is through the Pycharm debugger. Pycharm provides a very effective technique to debug the process while it is running. Visit our blog post for more information on the Pycharm debugger. How to Use Pycharm to Debug Your Code
ODOO DEBUGGING USING PYTHON PDB PACKAGE
An interactive source code debugging tool for Python scripts is provided by the package pdb. It specifies the class pdb, which is easily identified by reading the source code and allows setting conditional breakpoints and single stepping at the source line level.
We can define two lines of code from our source code inside an action or a statement, import pdb and pdb.set trace(). The execution of the code will halt here once it gets to this point. Let me use the following screenshot as an example.
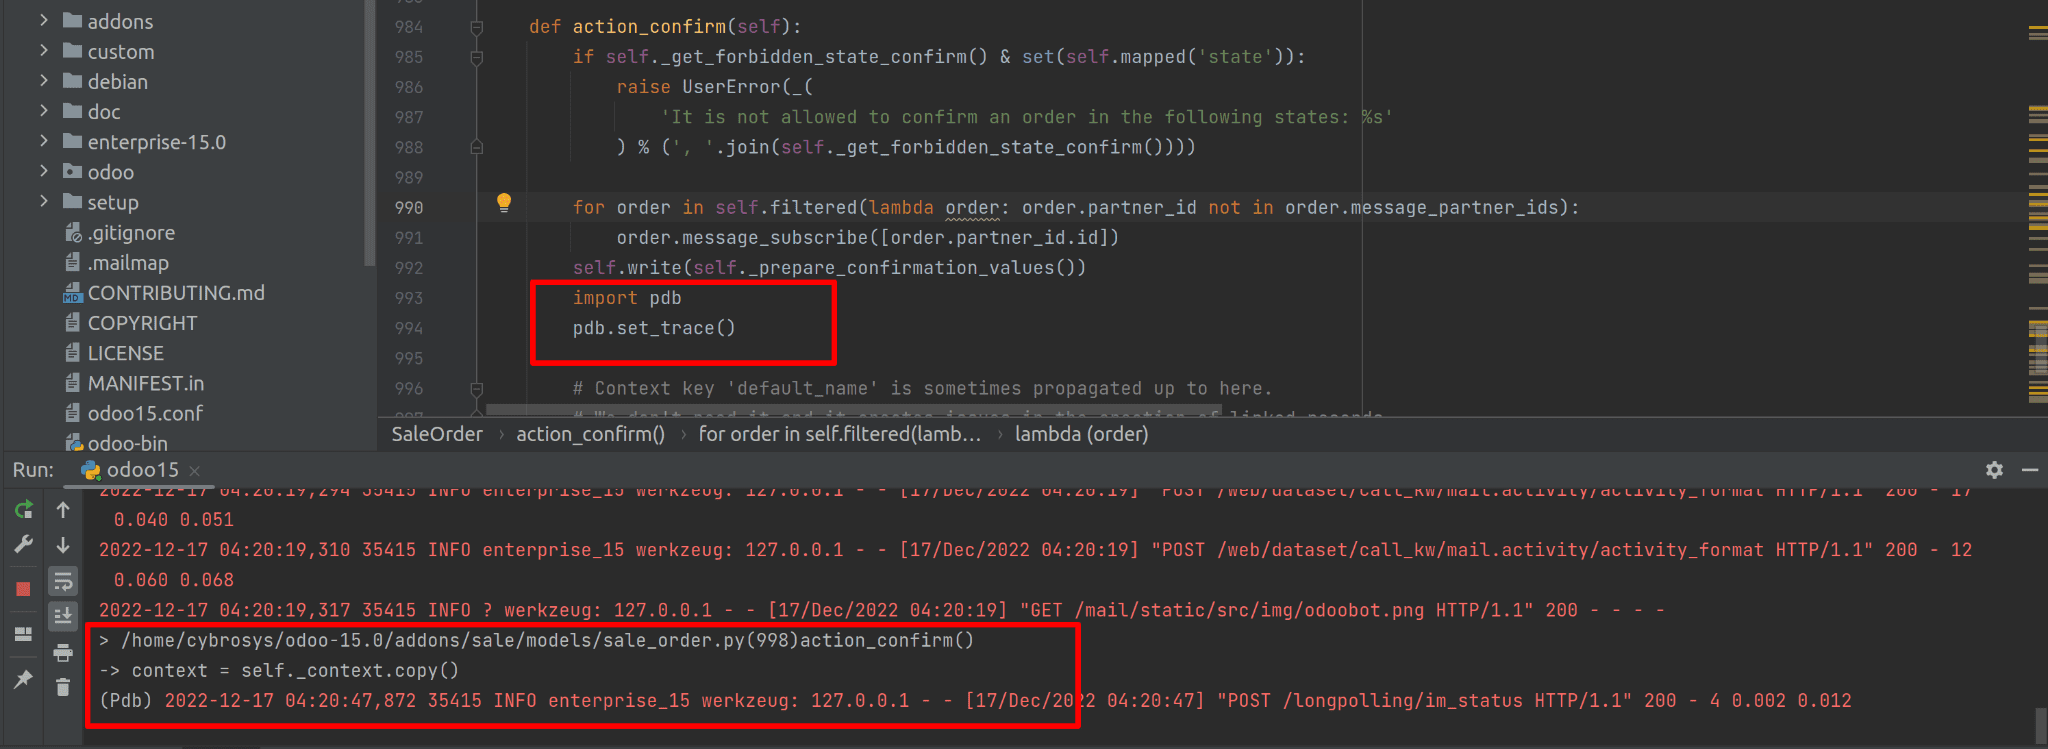
Let's access values or return the arguments of any active function.
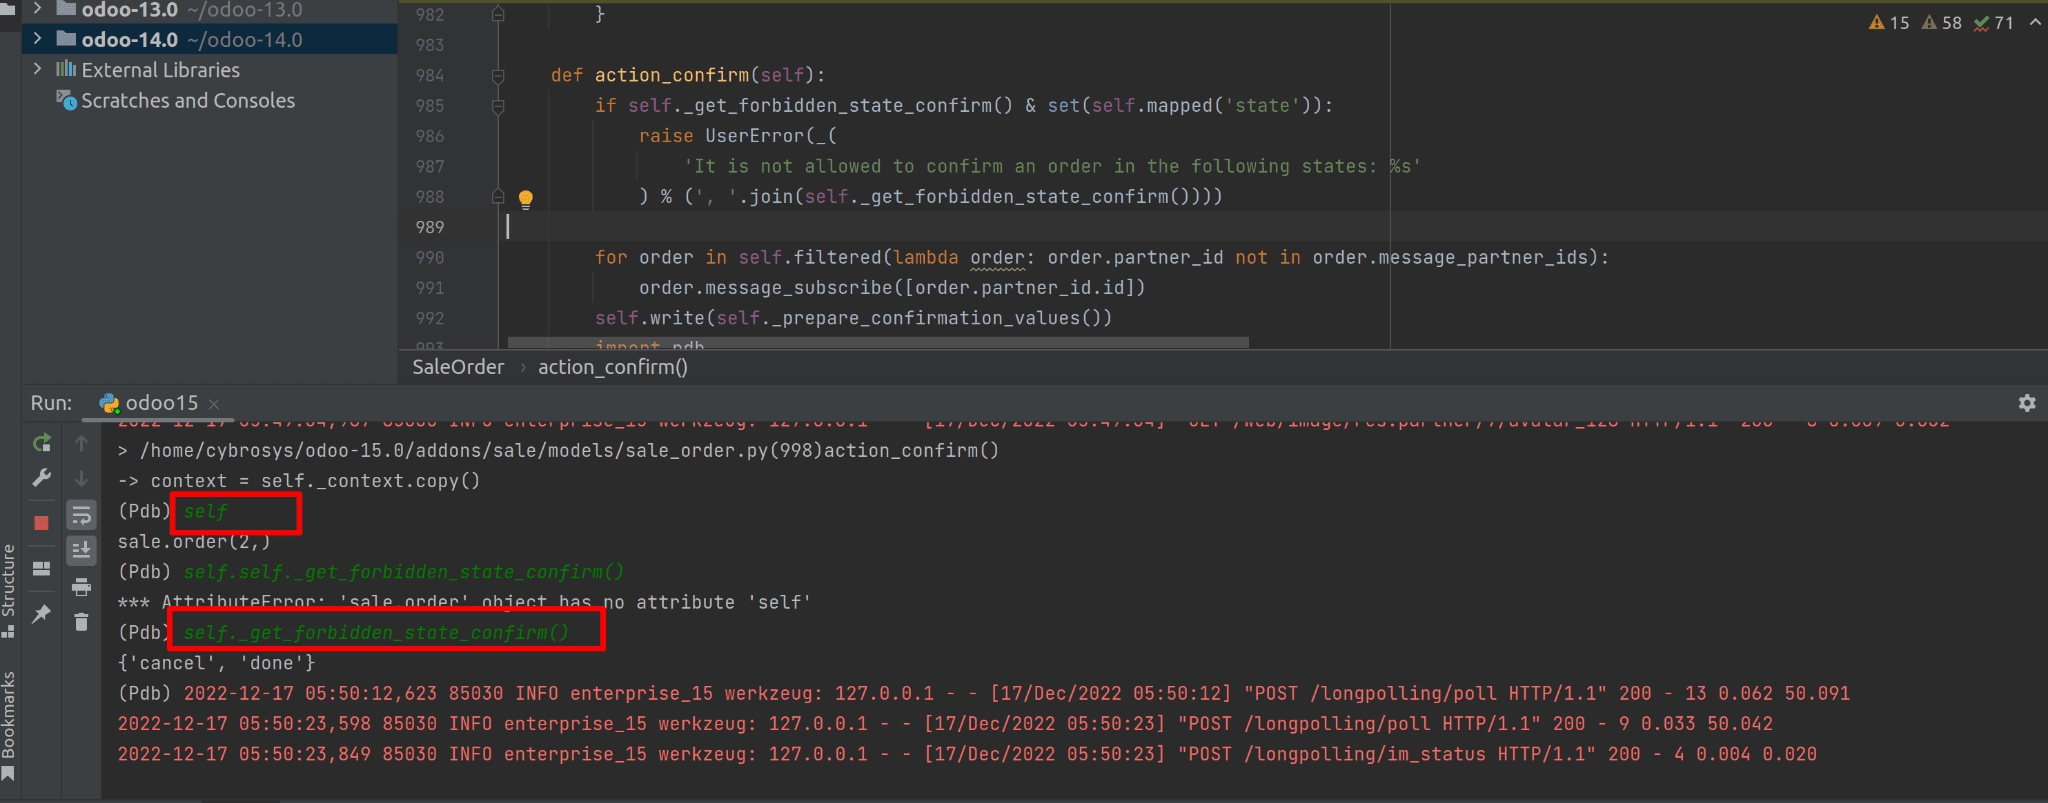
By identifying the self and returning a function, we may get the pertinent record ID and function return, just like in the sample. We'll use set trace() to hard-code a breakpoint at a certain place in our programme and for possessing the ability to debug simply put pdb.run(). Also pdb.runcall(function, *args, **kwds) is used, among other things, to call the function with the supplied arguments. The most widespread misperception among programmers is that the print() function in Python doubles as a debugger. Alternatively, printing() prints the value of the expression after evaluating it in the current context.