Odoo 18 offers a powerful suite of tools for businesses to manage their operations efficiently, and one of the most crucial aspects is financial management. Having the right financial reports at your fingertips can significantly impact decision-making and business strategy.
With Odoo 18, you can easily generate and customize financial reports directly from the user interface (UI), making it accessible even for non-technical users. Whether you need balance sheets, profit and loss statements, or cash flow reports, Odoo provides a flexible platform to tailor these reports to fit your specific business needs.
In this blog post, we'll guide you through the process of adding and customizing financial reports within the Odoo 18 UI, helping you make the most of your financial insights.
To get started with customizing financial reports in Odoo 18, you’ll first need to activate Developer Mode. This mode unlocks advanced features and allows you to access the full range of configuration options, including the ability to create and modify accounting reports.
How to Activate Developer Mode:
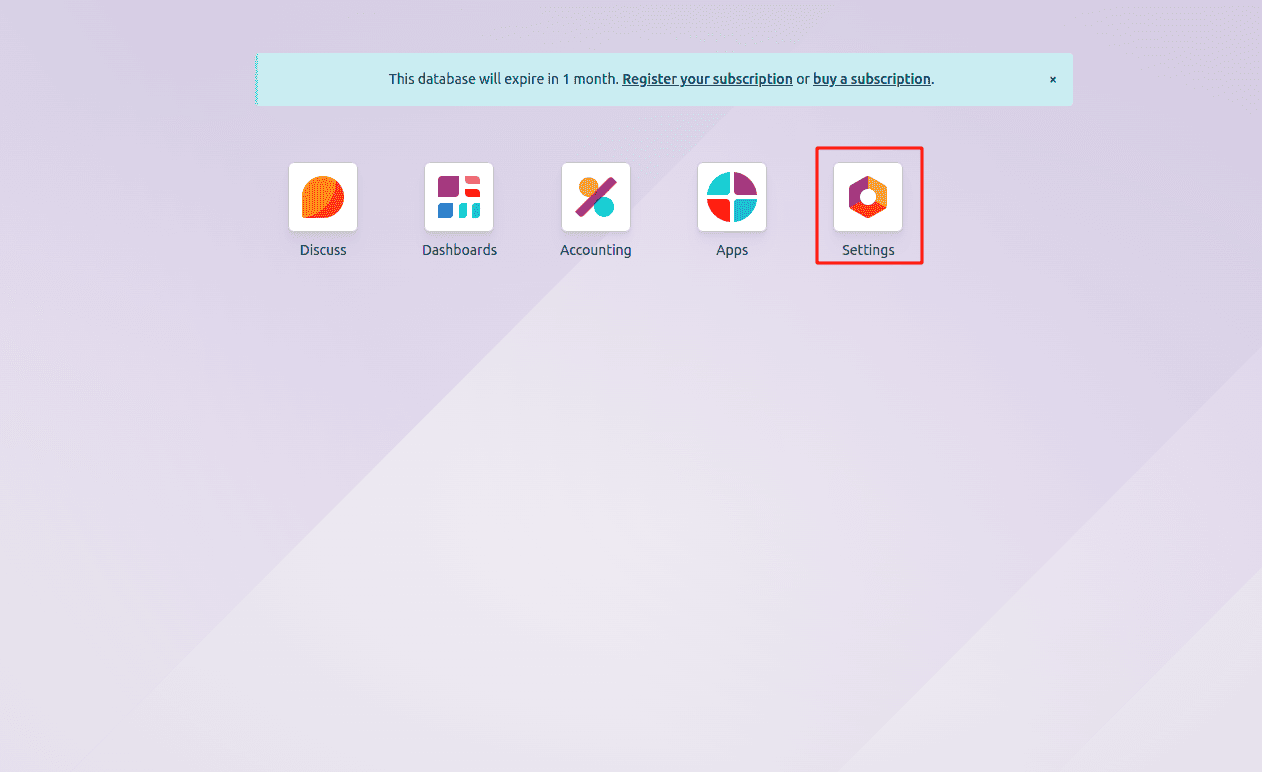
Navigate to Settings in the main menu.
Under General Settings, scroll down to find the Developer Tools section.
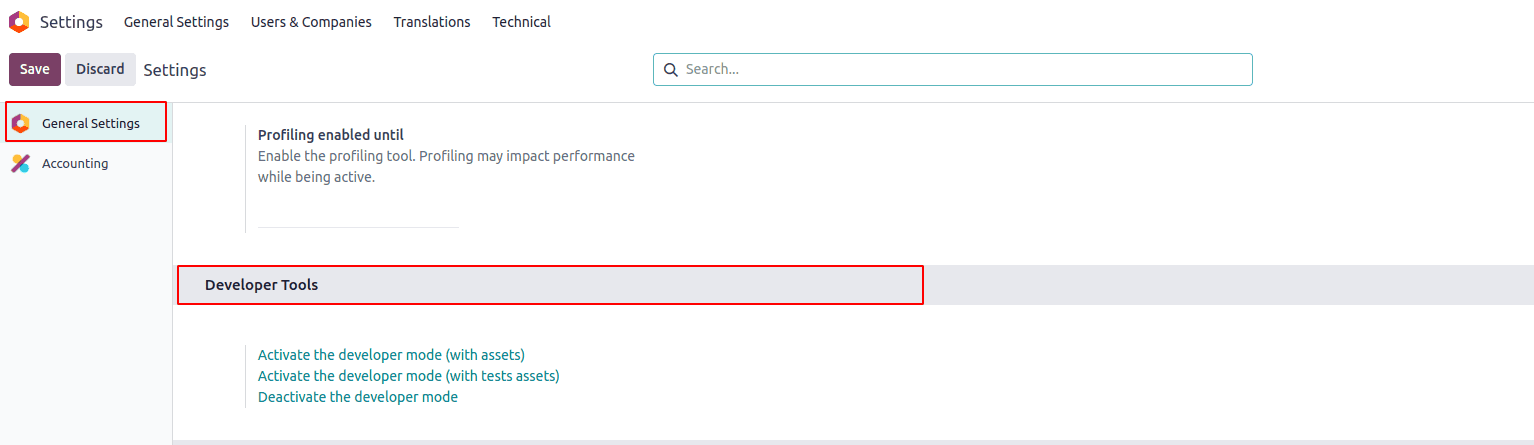
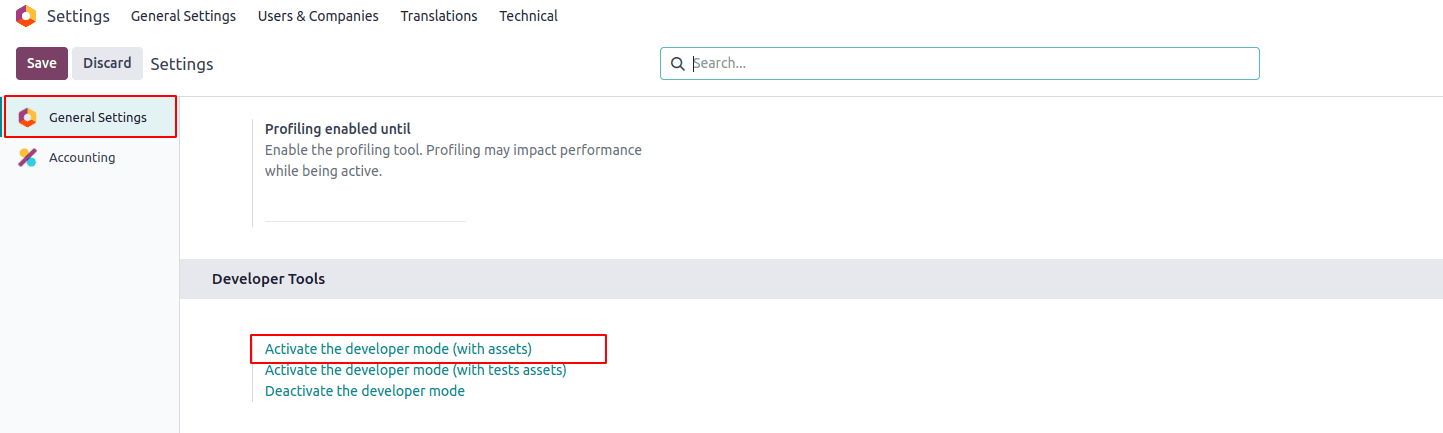
Click on Activate Developer Mode. This will enable you to access technical settings and advanced options across the platform.
Once Developer Mode is activated, you’ll be able to create and customize accounting reports more effectively. You’ll also notice new options in the UI, allowing you to make the most out of Odoo’s reporting capabilities.
After enabling Developer Mode, the next step is to access the interface where you can create and manage your financial reports.
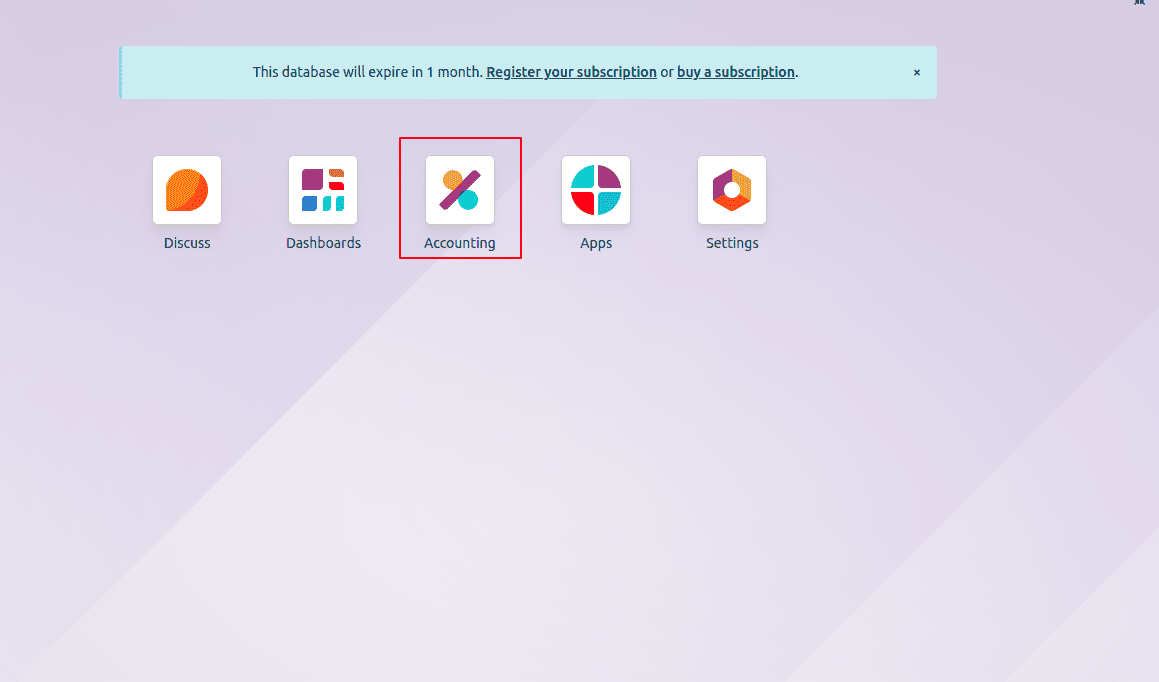
From the Odoo dashboard, navigate to the Accounting module.
Go to Configuration in the top menu, then select Management.
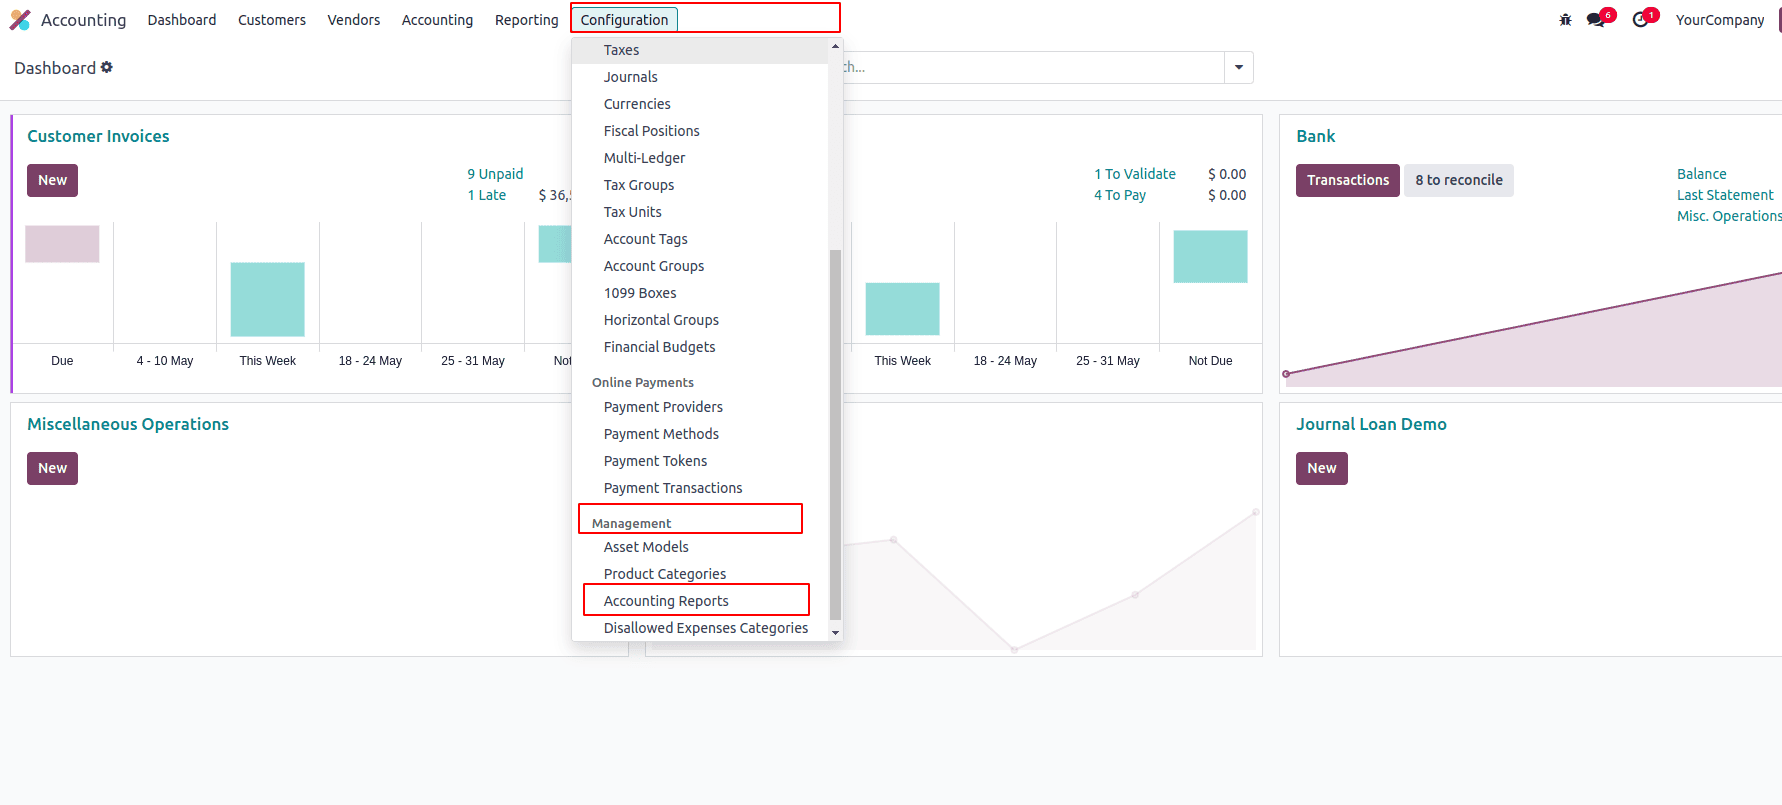
Under the Management section, click on Accounting Reports.
Here, you'll be presented with the list of existing reports, and from this interface, you can create new reports or modify existing ones. You can choose to create a Root Report, which is the primary structure for your financial report, or you can create a Variant to customize an existing report without affecting the root.
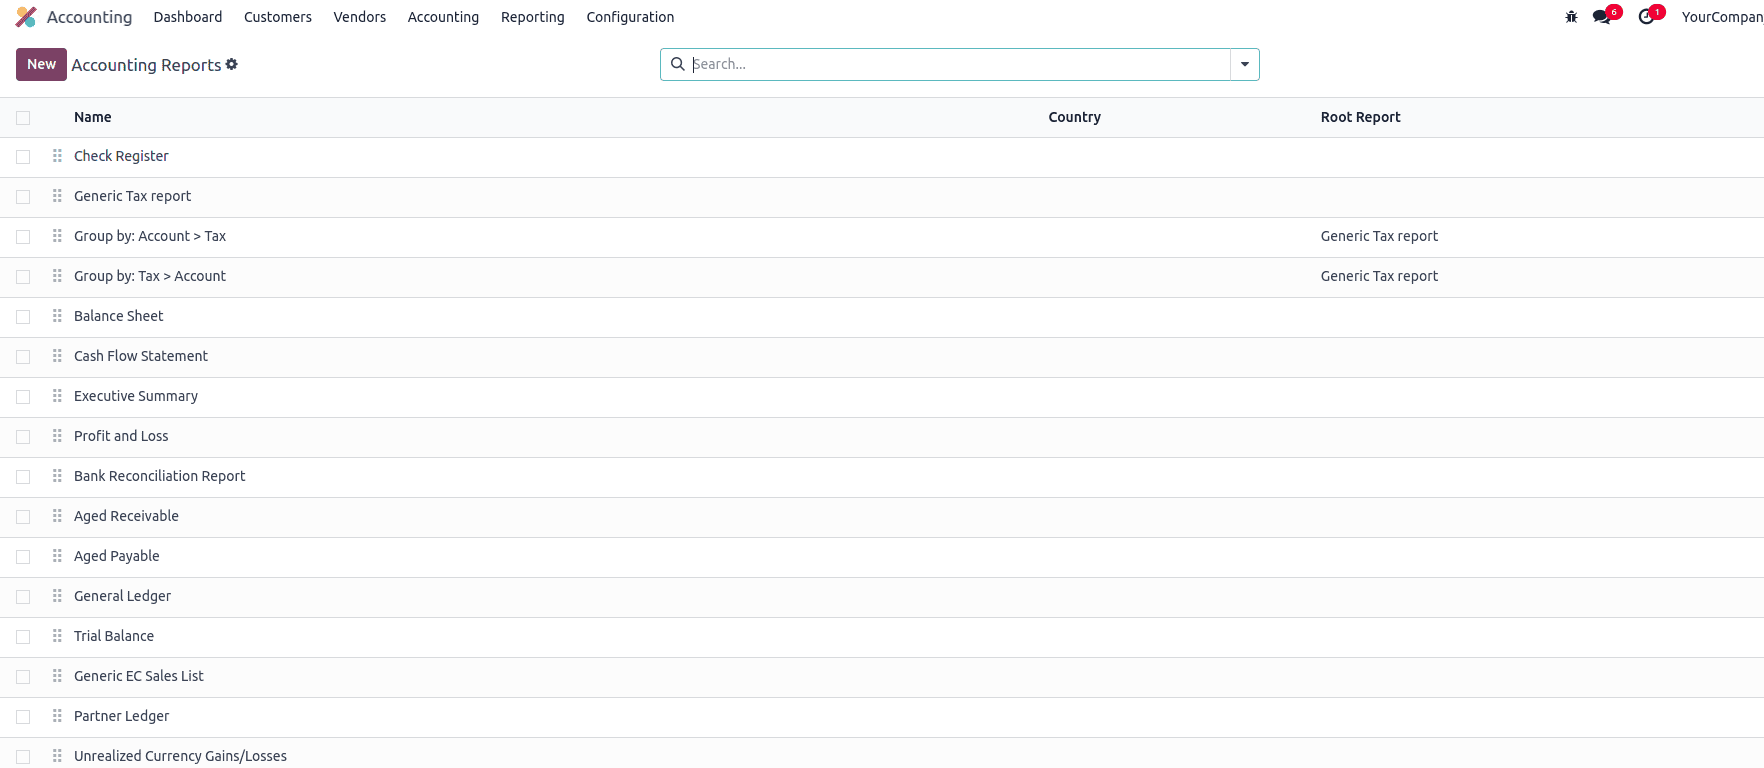
Root reports can be seen as general, template-like accounting reports. They act as models or blueprints for creating more specific reports.
If a report doesn't have a parent report, it's considered a Root Report itself. For example, the standard Balance Sheet or Profit and Loss reports are Root Reports. You can customize these templates or use them to create different versions for your needs.
Variants are country-specific or customized versions of a Root Report. They are always linked to a root and inherit its structure, making it easier to adapt financial reports to local accounting standards or specific business requirements.
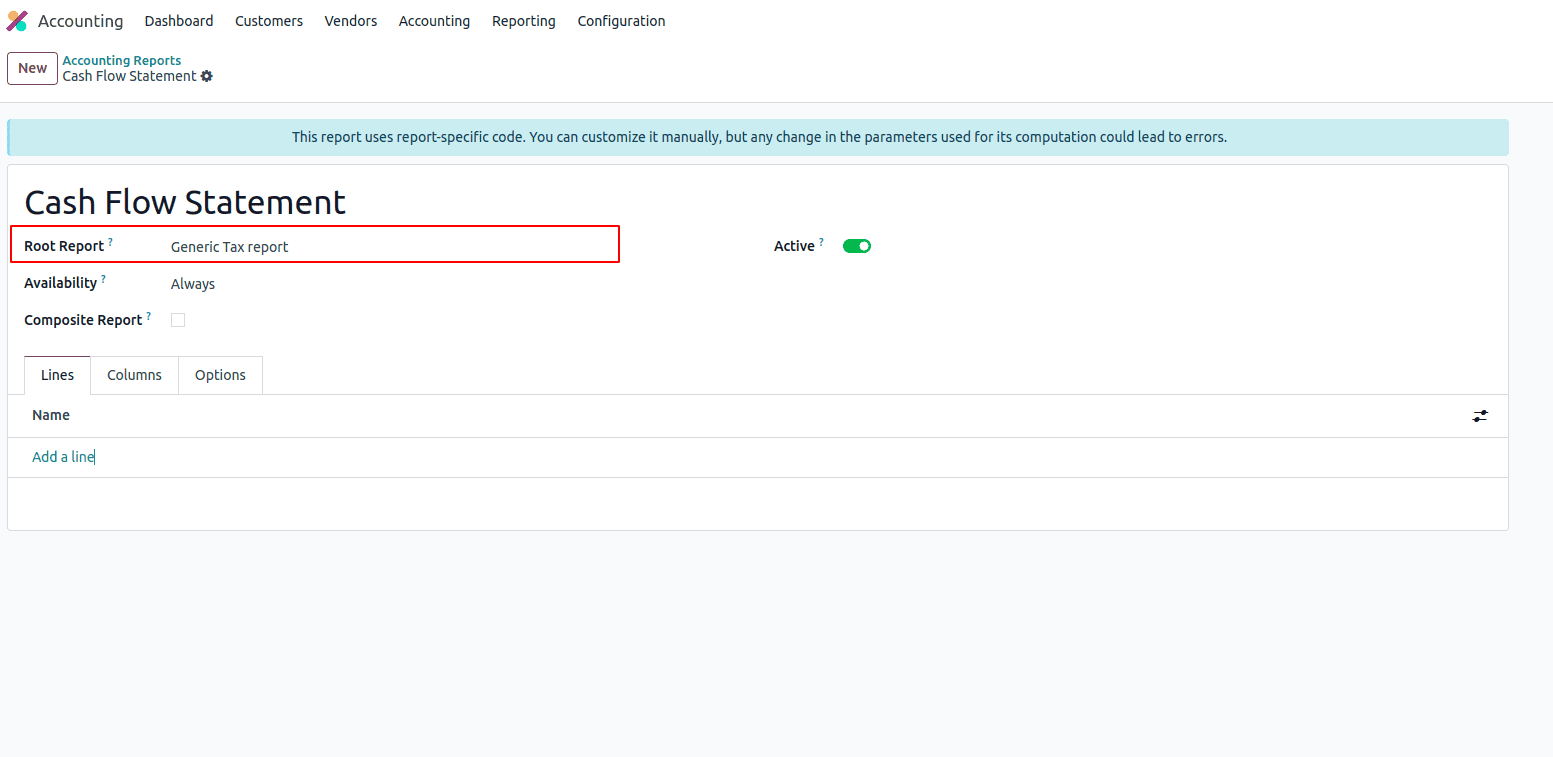
To create a variant, go to Accounting > Configuration > Management > Accounting Reports, then click Create. In the Root Report field, select the generic (root) report you want to base your variant on. Fill in the remaining details, such as the report name and output format, then save it. This report now becomes a variant of the selected root.
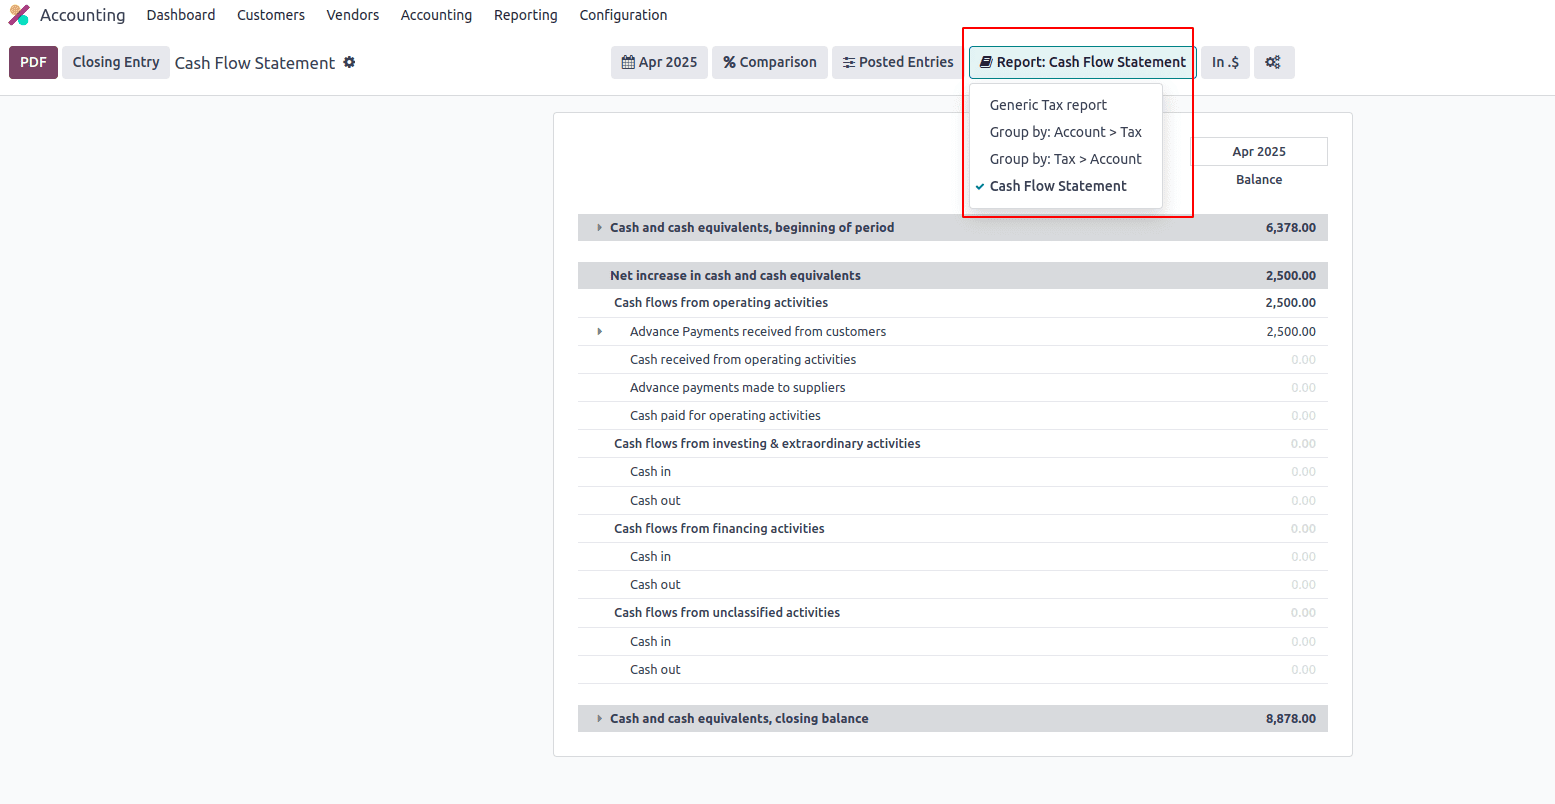
When a Root Report is opened from one of the accounting app’s main menus, all its linked variants appear in a variant selector located at the top-right corner of the view. This makes it easy to switch between different versions of the same base report.
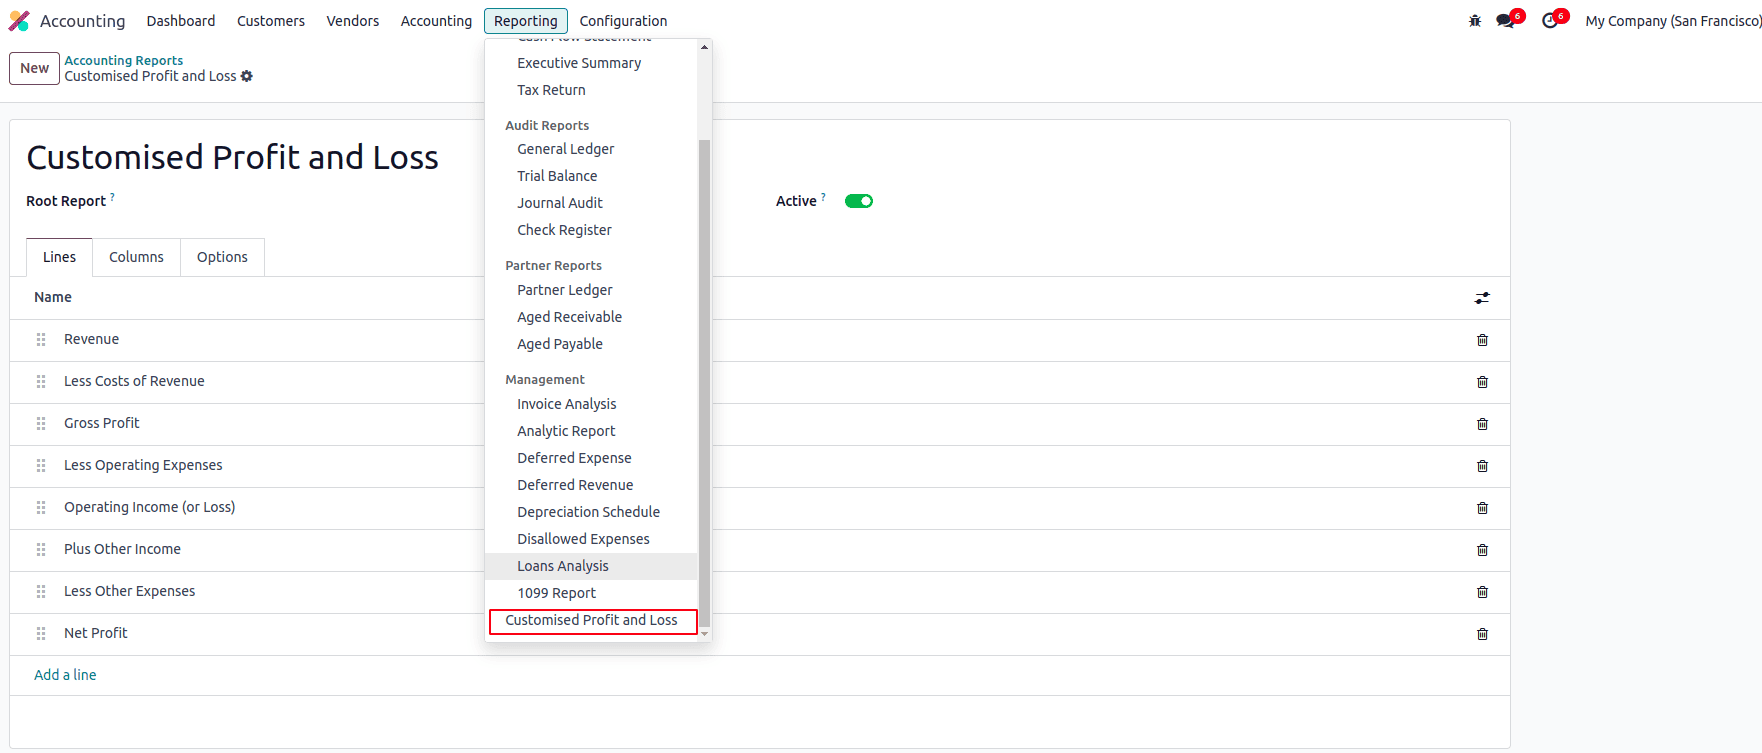
While creating a custom financial report, it won’t automatically appear in the main menus. To make it accessible from the UI, you need to manually add a menu item and link it to the report. Simply open the report, click on Action > Create Menu Item, and then refresh the page. The report will now appear under Accounting > Reporting.
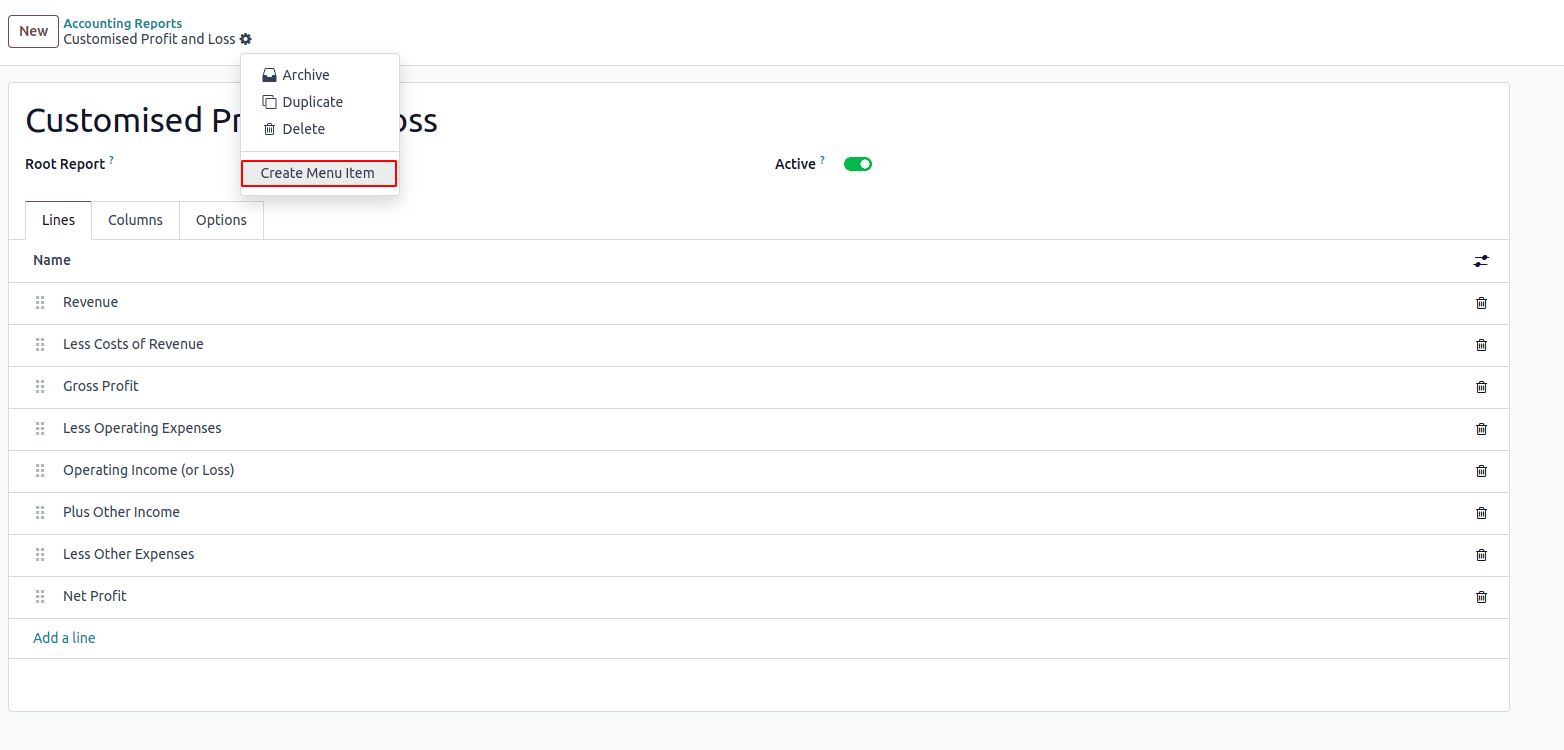
After clicking the button, a new menu item will be added under the Reporting section in the Accounting app.
Next, you’ll need to create or edit the lines that make up the structure of your report. Inside the Lines tab of the report, you can click the ‘Add a line’ button to start adding new lines. Each line represents a section, subtotal, or calculation that will appear in your final financial report.
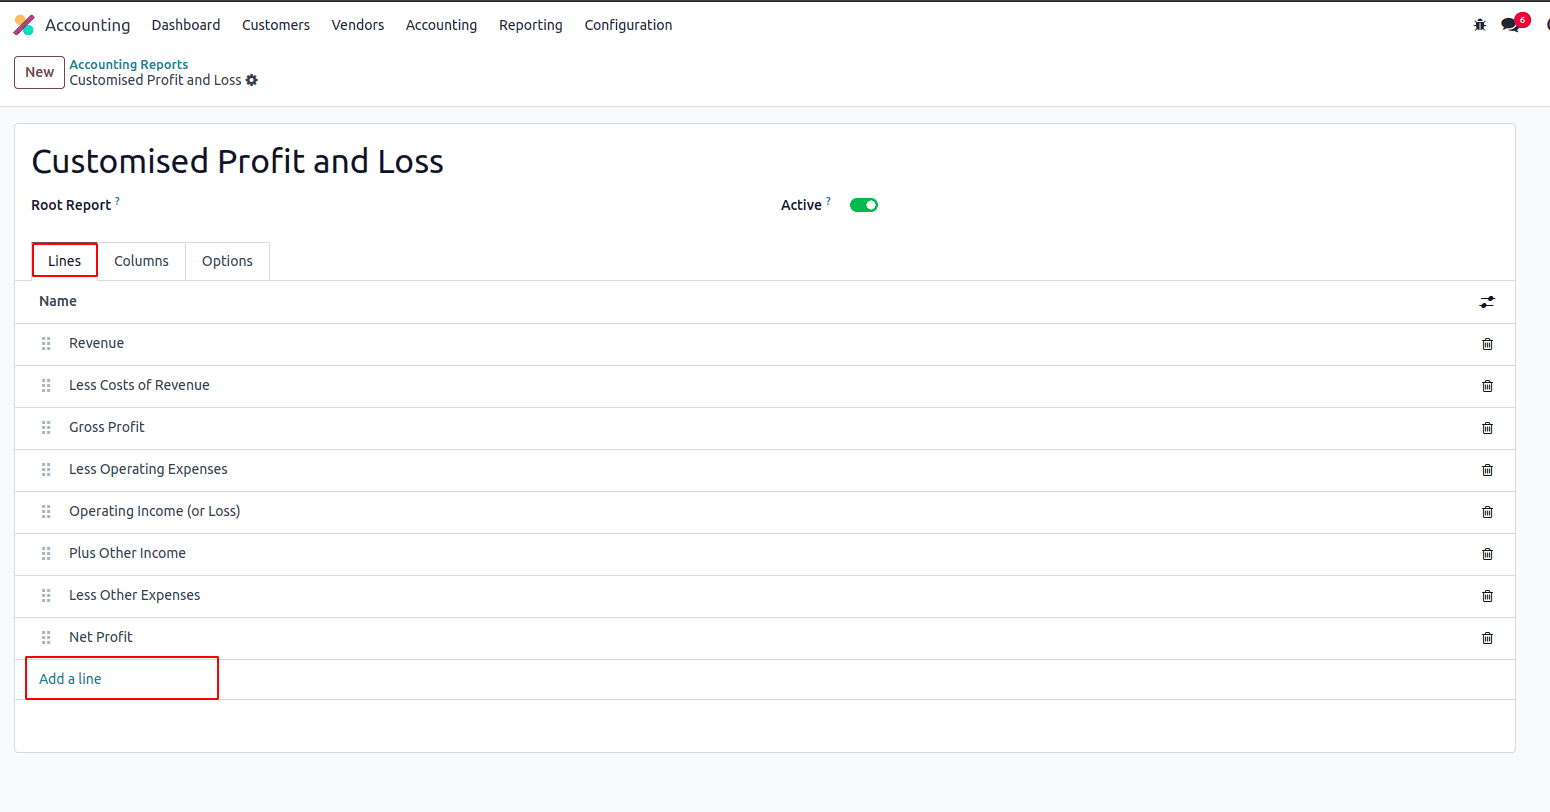
Each line requires a Name, which will be displayed in the report. You can also optionally provide a Code of your choice, which can be used later to reference that line in formulas or calculations within the report.
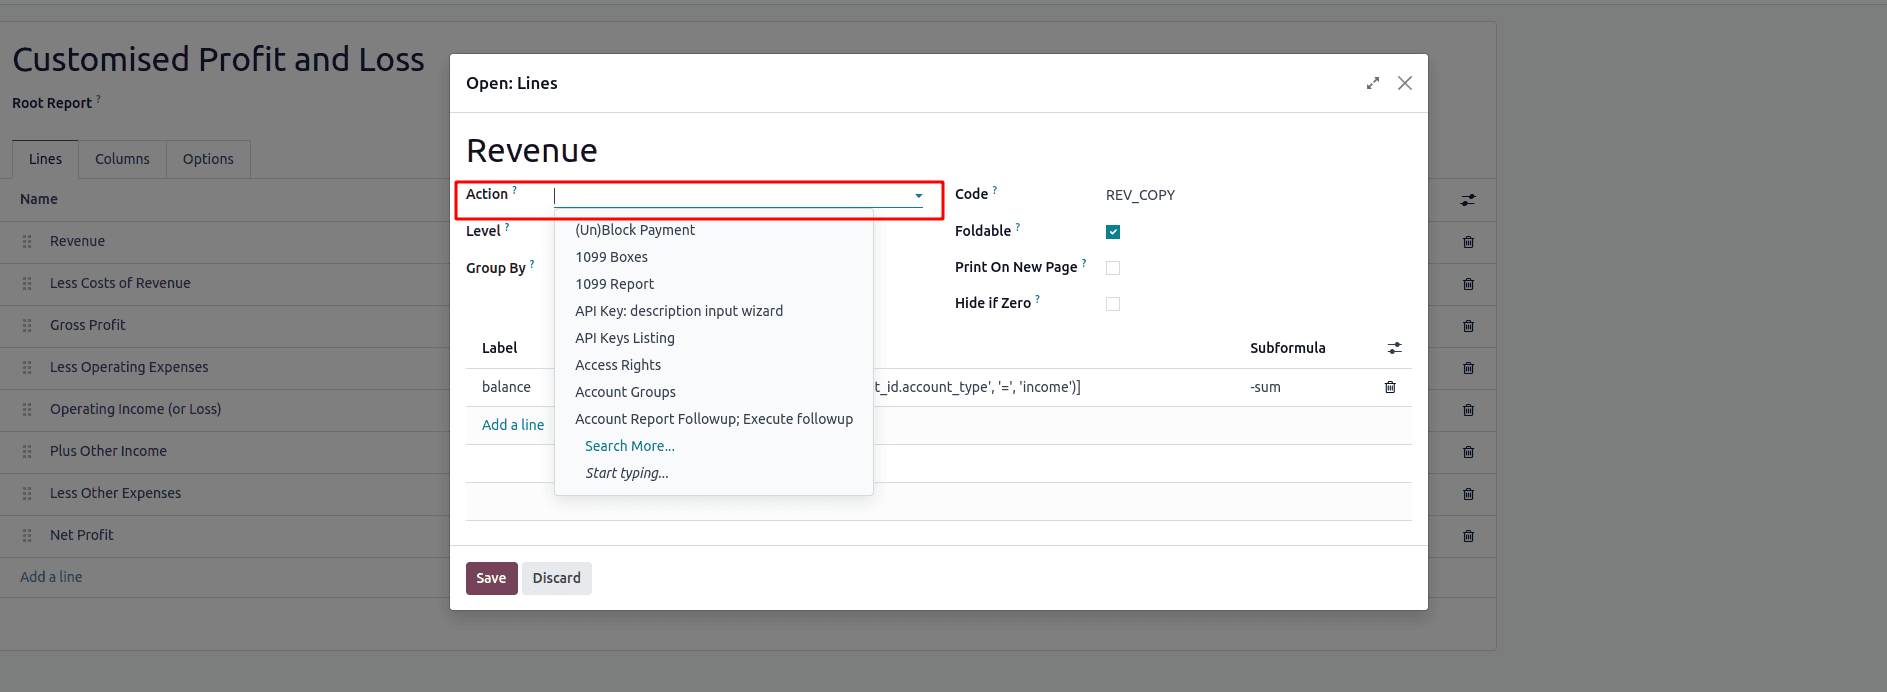
While creating a line, you also have the option to set an Action. If an action is defined, the line will appear as a clickable link in the report, and clicking it will execute the specified action.
After setting the action, the corresponding line will be displayed like a link, when clicking the link will redirect you to the specified action.
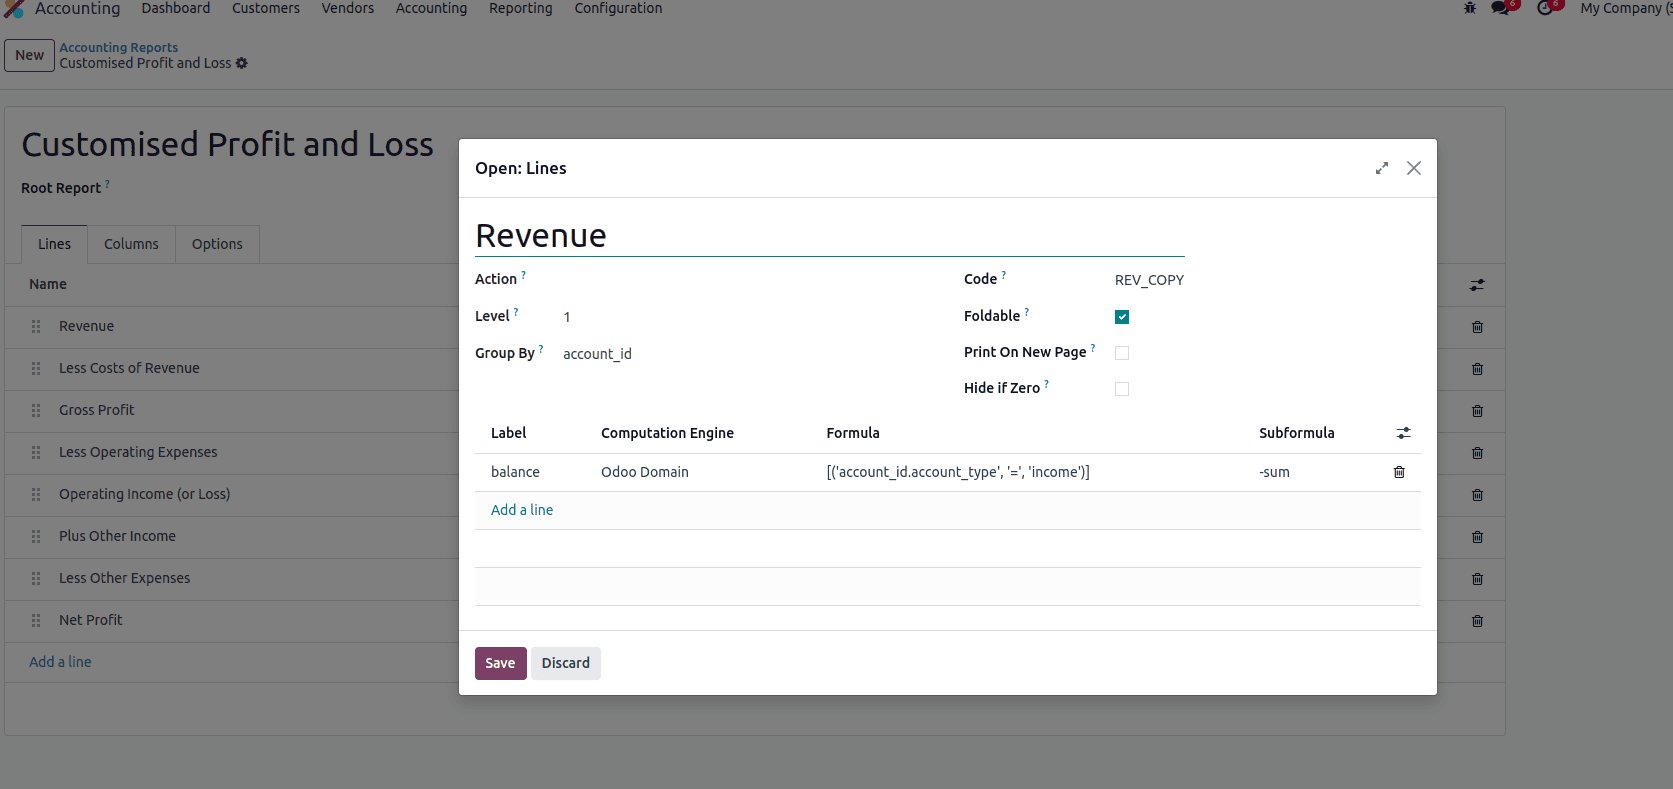
You can also set the Level for each line in the report. The level determines the hierarchical depth of the line, which affects both the indentation in the visual layout and the way totals and sections are grouped. For example, a line with Level 1 appears as a top-level section, while Level 2 or Level 3 lines are treated as subsections or nested items under it. This helps organize the report clearly and makes it easier for users to understand the structure at a glance.
Each report line also includes a Group by option, which allows you to dynamically group the data shown under that line. This is useful when you want to break down figures by specific dimensions such as account, partner, analytic account, or tags. When a group is selected, the report will automatically display separate rows for each value within that group, making it easier to analyze detailed financial breakdowns directly within the report.
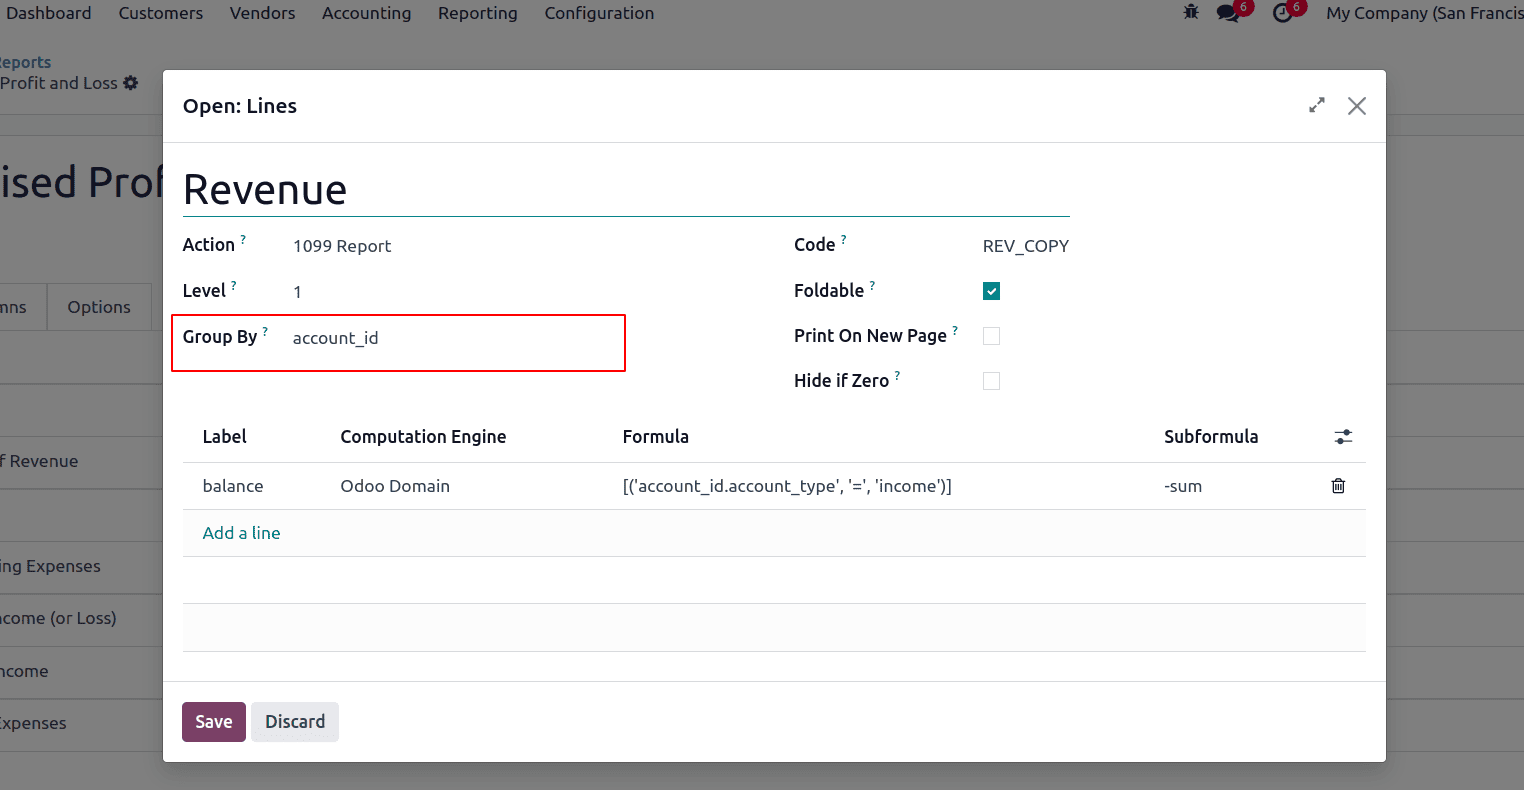
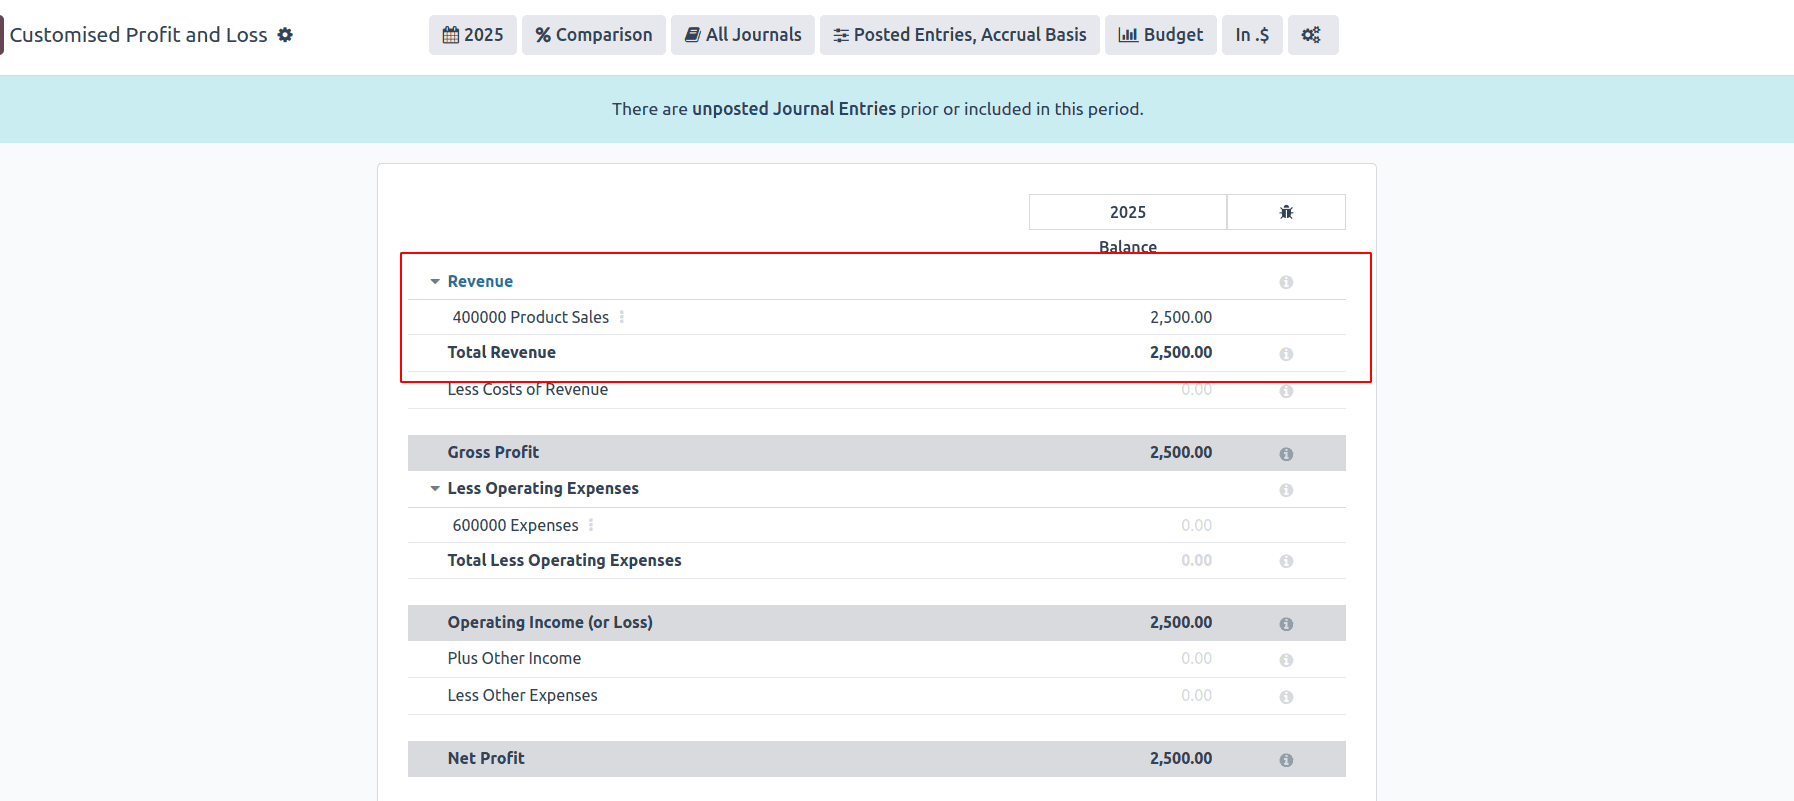
If you set the Group by option to account_id, the report line will display a separate entry for each individual account included in that line. This allows you to see a detailed breakdown of balances by account directly within the report, making it easier to analyze where values are coming from.
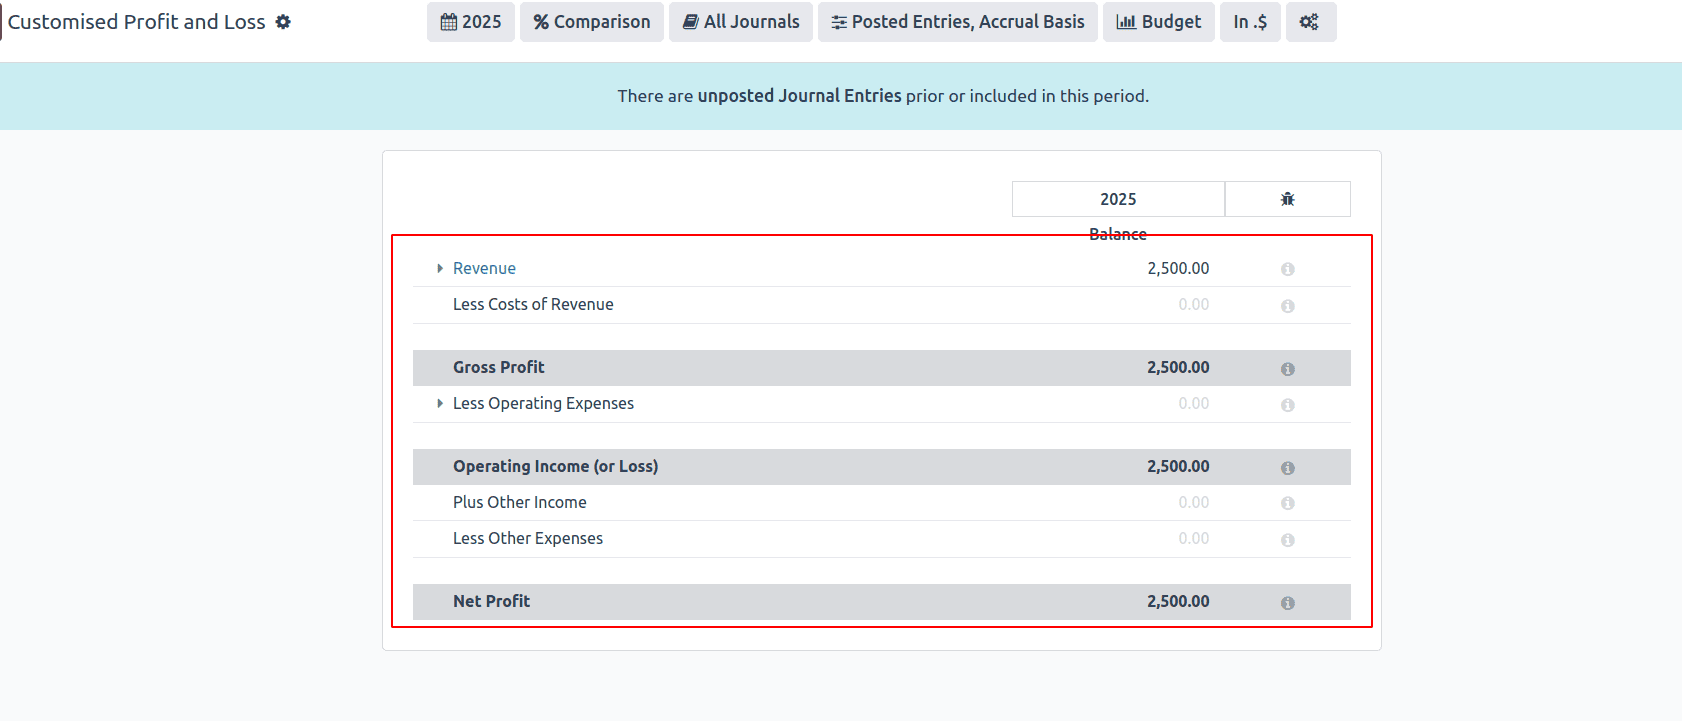
The Foldable option lets you collapse or expand a report line. When it's enabled, users can click to hide or show the lines underneath it. This helps keep the report clean and easy to read, especially when there are many details.
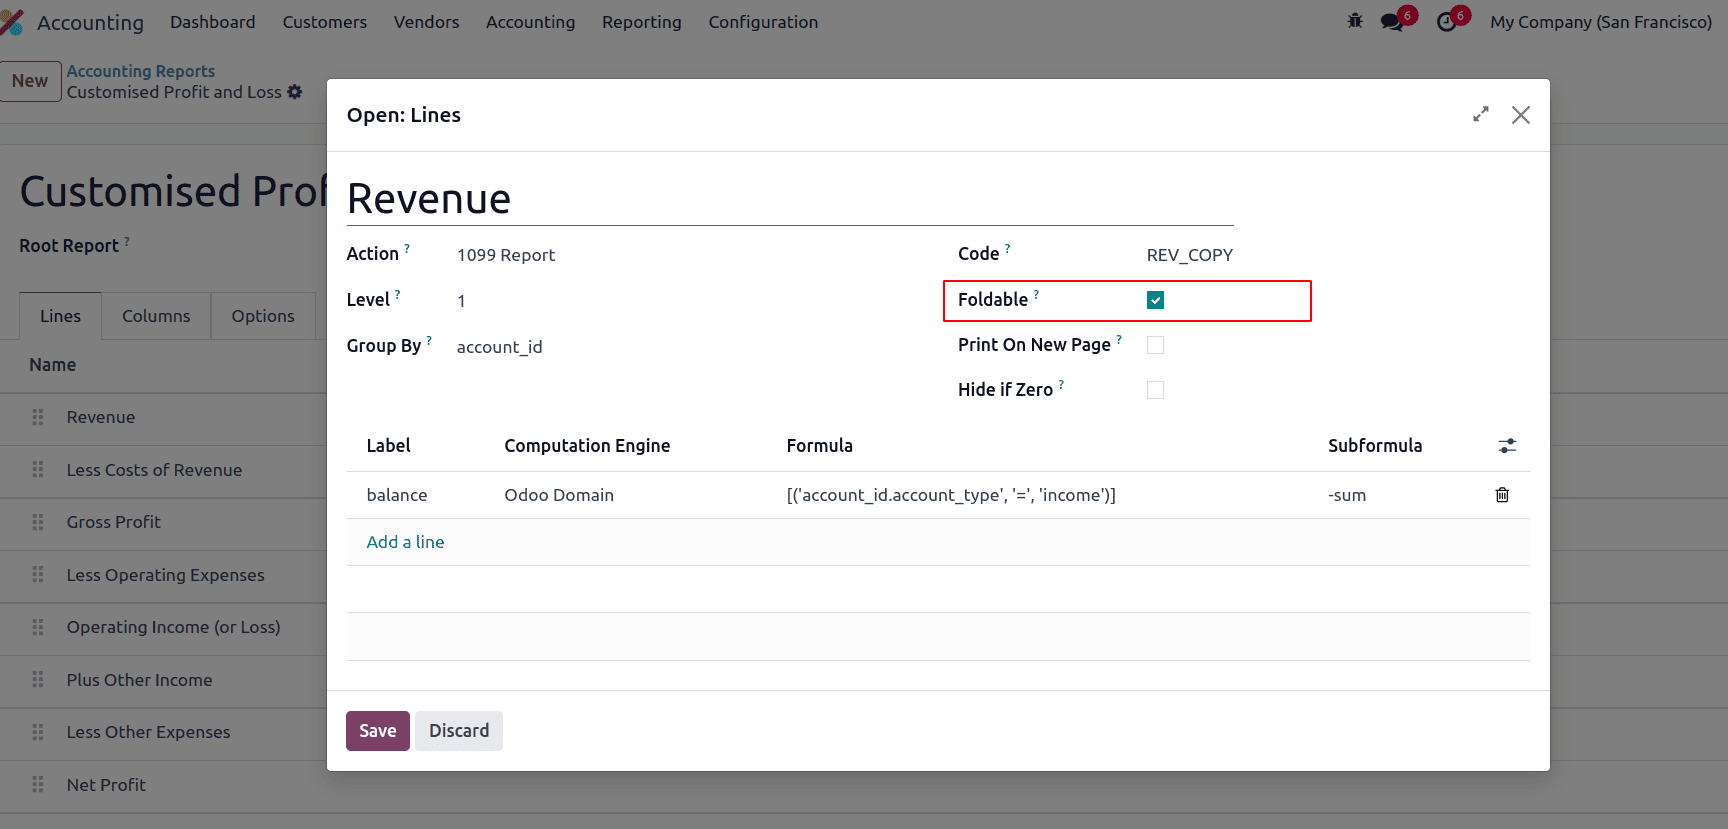
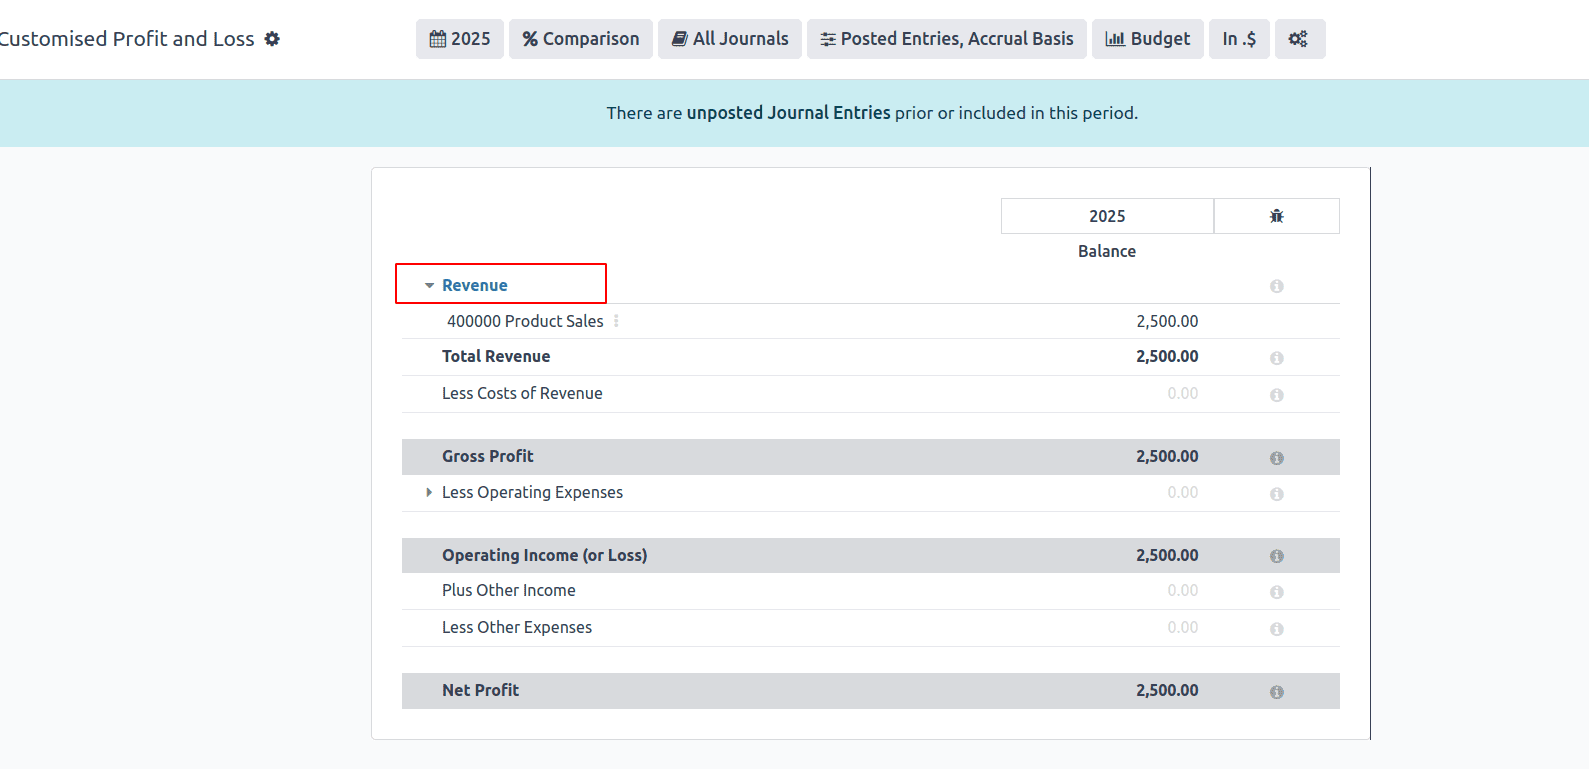
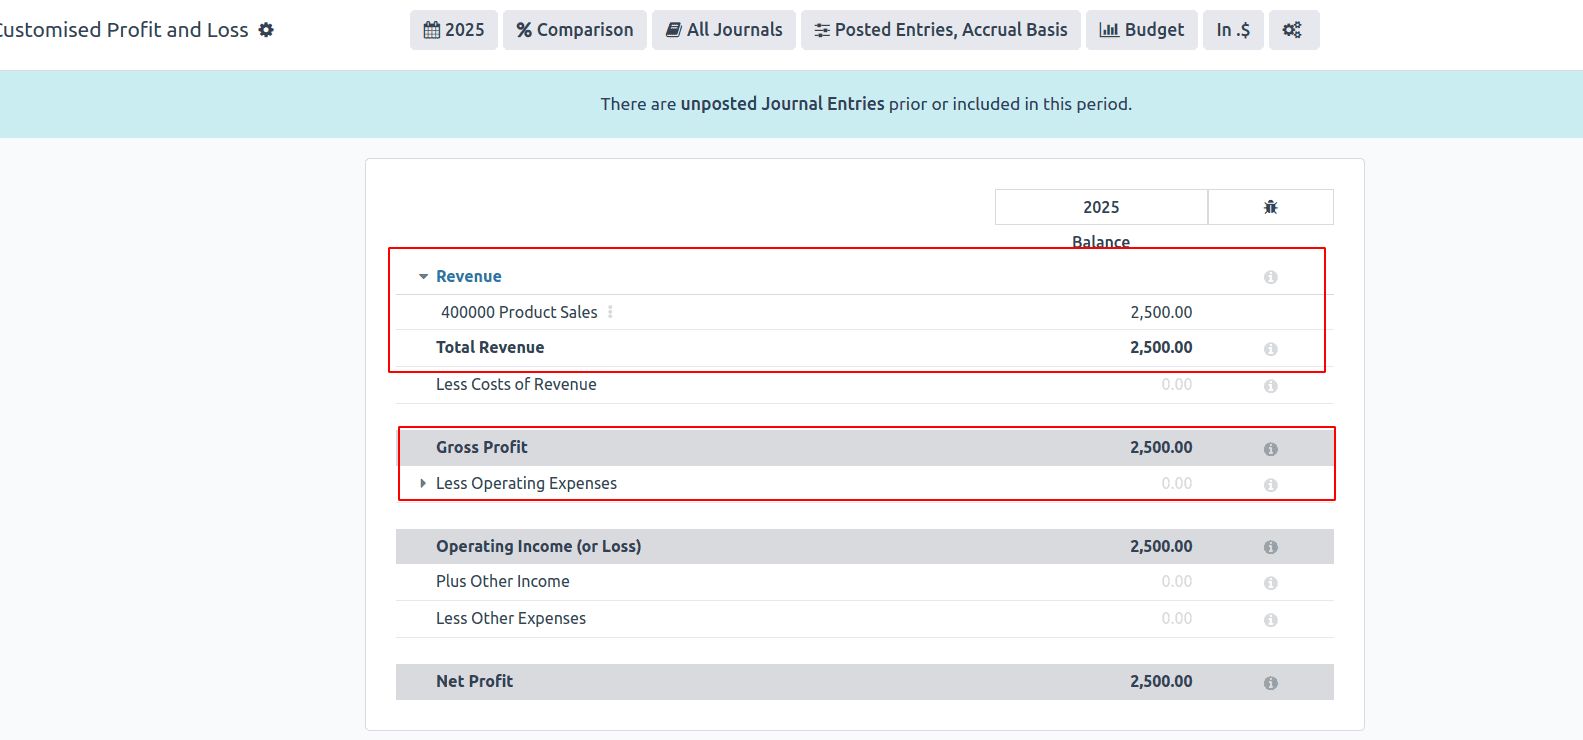
When the Foldable option is enabled, the line will appear with an expand/collapse arrow in the report, allowing users to show or hide the detailed lines grouped under it.
The Print on New Page option allows you to start that specific line on a new page when the report is printed or exported as PDF. This is useful for separating major sections.
The Hide if Zero option allows you to automatically hide a line from the report if its value is zero. This helps keep the report clean and focused by removing unnecessary lines that don’t contribute any financial value.
You can define expressions for lines in the report to perform calculations or show specific data based on certain conditions. For example, you can set an expression to sum the values of multiple accounts or calculate a percentage of a total. Expressions allow for dynamic and flexible reports by using formulas, such as simple math or conditional statements, to display calculated results instead of static values. This makes the report more adaptable to different financial needs.
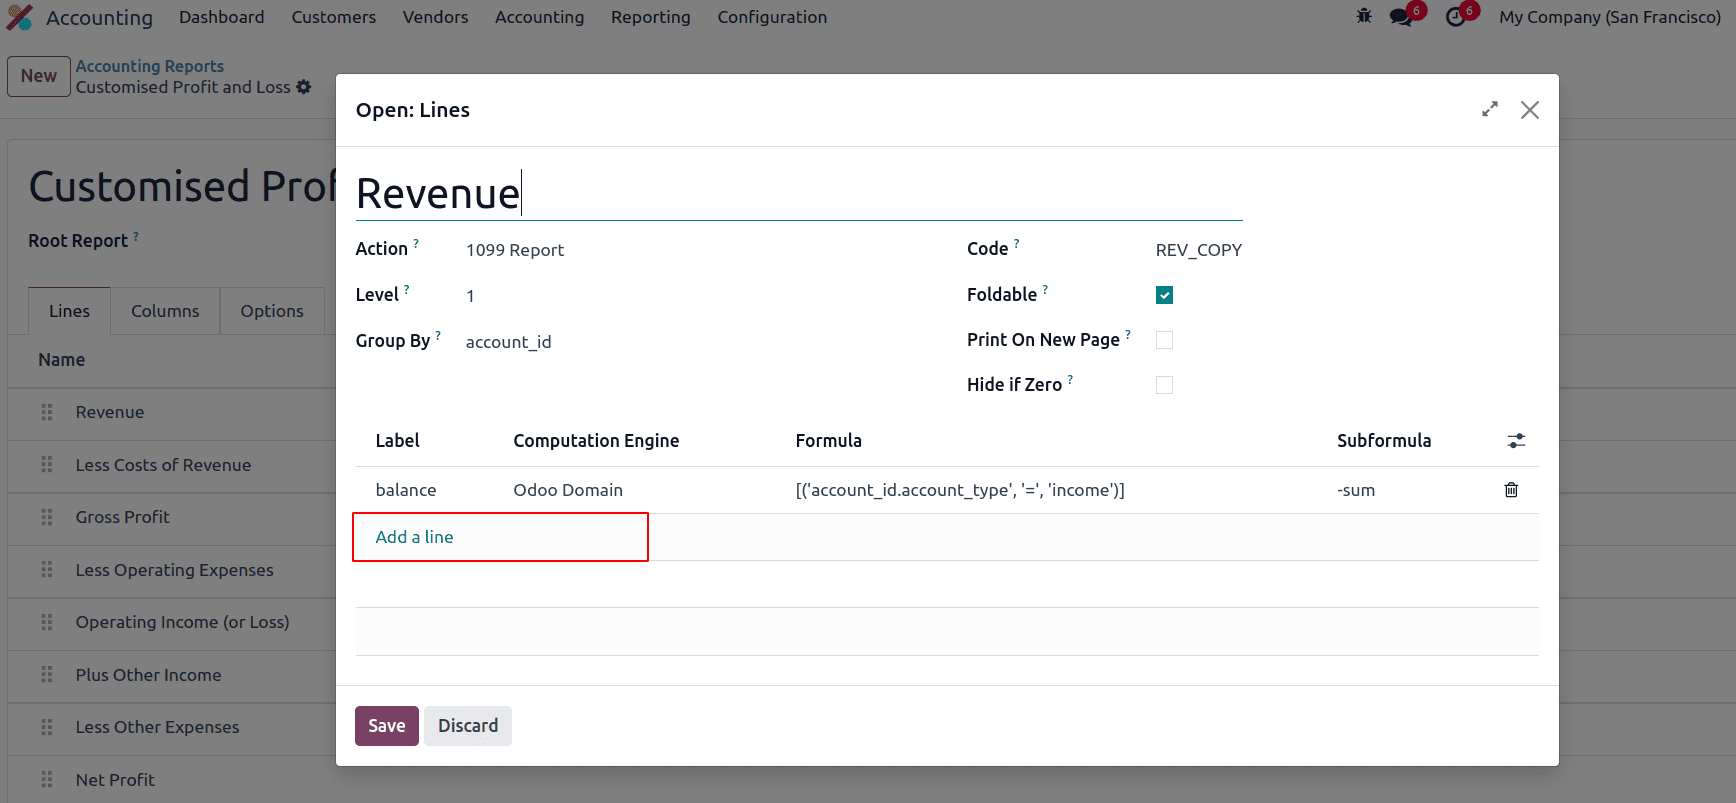
Each report line can contain one or more expressions, which act like sub-variables used to calculate the line’s final value. To add an expression, open the report line and click ‘Add a line’ within the Expressions section. These expressions define how the value of the line is computed.
When creating an expression, you need to assign a Label, which must be unique within that line, as it’s used to reference the expression. You also have to specify a Computation Engine and a Formula. The computation engine determines how the formula is interpreted—for example, whether it's based on Python-like logic or account-based rules. You can even mix expressions with different computation engines within the same line if needed, offering flexibility for complex calculations.
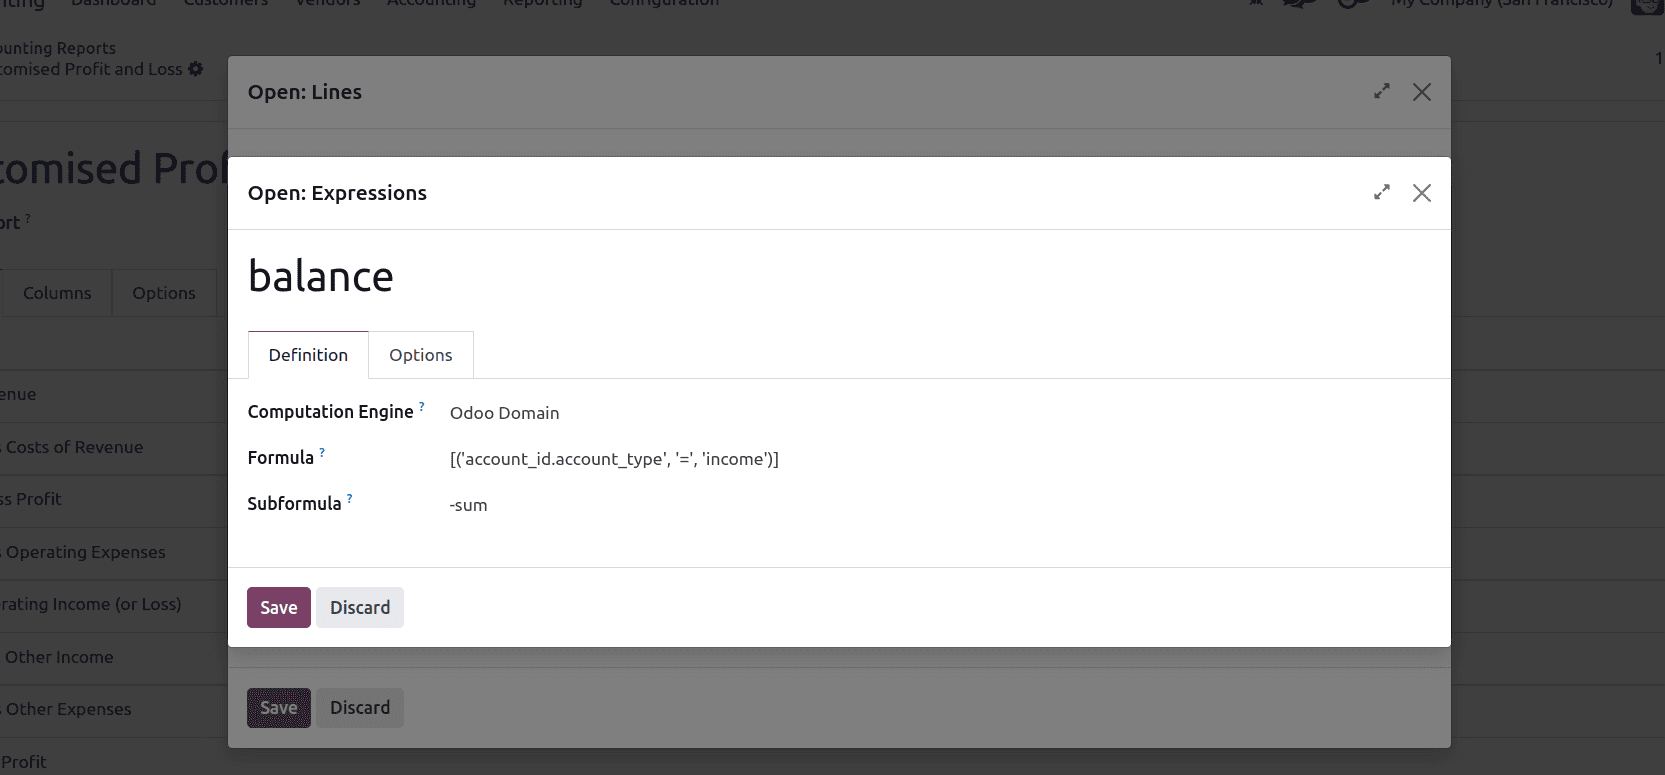
The Odoo Domain engine lets you define expressions using standard Odoo domain syntax. When this engine is selected, the formula is treated as a domain that filters account.move.line records. Odoo uses the filtered results to calculate the line’s value by summing the balances of the matching journal entries. This approach is useful for pulling specific financial data based on conditions like account, journal, date, partner, or tags. It offers a flexible and familiar way to define what data should be included in each report line.
The Subformula defines how the matched move lines from the domain are used to calculate the value of the expression. You can choose from several predefined operations:
* sum: Adds up the balances of all the move lines that meet the domain criteria.
* sum_if_pos: Adds only the positive balances from the matched move lines. Negative values are ignored and treated as zero.
* sum_if_neg: Adds only the negative balances. Any positive values are excluded from the calculation.
* count_rows: Counts the number of resulting lines. If the parent line has a group-by setting, it returns the number of unique group values. If not, it simply counts all matched move lines.
Additionally, placing a minus sign (-) before the subformula (for example, -sum) will invert the sign of the result, which is helpful when you need to display values like credits or liabilities as negative numbers.
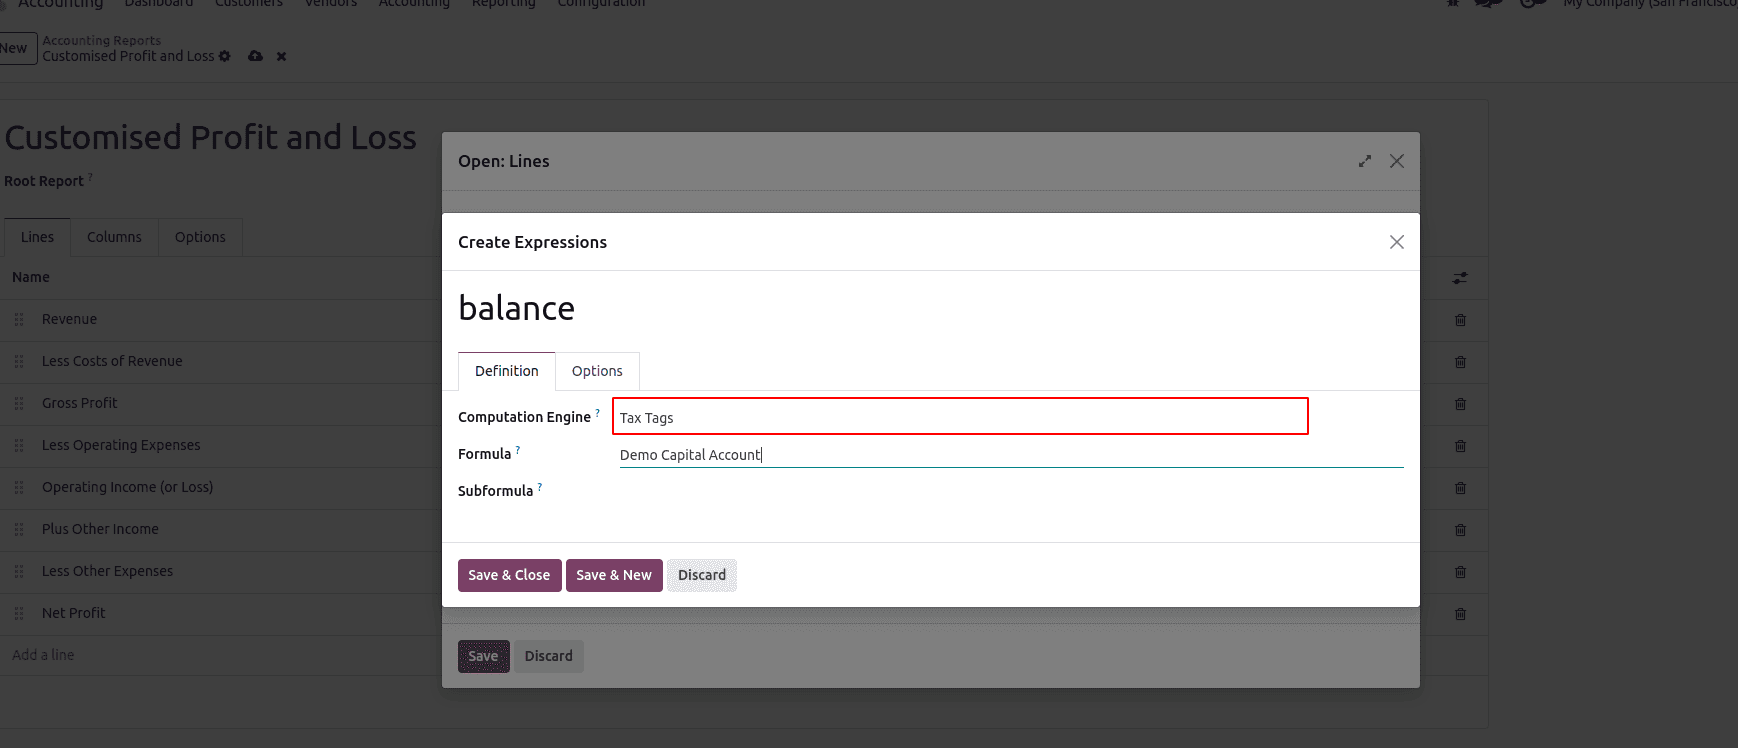
A formula using the Tax Tags engine consists of a name that matches specific tax tags. If the tax tags don’t exist when creating the expression, Odoo will automatically create them.
The Aggregate Other Formulas engine is used to combine the results of other expressions within the same report line. Instead of pulling data directly from move lines or tax tags, this engine lets you reference other expression labels and perform calculations with them. This engine is helpful when you want to reuse values from multiple expressions and apply custom formulas to get final results.
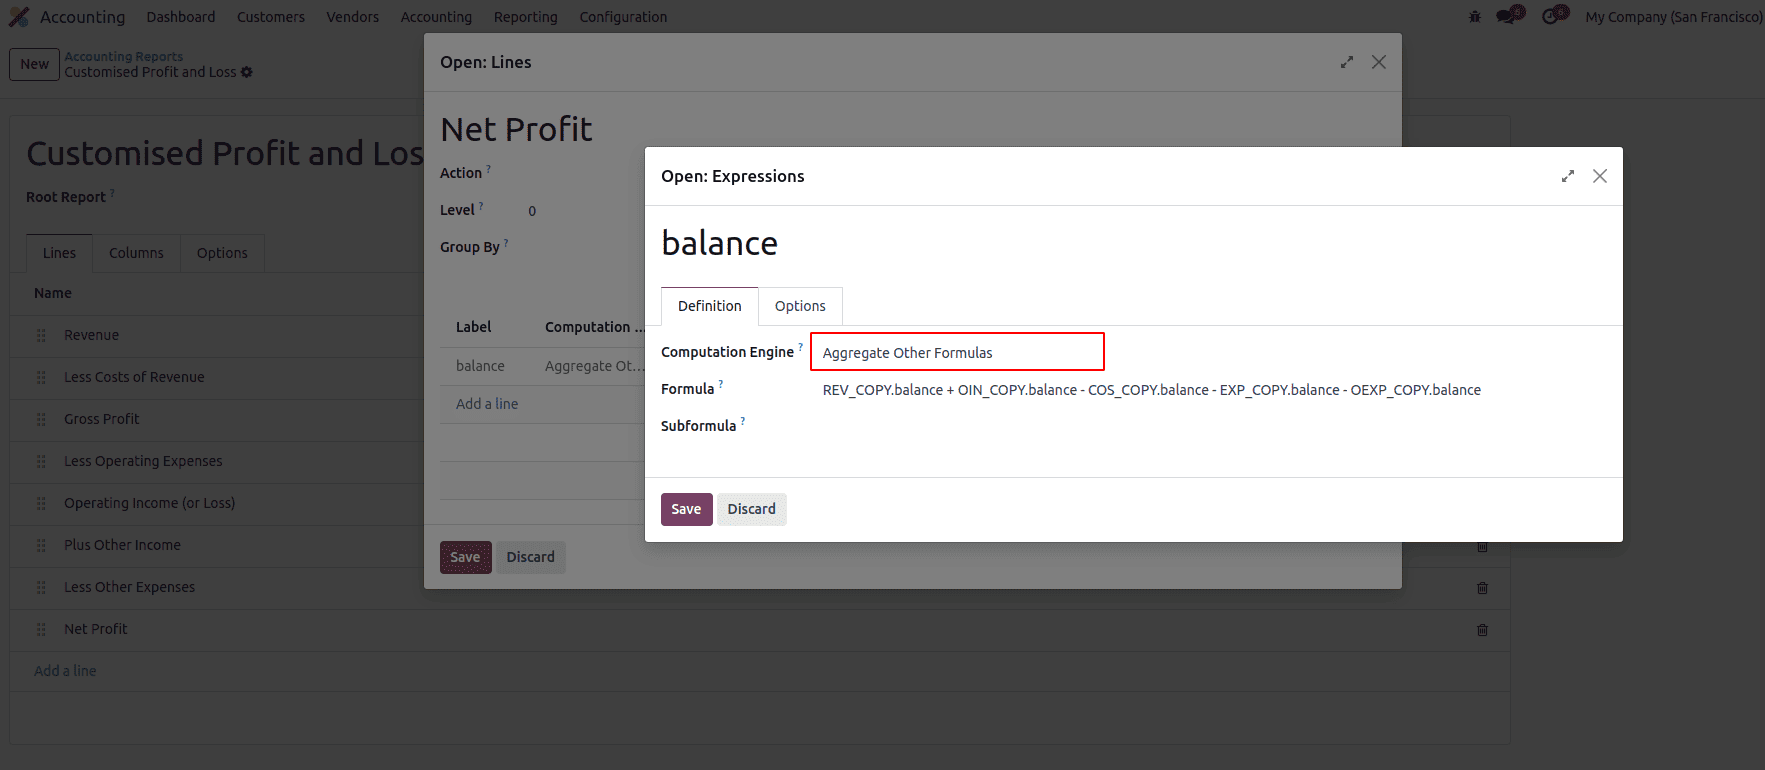
Use the Aggregate Other Formulas engine when you want to do calculations using the results of other expressions. You can add, subtract, multiply, or divide values from other expressions using simple math symbols like +, -, *, and /.
To reference another expression, use the format:
line_code.expression_label
For example: profit.income
You can also add conditions to control when a value should be shown. Here are some common subformulas:
* if_above(CUR(amount))
Shows the result only if it’s greater than the given amount. Otherwise, it shows 0.
* if_below(CUR(amount))
Shows the result only if it’s less than the given amount. Otherwise, it shows 0.
* if_between(CUR1(amount1), CUR2(amount2))
Shows the result only if it’s between the two amounts. If not, it will show the closest limit.
* if_other_expr_above(line_code.label, CUR(amount))
Shows the result only if another expression's value is above the given amount.
* if_other_expr_below(line_code.label, CUR(amount))
Shows the result only if another expression's value is below the given amount.
CUR is the currency code (like USD, EUR), and the amount is written in that currency.
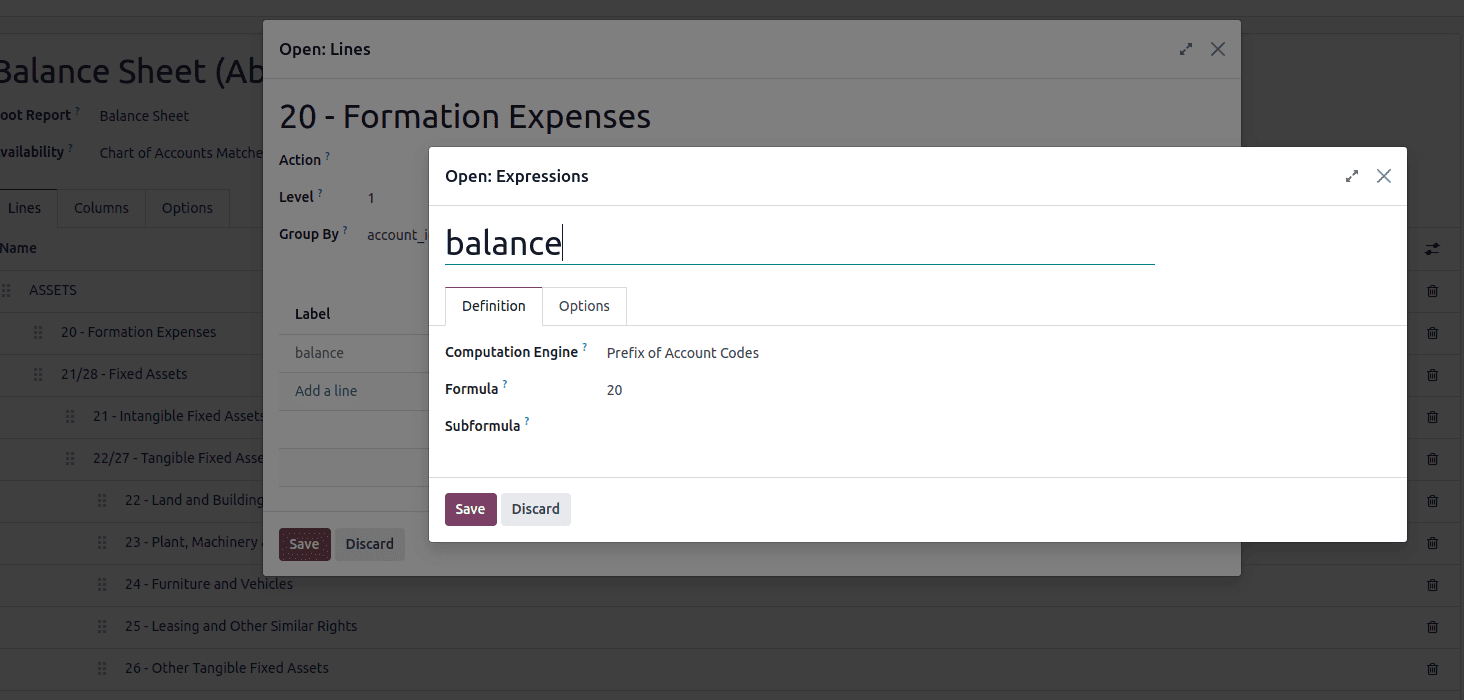
The Prefix of Account Codes engine is used to include or group accounts based on the beginning of their account codes. In this engine, the formula is just the starting digits (prefix) of the account codes you want to target.
For example, if you enter 4, it will include all accounts with codes starting with 4 (like 4000, 4010, etc.). You can also use multiple prefixes separated by commas, like 4,5, to include all accounts starting with 4 and 5.
The External Value engine is used when you want to show a value in the report that isn’t pulled from accounting records. Instead, the value is entered manually or carried over from previous periods.
These values are not stored as regular journal entries (account.move.line), but instead as account.report.external.value records. Each of these values is directly linked to the expression it affects, so you don’t need to set any filters or formulas in the expression itself.
This engine is especially useful for reporting forecasts, adjustments, or opening balances that come from outside the system or are manually controlled.
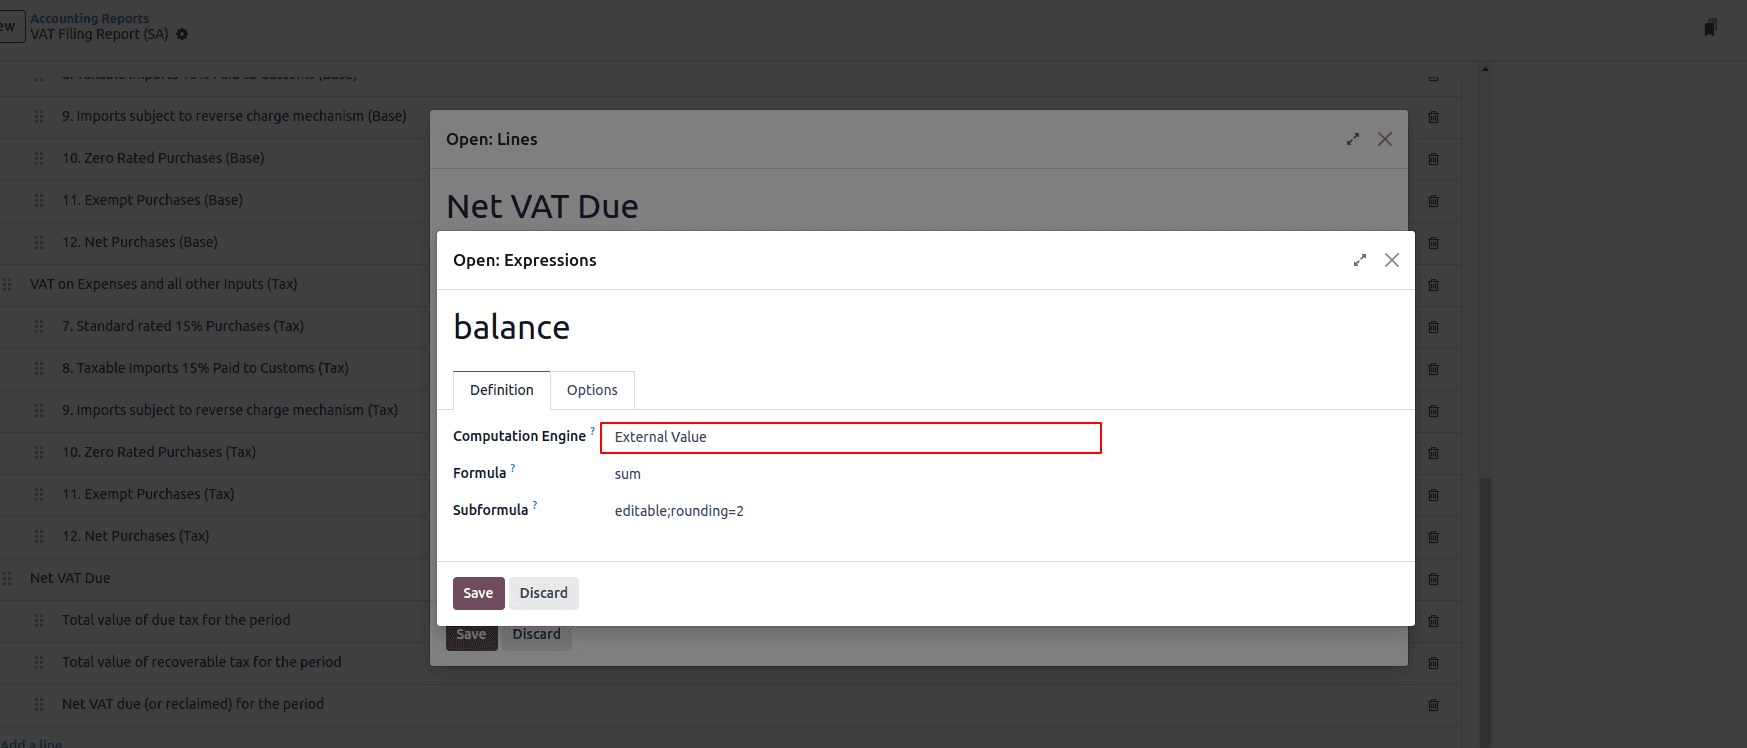
You can also use subformulas to control how the value behaves:
* sum – This will add up all external values entered during the period.
* most_recent – This will use only the latest external value entered in the period.
* rounding=X – Rounds the result to X decimal places. Replace X with a number (e.g., rounding=2).
* editable – Allows the value to be manually edited in the report. When this is set, an icon will appear so users can click and enter a new amount directly.
Custom Python Function Engine allows developers to add custom calculations for specific cases. The formula is the name of the Python function to call, and the subformula is the key used to get the value from the dictionary that the function returns.
This engine should only be used if you're building a custom module, as it requires writing backend Python code to define the function logic.

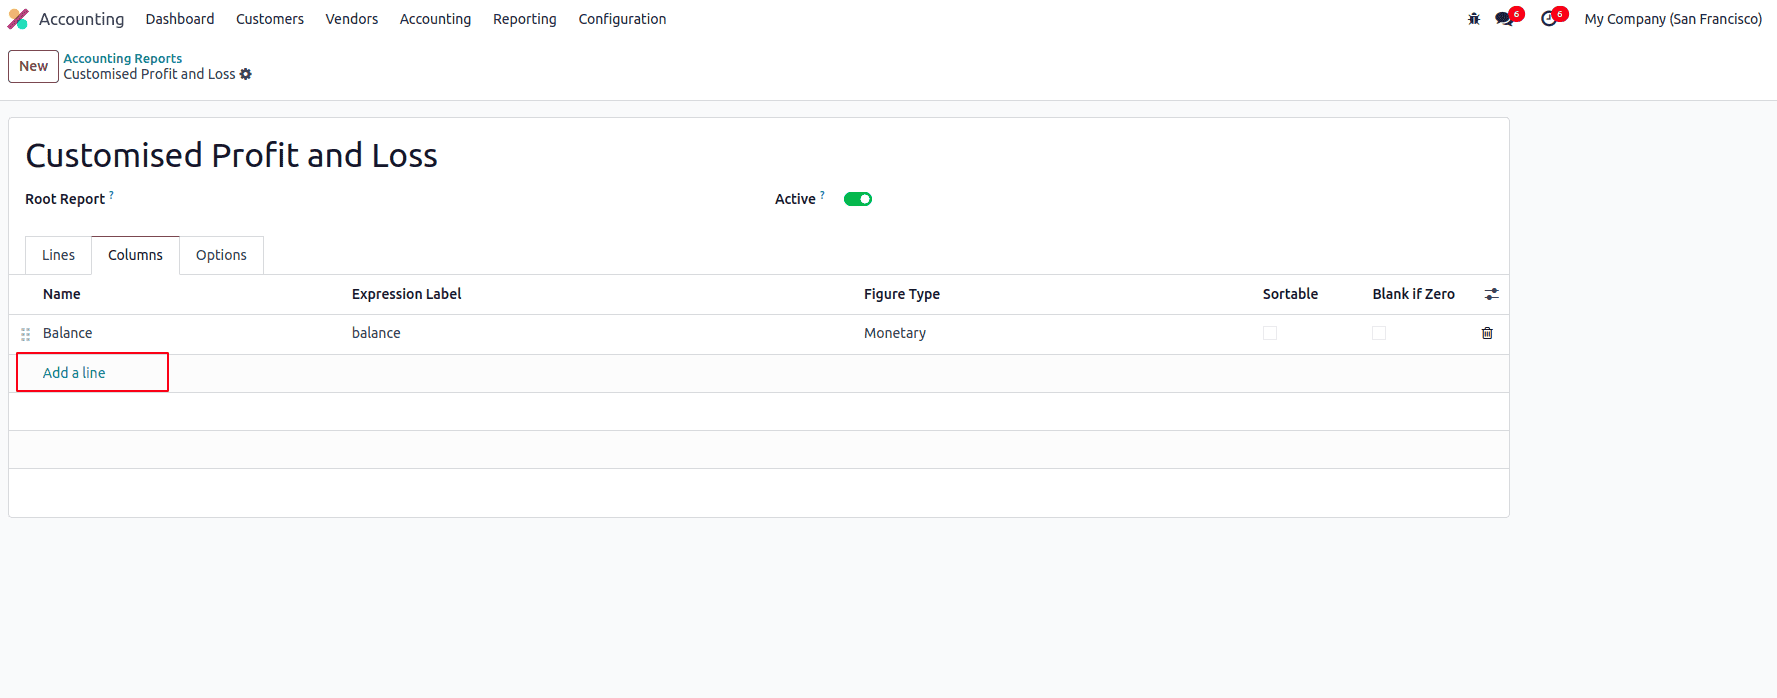
After defining the lines of your financial report, the next step is to configure the columns, which control how the data is displayed across the report—such as showing balances, comparisons, percentages, or time-based splits.
To do this, go to the Columns tab of the report and click “Add a line” to create a new column. Each column represents one type of data (like current balance, previous period, or difference), and you can add multiple columns depending on what information you want to show.
Columns help define what data appears and how it should be calculated or formatted for each line in the report.
The field expression_label of the column gives the label of the expressions whose value is displayed. If a line has no expression in that field, then nothing is displayed for it in this column. If multiple columns are required, you must use different expression labels.
The Options tab allows you to configure how your accounting report is displayed and calculated. These settings provide control over filtering, layout, formatting, and grouping behavior for the report. Each option can significantly affect what is shown and how it's presented.
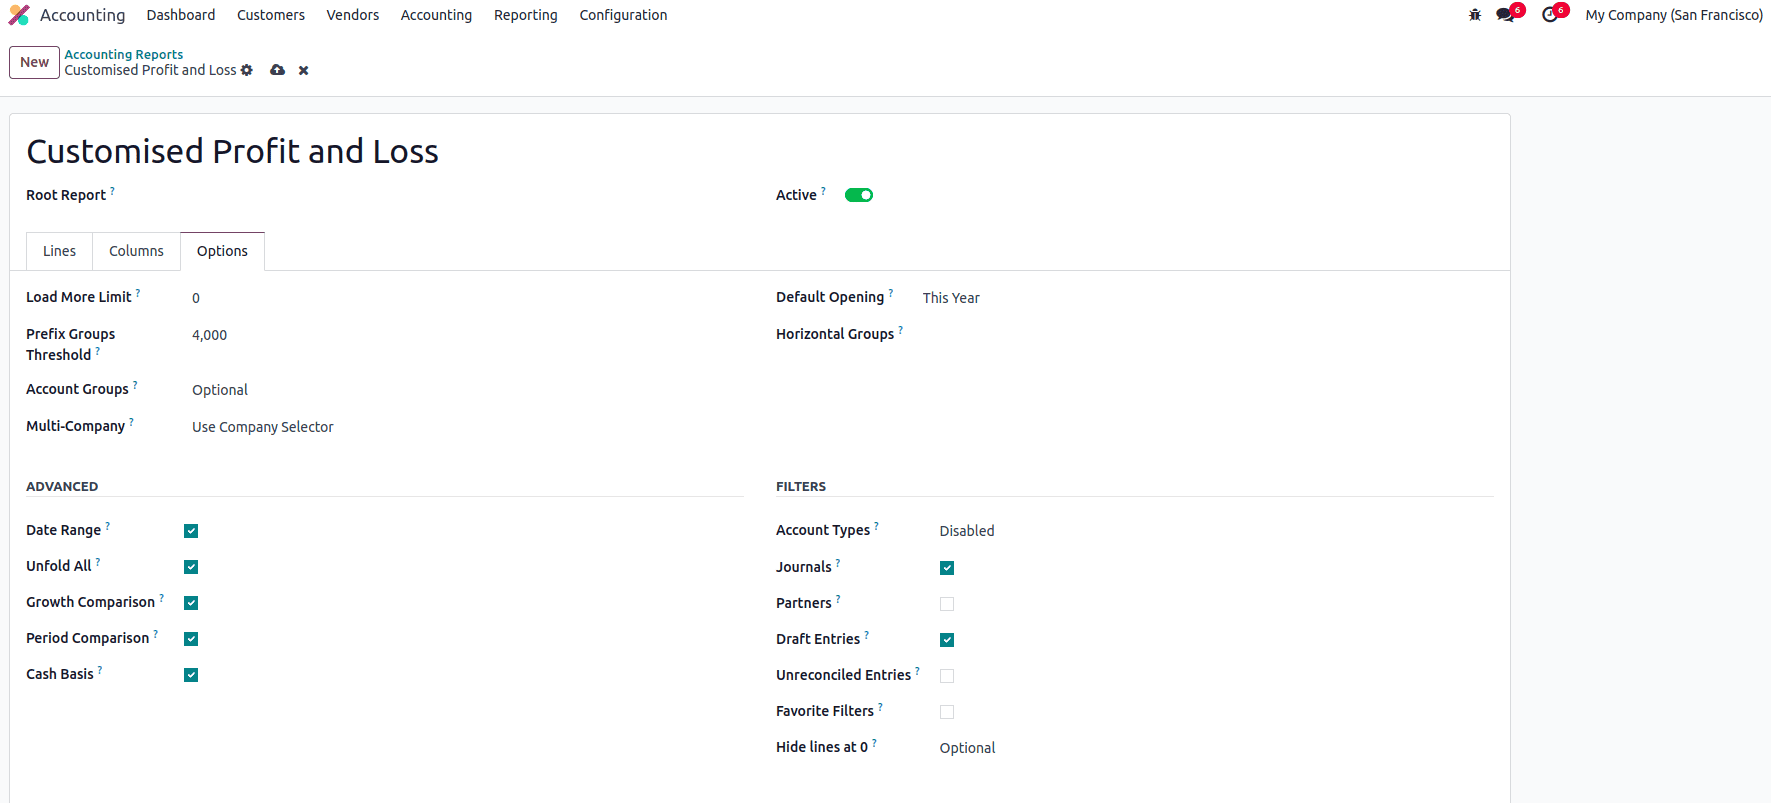
The number of lines initially shown in the report can be controlled using the Load More Limit field. The Prefix Group Threshold defines how many similar lines must exist to automatically group them by a common prefix. The Account Groups option can be set as Enabled by Default, Optional, or Never, depending on how you want to display account groupings. The Multi-Company filter can be configured using Use Company Selector or Use Tax Unit, or it can be Disabled if multi-company selection is not needed in the report.
The Default Opening field allows you to set a default time period that will be applied automatically when opening report. The necessary Horizontal Groups can be specified in the provided field to group report data accordingly.
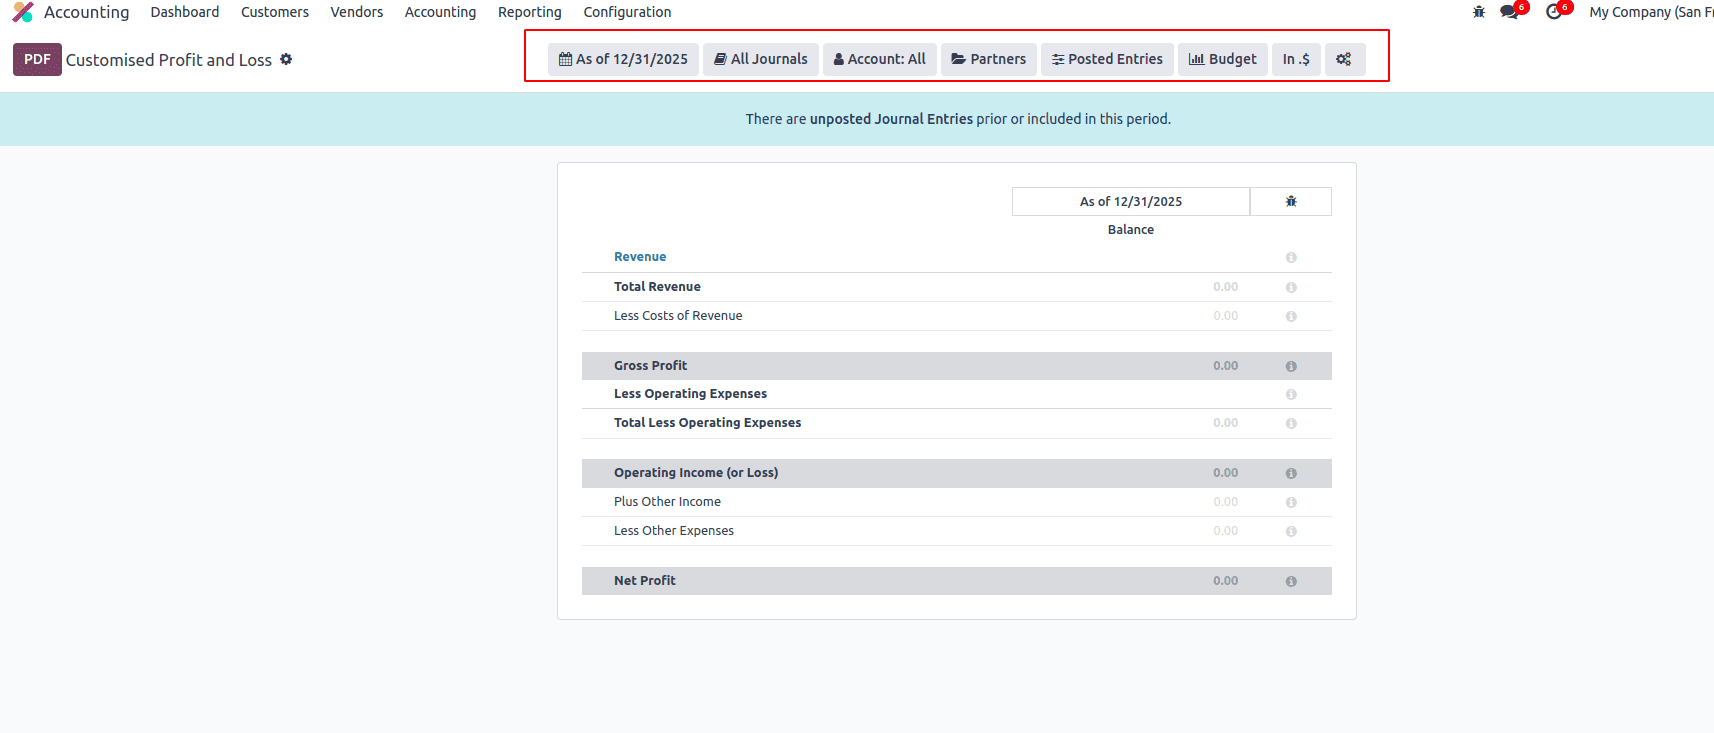
To display features like Date Range, Unfold All, Growth Comparison, and Period Comparison on the report, you can activate the corresponding fields in the Advanced section. Enabling the Cash Basis field will allow users to switch the report to cash basis mode. To add extra filtering options, you can enable Account Types, Journals, Partners, Draft Entries, and Unreconciled Entries from the Filters section.
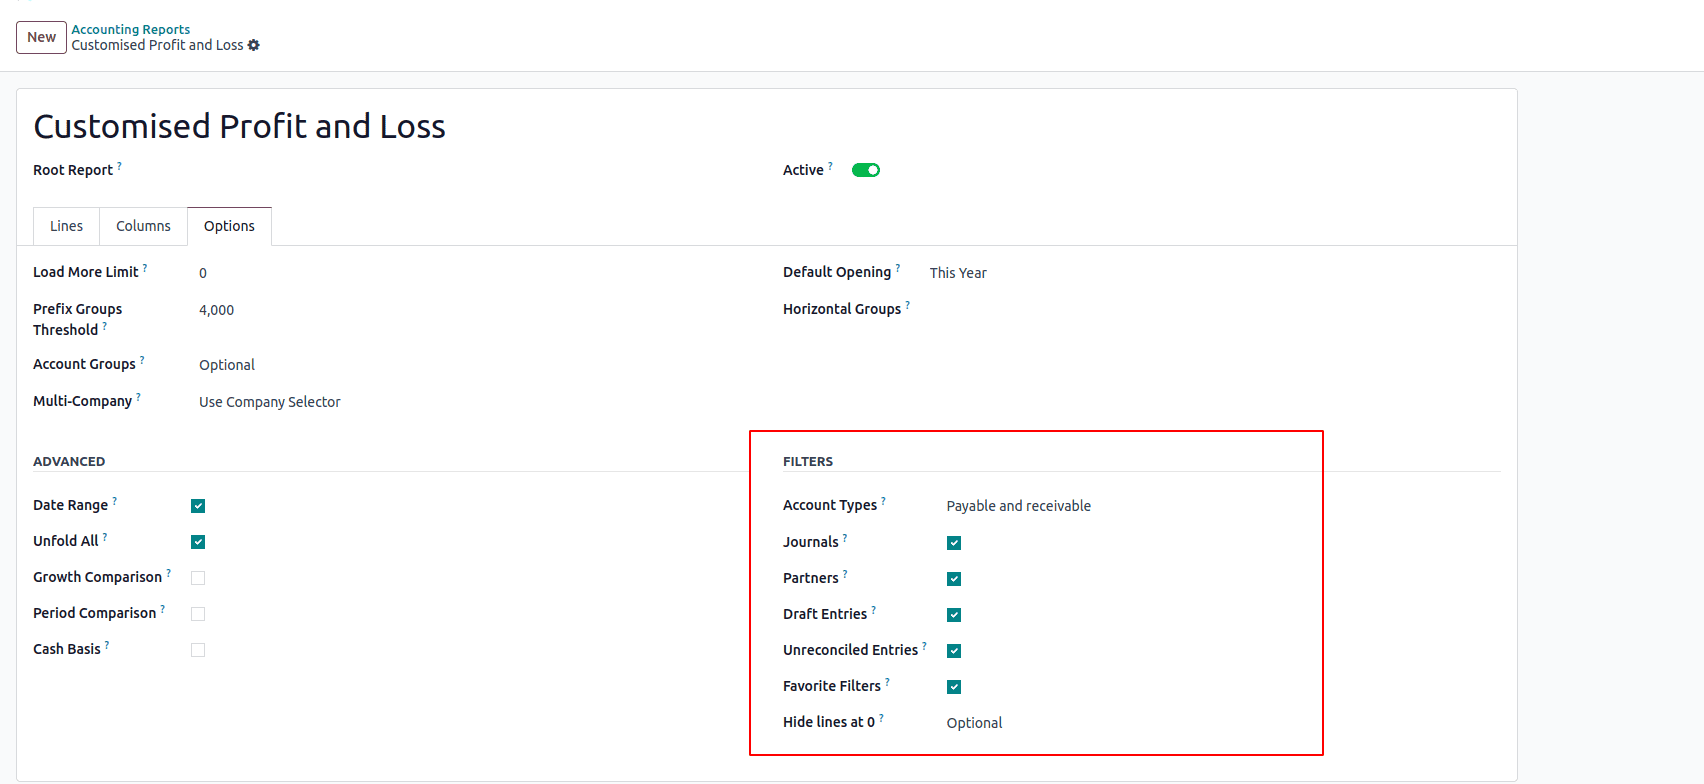
After enabling the options in the Filters section, the report will display additional filter fields at the top, allowing users to refine the data based on the selected criteria.
Setting up the report with the right options helps you view and analyze your financial data more easily. By enabling filters, groups, comparisons, and multi-company support, you can customize the report to fit your needs and make better decisions based on clear, accurate information.
To read more about How to Customize Your Financial Reports & Tax Reports With Odoo 17 Accounting, refer to our blog How to Customize Your Financial Reports & Tax Reports With Odoo 17 Accounting.