In the ever-changing world of business, understanding and making sense of data is crucial. Pivot views are like having a super tool to untangle insights from complicated sets of information. These views not only make data look organized but also give you an easy way to study and understand it.
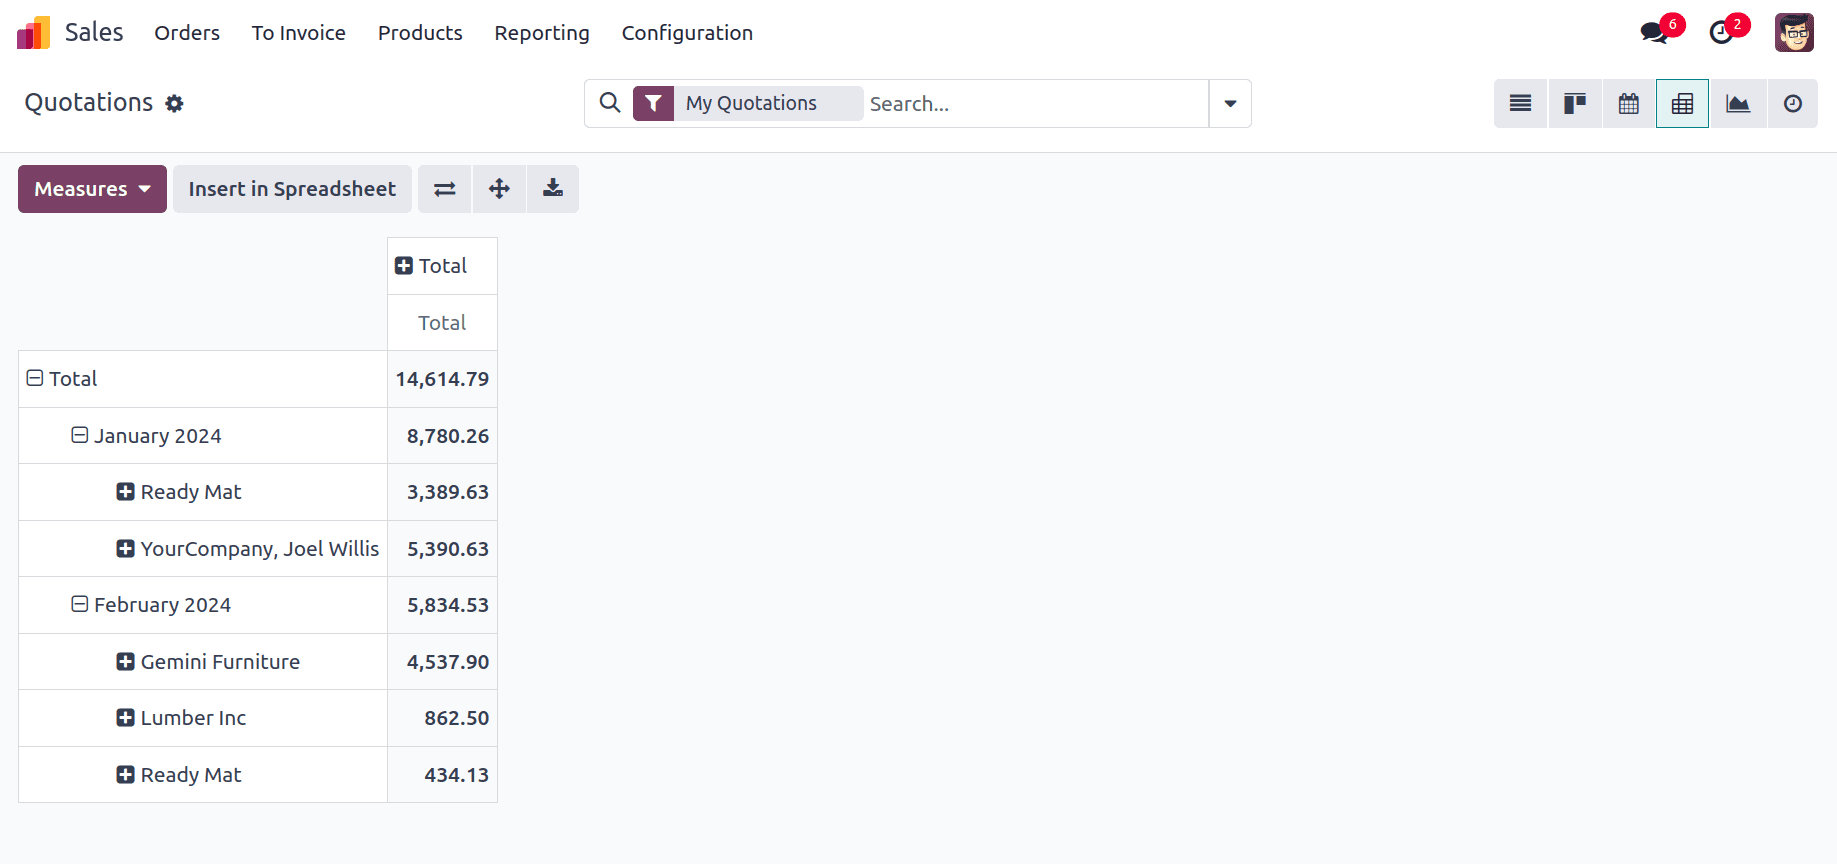
A Pivot view in Odoo 17 is a smart way to look at your information in a more organized and user-friendly manner. It helps you group, summarize, and analyze your data, making it easier to spot trends, patterns, and important details. It's like turning a messy pile of papers into a neat and insightful report. Users have the capability to filter data within the pivot view based on a specific field. Additionally, they can employ sorting functionalities to organize the data as needed. The provided image illustrates an example of the pivot view in action.
Now, let's dive into the details of creating Pivot views in Odoo 17!
To set up a pivot view, let's begin by creating a new model and incorporating the fields that will be included in the pivot view.
Here, I created a model ‘service.request’ with fields name, employee_id, user_id, date, and state.
class ServiceRequest(models.Model):
    _name = 'service.request'
    _description = 'Service Request'
    name = fields.Char(string='Number', readonly=True, default='New')
    employee_id = fields.Many2one('hr.employee', string='Employee')
    user_id = fields.Many2one('res.users', 'Manager')
    date = fields.Date(string='Date')
    state = fields.Selection(selection=[
        ("draft", "Draft"), ("submit", "Submit"), ("assigned", "Assigned"),
        ("in_progress", "In Progress"), ("resolved", "Resolved"),
        ], default='draft')
    total_amount = fields.Float(string='Total Amount')
To create a pivot view for the above model, you need to define an XML file for the window action and another for the view itself.
<record id="action_service_request"     model="ir.actions.act_window">
   <field name="name">Service Request</field>
   <field name="res_model">service.request</field>
   <field name="view_mode">tree,form,pivot</field>
</record>
In this XML snippet, create a window action named "Service Request" for the above model "service.request". The view_mode field specifies the different views available when opening the action. Here, it includes tree, form, and pivot views.
<record id="service_request_view_pivot" model="ir.ui.view">
    <field name="name">service.request.view.pivot</field>
    <field name="model">service.request</field>
    <field name="arch" type="xml">
        <pivot string="Service Request">
            <field name="state" type="row"/>
            <field name="employee_id" type="col"/>
            <field name="total_amount" type="measure"/>
        </pivot>
    </field>
</record>
Here, you're defining a pivot view for the "service.request" model.
<pivot> is the root element for the pivot view. The string attribute sets the title of the pivot view to "Service Request." Inside the <pivot> element, you define the structure of the pivot table:
<field name="state" type="row"/>
This field will be used for rows in the pivot table. It implies that the pivot table will group data based on the "state" field of the service requests.
<field name="employee_id" type="col"/>
This field will be used for columns in the pivot table. It implies that the pivot table will organize data horizontally based on the "employee_id" field of the service requests.
<field name="total_amount" type="measure"/>
This field represents the numerical values to be aggregated in the pivot table. It implies that the pivot table will calculate the sum or other measures of the "total_amount" field for each combination of state and employee_id.
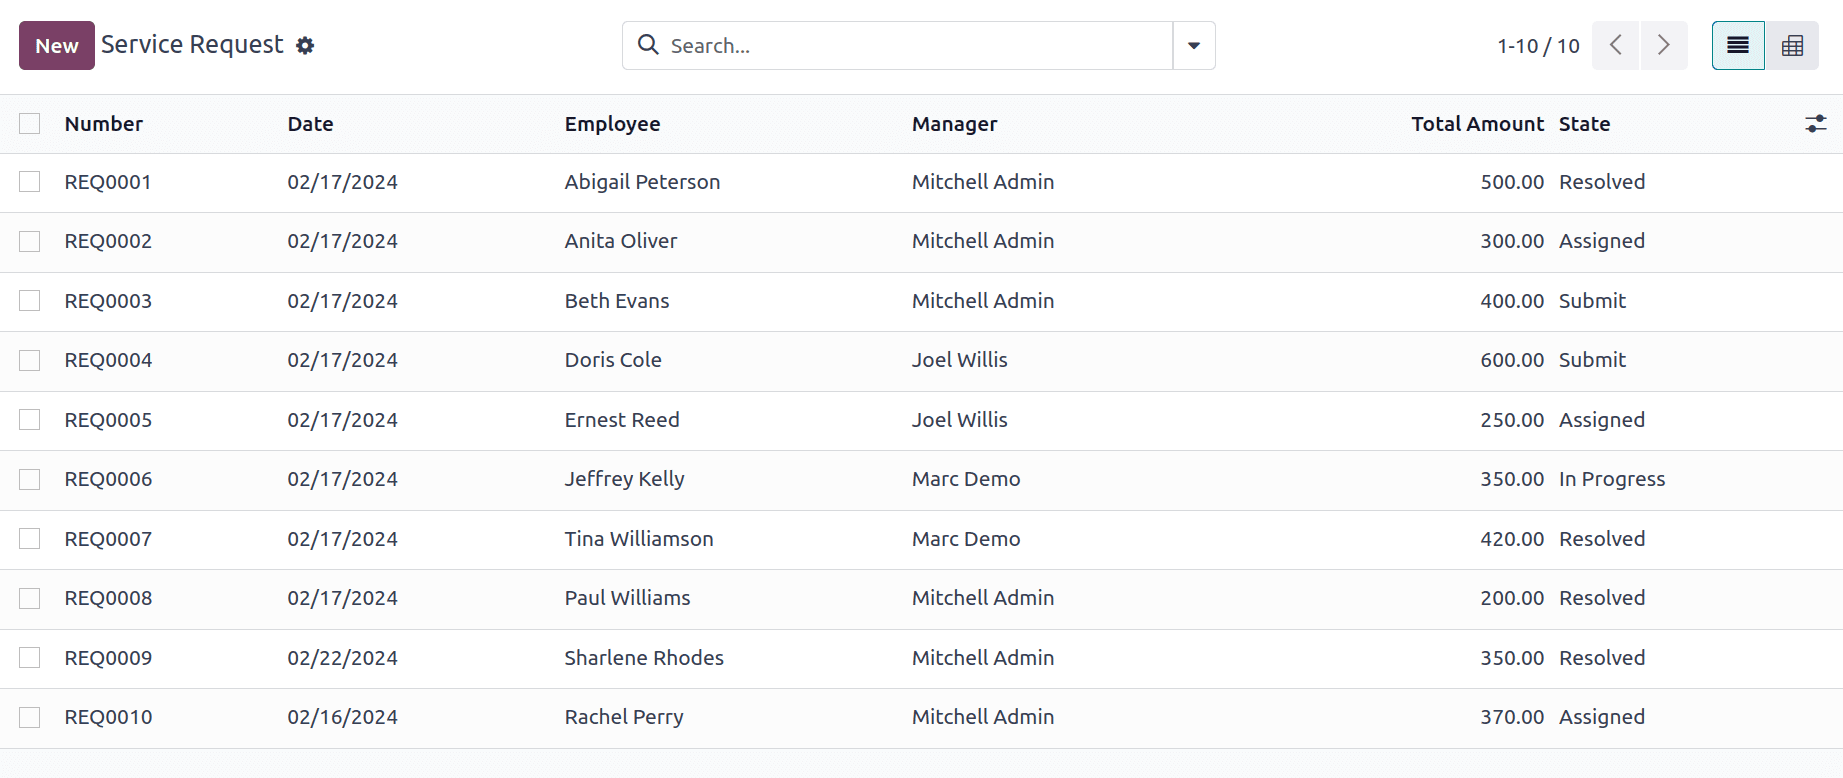
This is the tree view of records in our model ‘service.request’.
Pivot view:
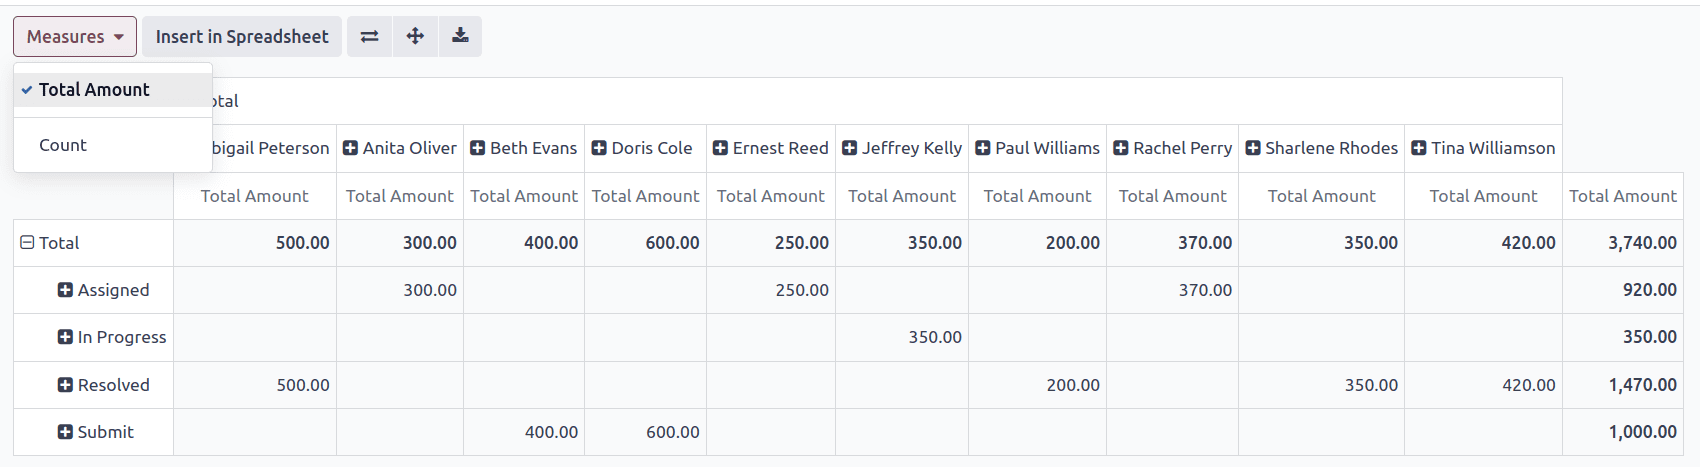
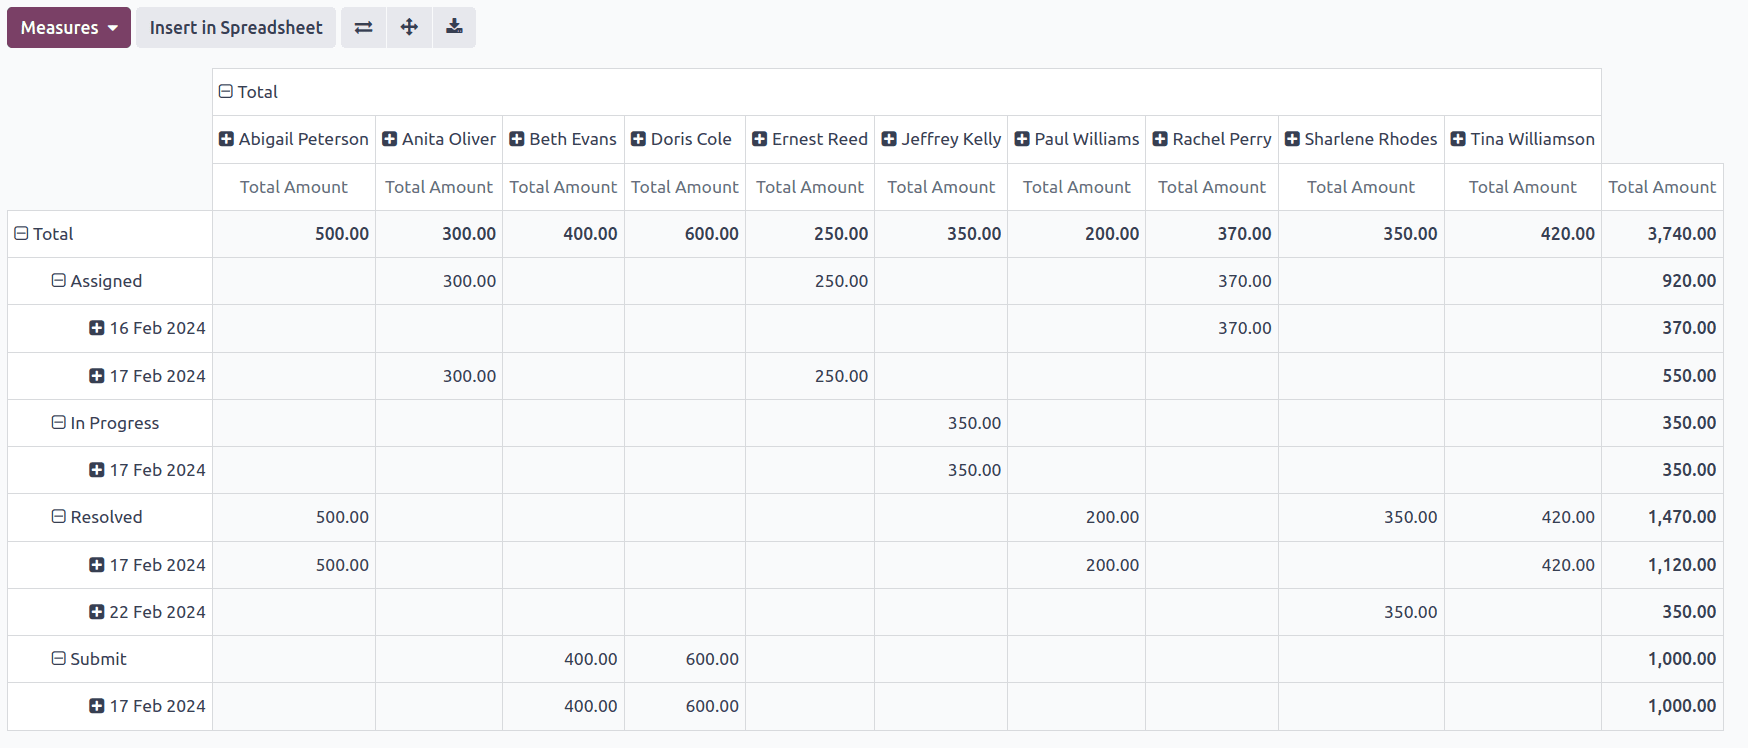
Here, the records are automatically grouped based on the fields 'state' and 'employee_id', with the total amount displayed, as the 'total_amount' field is utilized as the measure.
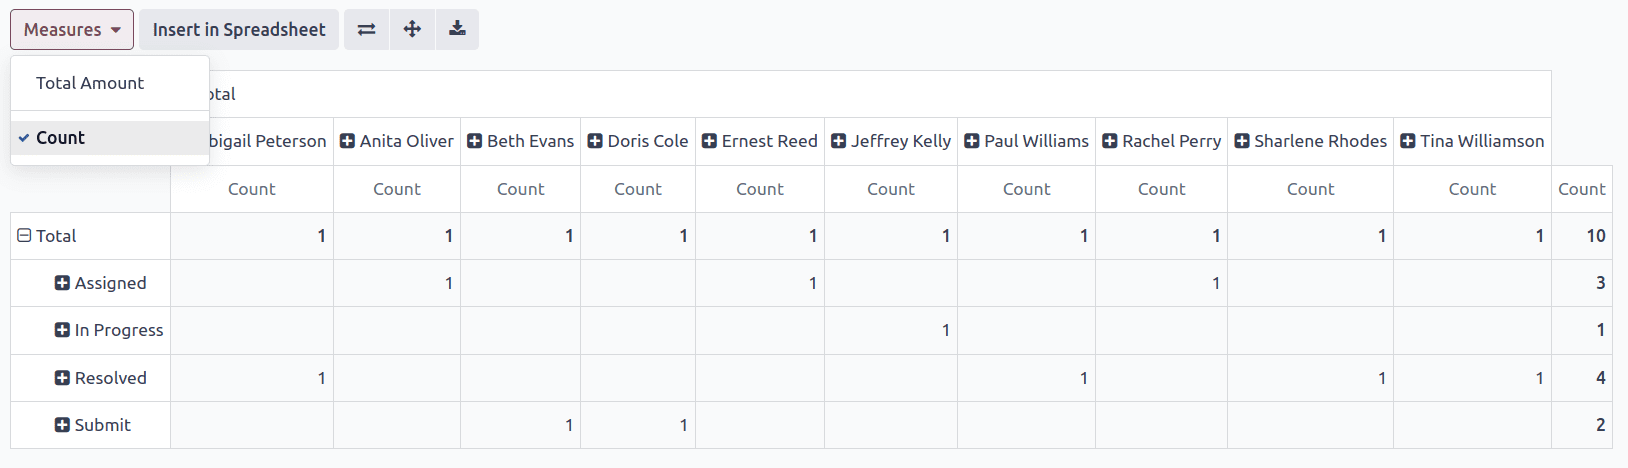
You can also view it with the measure ‘count.’ By default, the measure ‘Count’ is available in the pivot view.
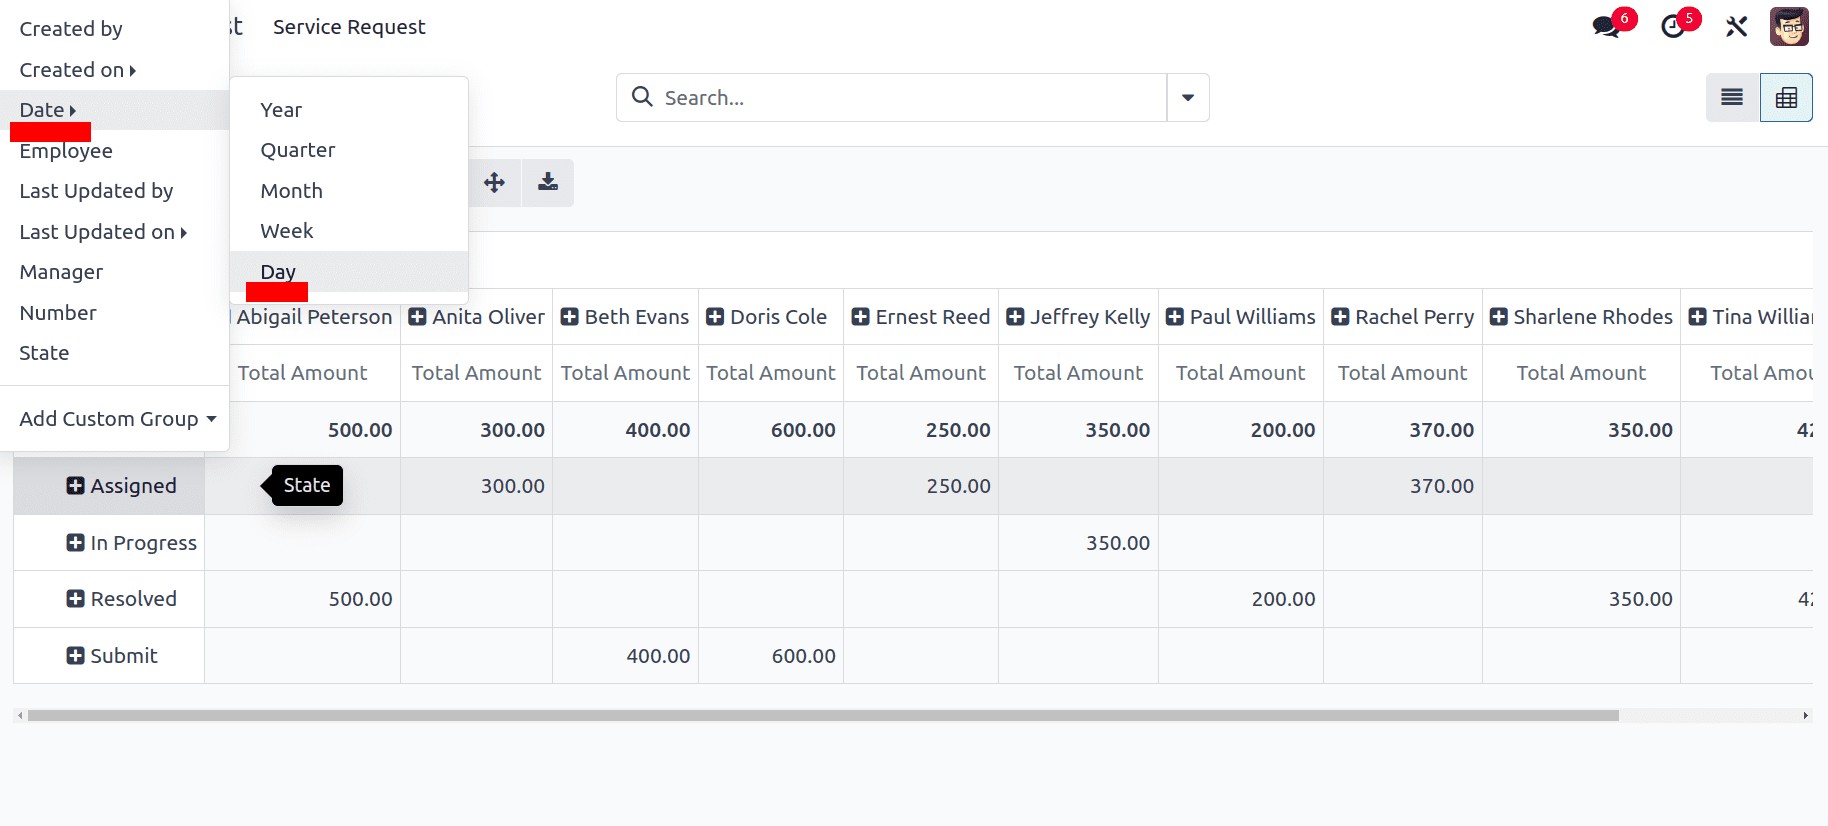
You can also view data by grouping your different fields.
To group the above data based on date, you can apply the filter as shown below:
You will get the results as:
In this way, you can use the Pivot view for making the data visualization more easier. In conclusion, creating Pivot views offers a powerful tool for organizing and analyzing data effectively.