When deploying Odoo, performance can become a silent issue, especially as your database grows, more users access it, and custom modules become more complex. At first, everything looks good. Until the users start complaining, “It’s slow,” “Reports take forever,” or “Pages aren’t loading right.
This is what ‘Monitoring’ and ‘Profiling’ are for.
Monitoring is like a health tracker; it tells you what’s happening at the moment. Profiling, on the other hand, is like a diagnostic tool that helps you figure out why something is slow.
Tuning performance in Odoo 19 is not just about writing code that works well, but about observing, measuring, and constantly improving.
What is Monitoring in Odoo?
Monitoring allows you to watch and measure key aspects of your system, such as server performance (CPU and memory usage), database query execution, response times for requests, total active users, and total incoming requests, so you can quickly identify issues and keep your system running smoothly.
Basic Monitoring Techniques
1. Using Logs
Odoo logs are the first place to look.
./odoo-bin --log-level=debug
You can also enable SQL query logs:
./odoo-bin --log-level=debug_sql
This helps you learn about the number of queries executed, slow performing queries, and repeated queries, which can be an indication of inefficiencies in the system.
2. Monitoring Long Queries in PostgreSQL
Odoo uses PostgreSQL, so database monitoring is crucial.
Enable slow query logging in PostgreSQL:
ALTER SYSTEM SET log_min_duration_statement = 500; -- logs queries > 500ms
SELECT pg_reload_conf();
This helps identify expensive queries, detect missing indexes, and uncover inefficient ORM usage that may be impacting overall system performance.
3. Real-time Monitoring Tools
You can use utilities like top or htop for CPU and memory usage, pgAdmin for database insights, and external monitoring tools like Grafana and Prometheus for advanced monitoring and visualization.
What is Profiling in Odoo?
Profiling is a way to get deeper insights into your application by being able to find what functions are slow, measuring how much time is taken to run each method, and finding the exact areas in your code where performance bottlenecks exist.
Profiling in Odoo 19
Odoo provides built-in profiling tools.
1. Using Odoo Profiler
You can enable profiling using:
./odoo-bin --dev=all
This provides insights into method execution time, reveals the call hierarchy between functions, and helps identify performance bottlenecks within the code.
2. Using Python cProfile
You can profile specific methods using Python’s built-in profiler.
import cProfile
import pstats
import io
import functools
mport cProfile

def profile_function(func):
    @functools.wraps(func)
    def wrapper(*args, **kwargs):
        profiler = cProfile.Profile()
        profiler.enable()
        result = func(*args, **kwargs)
        profiler.disable()
        stream = io.StringIO()
        stats = pstats.Stats(profiler, stream=stream).sort_stats('cumulative')
        stats.print_stats(20)
        print(stream.getvalue())
        return result
    return wrapper
Usage in Odoo Model:
from odoo import models
class SaleOrder(models.Model):
    _inherit = 'sale.order'
    @profile_function
    def action_confirm(self):
        return super().action_confirm()
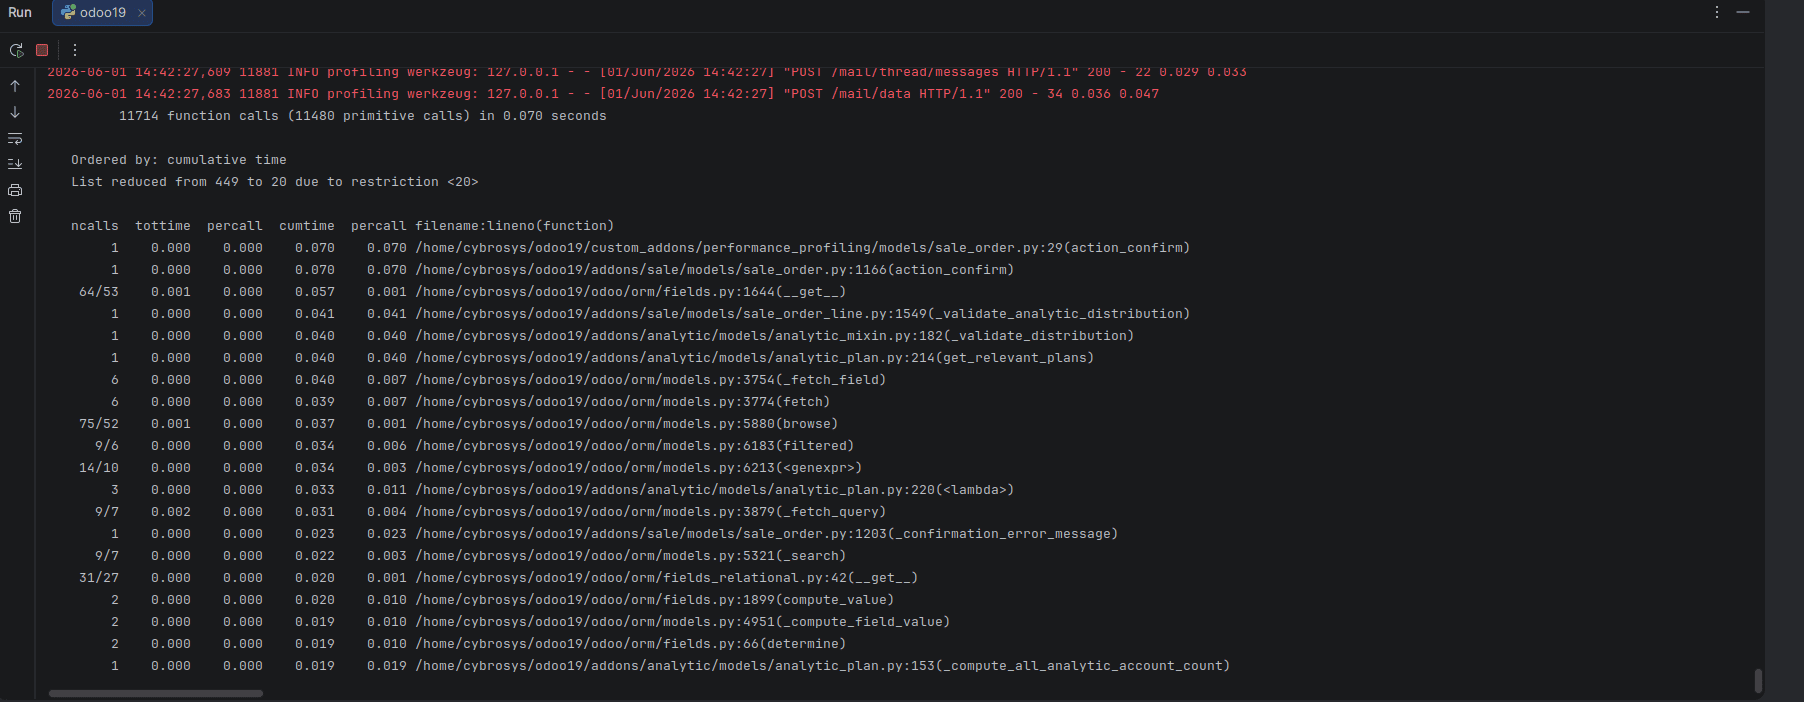
This will display the time taken by each function, the number of times each function was called, and the cumulative execution time for all the calls.
3. SQL Query Count Profiling
Sometimes the issue is not slow code but too many queries.
Example:
from odoo import models,fields
from odoo.tools.profiler import Profiler
class ResPartner(models.Model):
    _inherit = 'res.partner'
    partner_count = fields.Integer(
    string='Partner Count',
    compute='_compute_partner_count',
   store=False,
   )
  def _compute_partner_count(self):
  # Move search_count outside the loop — one query for all records
     count = self.env['res.partner'].search_count([])
     for record in self:
       record.partner_count = count
  def compute_data(self):
        with Profiler():
            for record in self:
                record.value = self.env['res.partner'].search_count([])
This can generate an N+1 query problem.
Common Performance Issues You’ll Detect
- N+1 queries (looping with DB calls)
- Missing indexes
- Unnecessary recomputations
- Inefficient ORM usage
- Large recordsets processed without batching
Best Practices for Performance Tuning
Use read_group instead of looping with search; don't run queries in a loop, use prefetching effectively, add indexes to fields that are frequently searched, cache results when you can, and run batch operations instead of working on records one by one.
In Odoo 19, performance tuning is not a one-time job but an ongoing process. Monitoring provides insight into what’s happening in your system, while profiling helps you understand why it’s happening. Together, they become powerful tools to make sure your Odoo system can run smoothly even under heavy load. Great developers use data-driven insights to find the problem; good developers guess.
To read more about Overview of Performance Tuning in Odoo 19 Worker Configuration, refer to our blog Overview of Performance Tuning in Odoo 19 Worker Configuration.