In the fast-paced world of business, understanding your customers is paramount. RFM analysis is a powerful technique that allows data scientists and marketers to gain actionable insights into customer behaviour. In this technical blog, we will guide you through the process of performing RFM analysis using Python, enabling you to segment your customers effectively.
What is RFM Analysis?
RFM stands for Recency, Frequency, and Monetary. It is a data-driven approach to customer segmentation based on their:
1. Recency (R): How recently a customer made a purchase.
2. Frequency (F): How often a customer makes a purchase.
3. Monetary (M): The monetary value of a customer's purchases
By analyzing these three dimensions, businesses can tailor their marketing strategies to specific customer segments, enhancing customer satisfaction and driving profitability.
Getting Started with RFM Analysis
To begin, you'll need a dataset containing essential information such as customer IDs, purchase dates, and transaction amounts. For this guide, we'll use a sample dataset that you can download it from here.
https://www.kaggle.com/datasets/akash1vishwakarma/rfm-dataset?resource=download
Let's start by loading the dataset and preparing it for RFM analysis.
import pandas as pd
from datetime import datetime
# Load the dataset
data = pd.read_csv("rfm_data.csv")
# Convert 'PurchaseDate' to datetime
data['PurchaseDate'] = pd.to_datetime(data['PurchaseDate'])
# Calculate Recency
data['Recency'] = (datetime.now().date() - data['PurchaseDate'].dt.date).dt.days
# Calculate Frequency
frequency_data = data.groupby('CustomerID')['OrderID'].count().reset_index()
frequency_data.rename(columns={'OrderID': 'Frequency'}, inplace=True)
data = data.merge(frequency_data, on='CustomerID', how='left')
# Calculate Monetary Value
monetary_data = data.groupby('CustomerID')['TransactionAmount'].sum().reset_index()
monetary_data.rename(columns={'TransactionAmount': 'MonetaryValue'}, inplace=True)
data = data.merge(monetary_data, on='CustomerID', how='left')
Calculating RFM Scores
Now that we have the necessary data, let's move on to calculating RFM scores for each customer.
# Define scoring criteria for each RFM value
recency_scores = [5, 4, 3, 2, 1]
frequency_scores = [1, 2, 3, 4, 5]
monetary_scores = [1, 2, 3, 4, 5]
# Calculate RFM scores
data['RecencyScore'] = pd.cut(data['Recency'], bins=5, labels=recency_scores)
data['FrequencyScore'] = pd.cut(data['Frequency'], bins=5, labels=frequency_scores)
data['MonetaryScore'] = pd.cut(data['MonetaryValue'], bins=5, labels=monetary_scores)
# Convert RFM scores to numeric type
data[['RecencyScore', 'FrequencyScore', 'MonetaryScore']] = data[['RecencyScore', 'FrequencyScore', 'MonetaryScore']].astype(int)
Calculating RFM Segments
With the individual RFM scores in place, let's combine them to create an overall RFM score and segment the customers.
# Calculate RFM score by combining the individual scores
data['RFM_Score'] = data['RecencyScore'] + data['FrequencyScore'] + data['MonetaryScore']
# Create RFM segments based on the RFM score
segment_labels = ['Low-Value', 'Mid-Value', 'High-Value']
data['RFM_Segment'] = pd.qcut(data['RFM_Score'], q=3, labels=segment_labels)
Customer Segmentation
Now, let's assign specific segments to customers based on their RFM scores.
# Create a new column for RFM Customer Segments
data['RFM_Customer_Segment'] = ''
# Assign RFM segments based on the RFM score
data.loc[data['RFM_Score'] >= 9, 'RFM_Customer_Segment'] = 'Champions'
data.loc[(data['RFM_Score'] >= 6) & (data['RFM_Score'] < 9), 'RFM_Customer_Segment'] = 'Potential Loyalists'
data.loc[(data['RFM_Score'] >= 5) & (data['RFM_Score'] < 6), 'RFM_Customer_Segment'] = 'At Risk Customers'
data.loc[(data['RFM_Score'] >= 4) & (data['RFM_Score'] < 5), 'RFM_Customer_Segment'] = "Can't Lose"
data.loc[(data['RFM_Score'] >= 3) & (data['RFM_Score'] < 4), '
RFM_Customer_Segment'] = "Lost"
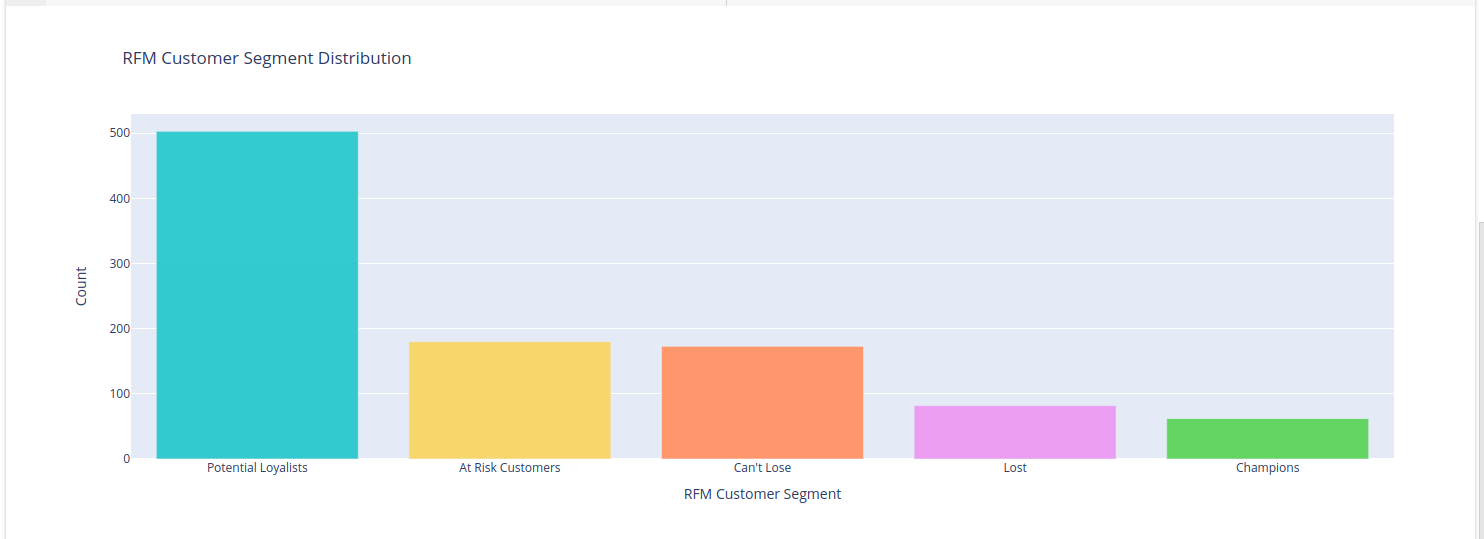
Visualizing RFM Segments
Now, let's visualize the distribution of RFM segments and gain insights into customer behavior.
import plotly.express as px
# RFM Segment Distribution
segment_counts = data['RFM_Customer_Segment'].value_counts().reset_index()
segment_counts.columns = ['RFM_Customer_Segment', 'Count']
# Create the bar chart
fig_segment_dist = px.bar(segment_counts, x='RFM_Customer_Segment', y='Count',
                          color='RFM_Customer_Segment', color_discrete_sequence=px.colors.qualitative.Pastel,
                          title='RFM Customer Segment Distribution')
# Update the layout
fig_segment_dist.update_layout(xaxis_title='RFM Customer Segment',
                              yaxis_title='Count',
                              showlegend=False)
# Show the figure
fig_segment_dist.show()
Congratulations! You've completed the process of RFM Analysis for Customer Segmentation using python. By leveraging the power of RFM segmentation, businesses can gain valuable insights into customer segments, allowing for targeted and effective marketing strategies. Feel free to adapt and modify the code to suit your specific business needs.