Profiling
Code profiling is a dynamic examination of a programme that assesses its complexity,
execution time, frequency of function calls, and memory consumption. A profiler is a
tool that is used to profile code. Profiling is carried out via performance analysis of
source code or binary executables.
Programmers want profilers because they provide an analysis of how well their programme
functions on various platforms. As a result, profilers make it easy to find the code
sections that take the most time and optimize them for better performance. In a
nutshell, profiling aids in the identification of bottlenecks in our software.
There are mainly two types of profilers
Server-side profilers keep track of transaction request time, such as how long a web
request takes, failures, and so on. It maintains track of the performance of each line
of code in desktop profilers. In a nutshell, it monitors memory usage and garbage
collection.
Methods of code profiling
- Graph a method
- Log a method
- Tracing code Execution
Graph a method
- Odoo embeds a profiler in code that generates graphs of calls triggered in the
program, time is taken, memory used, etc. You can add the below code to the function
for which you need to perform the analysis
from odoo.tools.misc import profile
[...]
@profile('/path/prof.profile')
def mymethod(...)
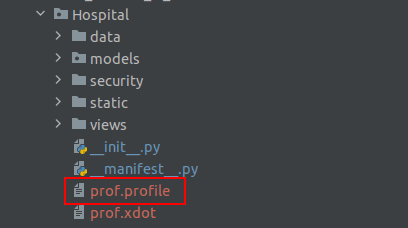
The @profile('/path/prof.profile') should include the path where you need your file
prof.profile because adding the above code produces a file prof.profile.
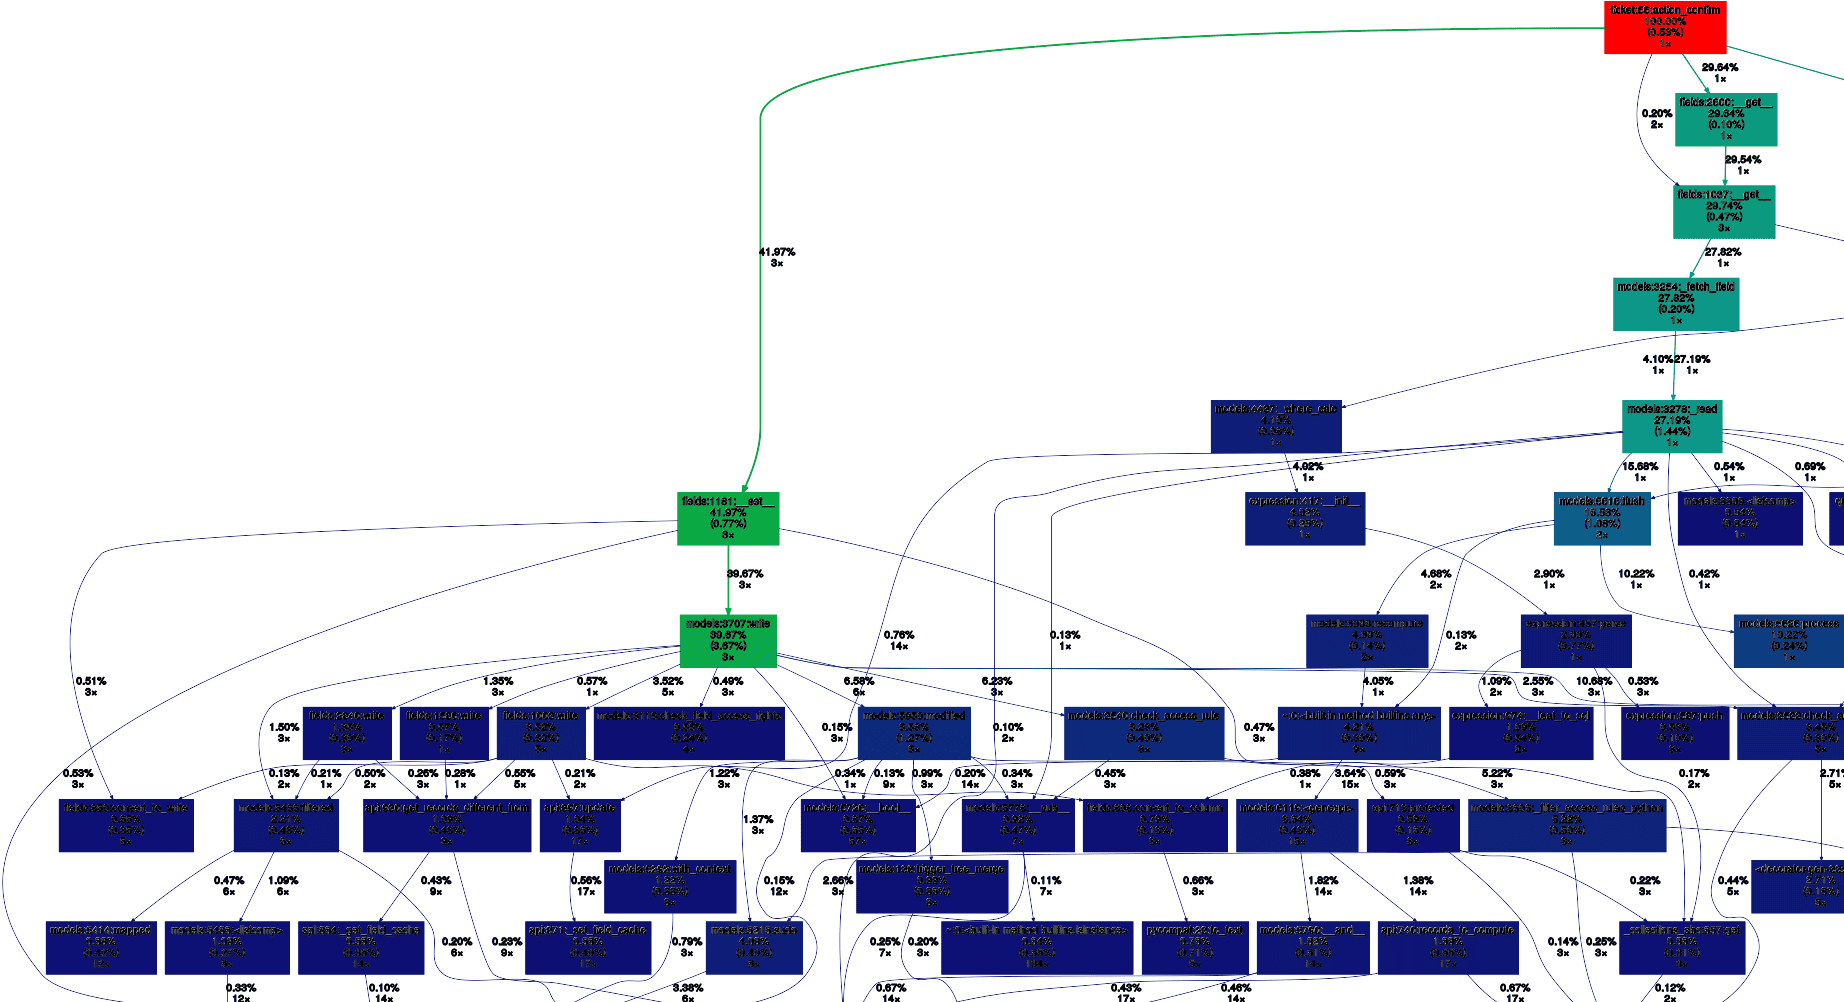
Now you can use the tool gprof2dot to produce a graphical analysis.
gprof2dot -f pstats -o /path/prof.xdot /path/prof.profile
run the above command in the terminal /path/prof.profile, /path/prof.xdot should be
replaced with your file path.
To see the graphical analysis, we can use the below command.
xdot /path/prof.xdot
Here in order to see the graphical analysis, we use the tool xdot, which will provide the
description as mentioned below.
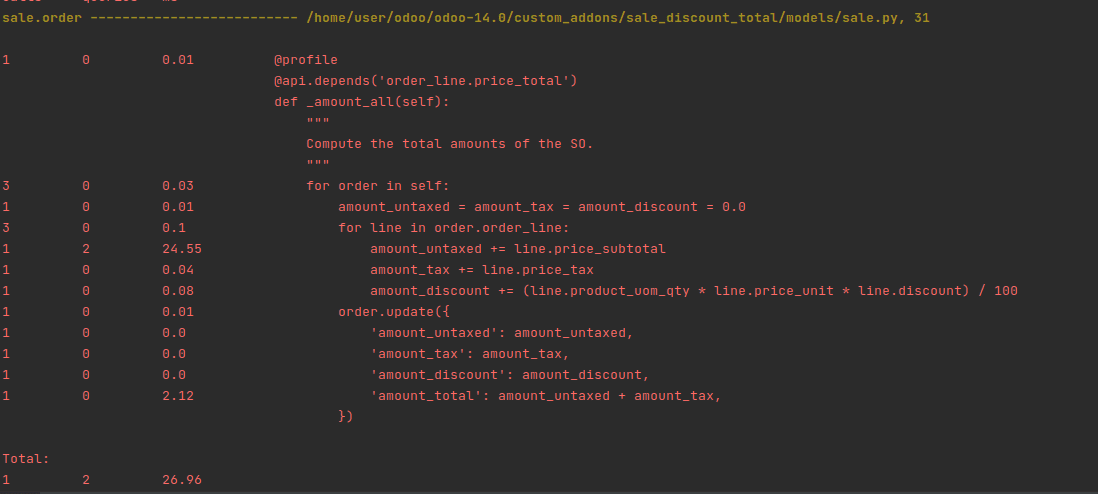
Log a Method
- Another strategy to log the statistical data on a method using another profiler can
be done using the following code
from odoo.tools.profiler import profile
[...]
@profile
@api.model
def mymethod(...):
Once the procedure to be analyzed has been thoroughly assessed, the statistics will be
provided in the logs.
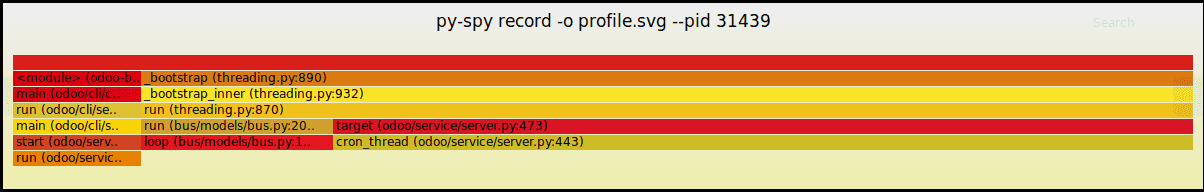
Tracing Code Execution
- A tool called pyflame can be used to analyze poor process performance. To get
started, we'll need to install pyflame and flamegraph first. Using the graphical
representation, the flame graph assists us in analysing the result. In a nutshell,
the flame graph is a graphical representation of the call stack.
First, install the py-spy package using the below command
pip3 install py-spy
As py-spy is installed, we now record the executed code lines. This tool will record,
multiple times a second, the stack trace of the process.
sudo env "PATH=$PATH" py-spy record -o profile.svg --pid <PID>
where <PID> is the process ID of the Odoo process you want to graph.