Data visualization plays a pivotal role in making sense of complex information, and Chart.js emerges as a prominent JavaScript library for creating dynamic and visually appealing charts. In this in-depth guide, we'll take you through a comprehensive journey to getting started with Chart.js, covering everything from installation to advanced customization.
Step 1: Include Chart.js in Your Project
Before you can start leveraging the capabilities of Chart.js, you need to incorporate the library into your project. You have the option to either download it directly from the official website or utilize a Content Delivery Network (CDN). For simplicity, let's go with the CDN approach:
<!DOCTYPE html>
<html lang="en">
<head>
 <meta charset="UTF-8">
 <meta name="viewport" content="width=device-width, initial-scale=1.0">
 <title>Chart.js Tutorial</title>
 <script src="https://cdn.jsdelivr.net/npm/chart.js"></script>
</head>
<body>
 <!-- Your chart will go here -->
</body>
</html>
Step 2: Set Up the Canvas Element
The canvas element serves as the canvas on which your chart will come to life. Make sure to allocate a unique ID for easy referencing:
<canvas id="myChart" width="400" height="200"></canvas>
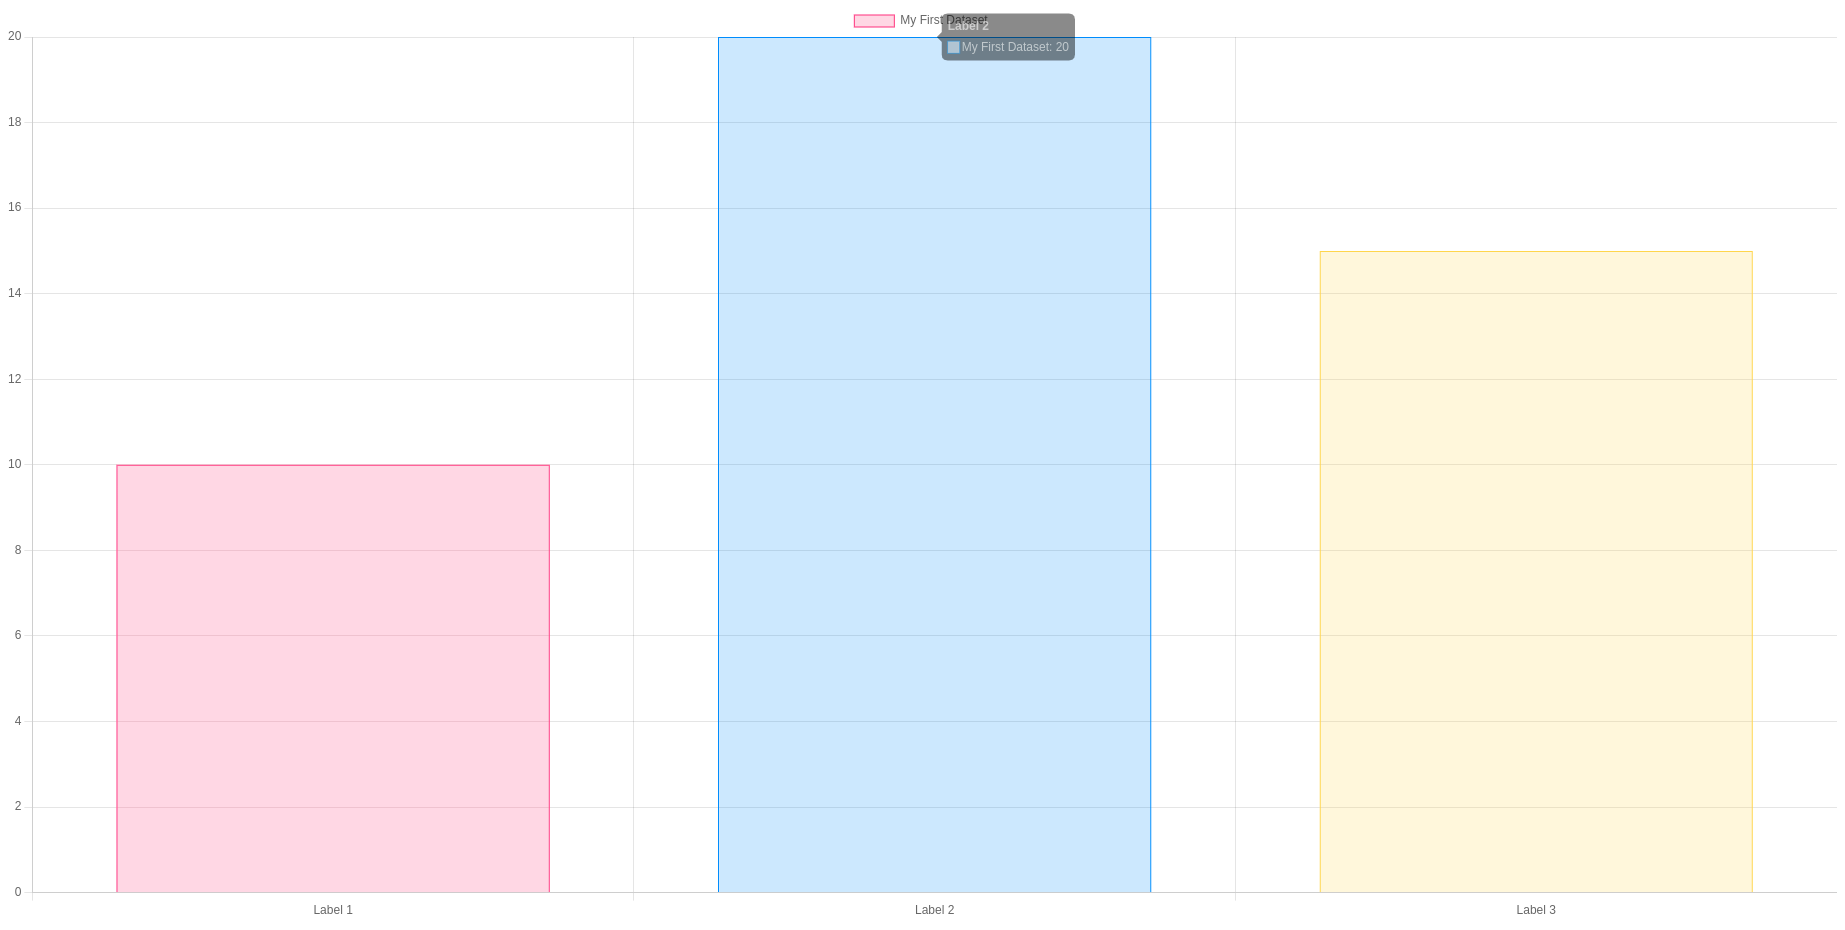
Step 3: Initialize Your First Chart
Now, let's create a simple bar chart as a starting point. Incorporate a JavaScript section where you will initialize your chart:
<script>
   // Get the canvas element
   var ctx = document.getElementById('myChart').getContext('2d');
   // Create a chart
   var myChart = new Chart(ctx, {
       type: 'bar', // Choose the chart type (bar, line, pie, etc.)
       data: {
           labels: ['Label 1', 'Label 2', 'Label 3'], // X-axis labels
           datasets: [{
               label: 'My First Dataset',
               data: [10, 20, 15], // Y-axis data
               backgroundColor: [
                   'rgba(255, 99, 132, 0.2)',
                   'rgba(54, 162, 235, 0.2)',
                   'rgba(255, 206, 86, 0.2)'
               ],
               borderColor: [
                   'rgba(255, 99, 132, 1)',
                   'rgba(54, 162, 235, 1)',
                   'rgba(255, 206, 86, 1)'
               ],
               borderWidth: 1
           }]
       },
       options: {
           scales: {
               y: {
                   beginAtZero: true
               }
           }
       }
   });
</script>
Step 4: Customizing Your Chart
Chart.js provides an extensive set of customization options. You can modify the data and options objects to tailor the chart according to your unique requirements. Refer to the official documentation for detailed customization options.
* Example 1: Changing Chart Title and Font Size
You can customize the title and font size of your chart using the title and fontSize properties within the options object:
 options: {
   plugins: {
       title: {
           display: true,
           text: 'Customized Chart Title',
           fontSize: 16,
       }
   },
   // Other options...
}
Step 5: Exploring Advanced Chart Types
Chart.js goes beyond the basics, offering various chart types such as line charts, radar charts, and pie charts. Experiment with these advanced types to discover the full spectrum of possibilities for conveying your data visually.
You've successfully integrated Chart.js into your project, creating a foundation for dynamic and engaging data visualizations. As you continue to explore the diverse features and customization options, you'll find that Chart.js empowers you to craft visually stunning and insightful representations of data on the web. Embrace the flexibility and robust capabilities of Chart.js as you embark on your journey to elevate your data visualization game.
To read more about charts in Odoo using Chart Js, refer to our blog Basic Charts in Odoo Using Chart Js